Author: Dmitriy Gurkovskiy, Chief Analyst at RoboForex
Oil is starting the final October week in the “red”. On Monday, October 26th, Brent is looking rather weak while trading at $41.
Probably, the situation is influenced by another wave of market concerns and fears relating to a stable demand for energies in the future. While many countries around the world are introducing more and more restrictions to slow down the second wave of COVID-19, global economies are “shrinking” again. Under such circumstances, even considering the start of the heating season in the USA and Europe, the demand for energy commodities remains quite limited.
From the fundamental point of view, there are two factors that put pressure on the oil market. The first one lies in the growth of the rig numbers in the USA – the report from Baker Hughes showed 6 additional units over the week. The second factor is connected with the oil production increase in Libya.
It became known earlier that NOC, the Libyan National Oil Corporation, would remove the force majeure status for two seaport terminals and increase the oil production. At a time of quite low demand for oil, delivery expansion from Libya may put additional pressure on the oil price.
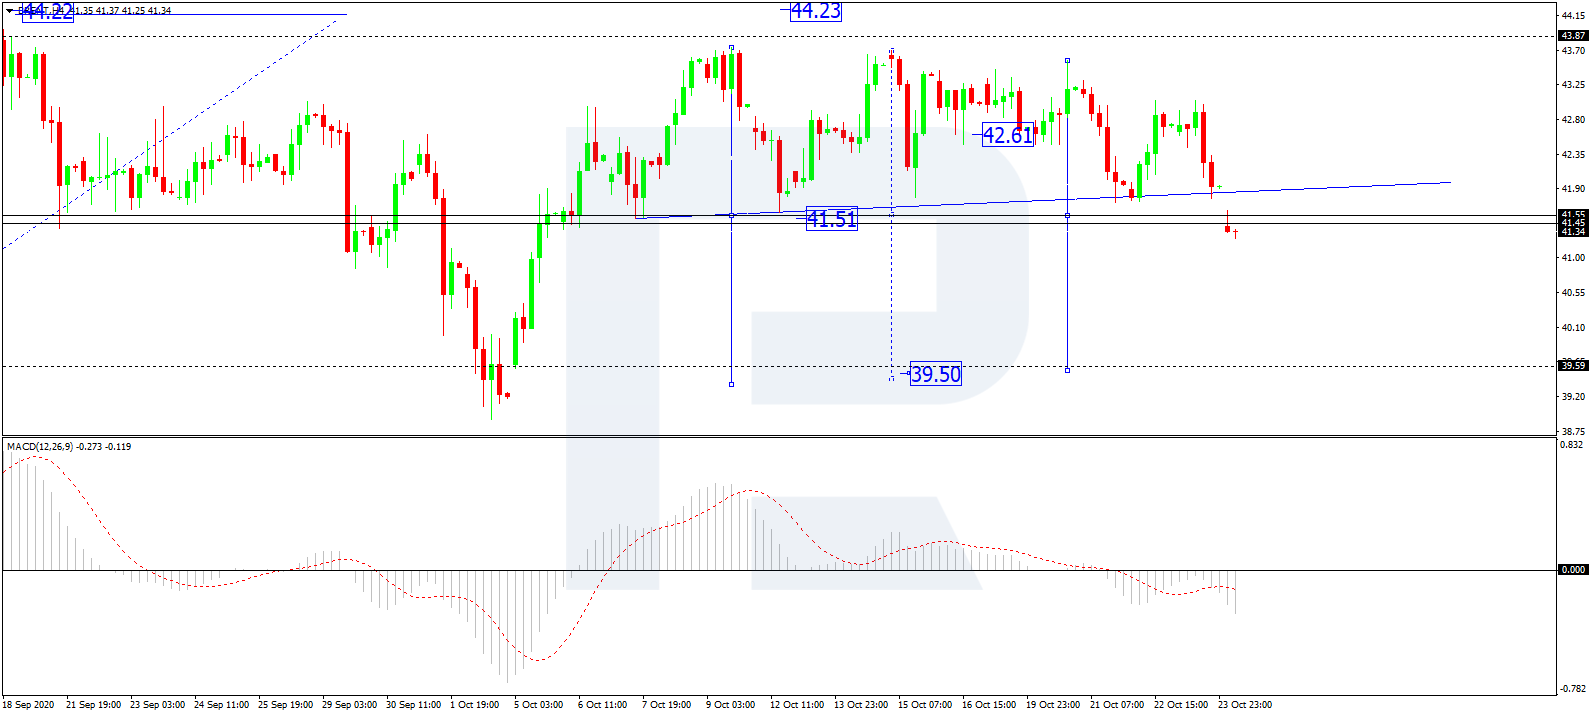
In the H4 chart, after reaching the predicted correctional target at 41.50, Brent is moving to break this level to the downside. Possibly, the asset may form a narrow consolidation range around this level. If later the price breaks this range to the downside, the market may extend this correction down to 39.50; if to the upside – grow to reach 42.50 and then return to 41.50. From the technical point of view, this scenario is confirmed by MACD Oscillator: its signal line is moving below 0. After the line enters the histogram area, the downtrend on the price chart will continue.

As we can see in the H1 chart, after completing the descending wave at 41.30, Brent is consolidating around this level. If later the price breaks this range to the upside, the market may resume growing towards 42.20; if to the downside – continue moving within the downtrend to reach 40.54. From the technical point of view, this idea is confirmed by Stochastic Oscillator: its signal line is moving below 50 within the “oversold area”. It has already reached 20 and may break the area to the upside towards 50, which suggests a new correction on the price chart.

Disclaimer
Any forecasts contained herein are based on the author’s particular opinion. This analysis may not be treated as trading advice. RoboForex bears no responsibility for trading results based on trading recommendations and reviews contained herein.
