
Article By RoboForex.com
BTCUSD, “Bitcoin vs US Dollar”
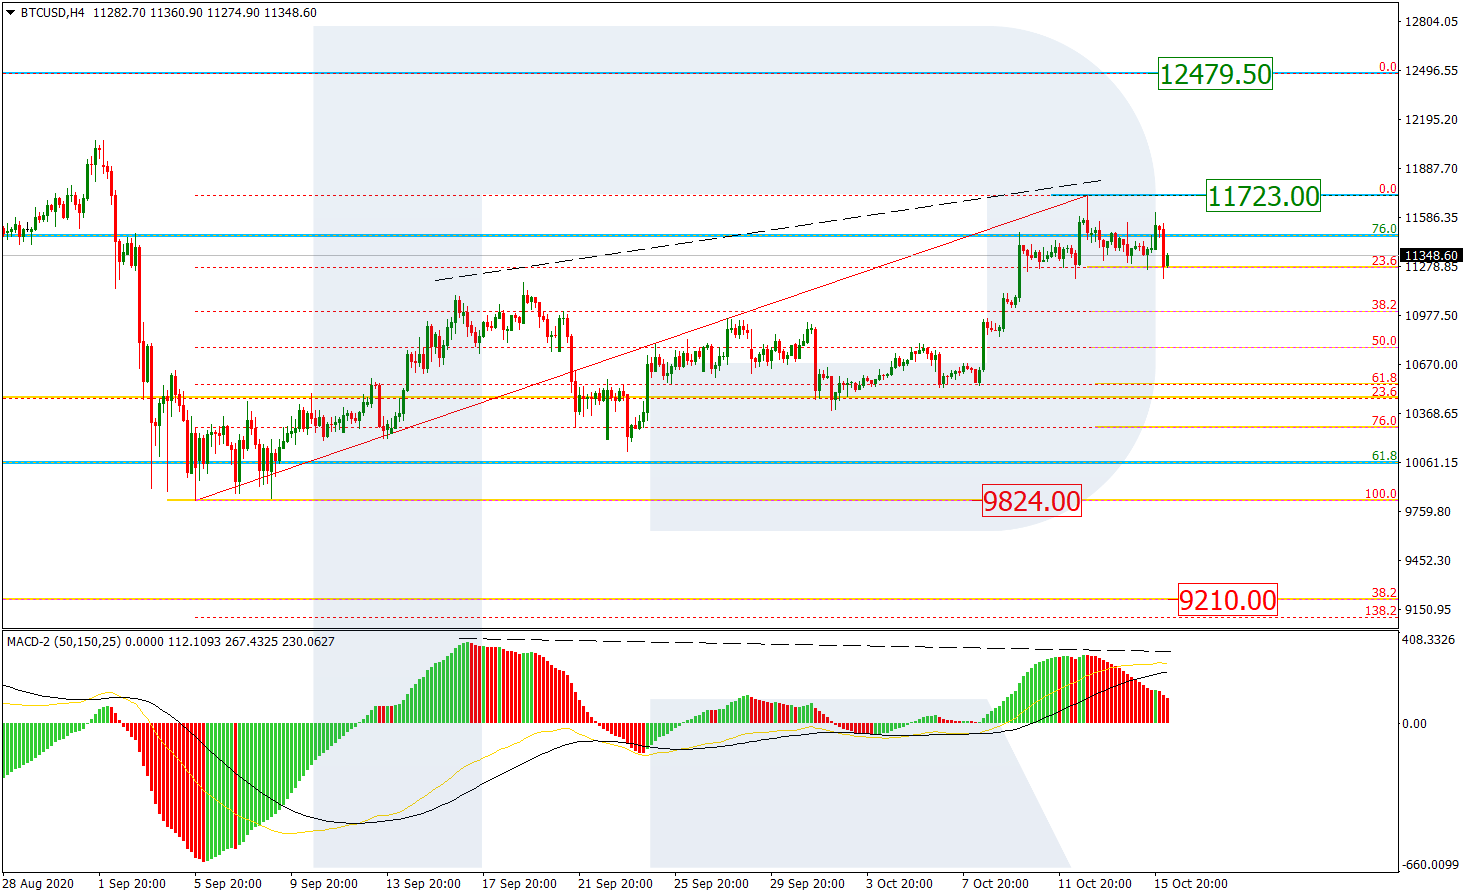
In the H4 chart, there is a divergence on MACD, which may indicate further growth towards the high at 12479.50 but only after the price breaks the current high at 11723.00. However, the main scenario implies that the BTCUSD may continue falling with the short-term target at the low at 9824.00. After breaking this level, the next descending wave may be heading towards the mid-term 38.2% fibo at 9210.00.

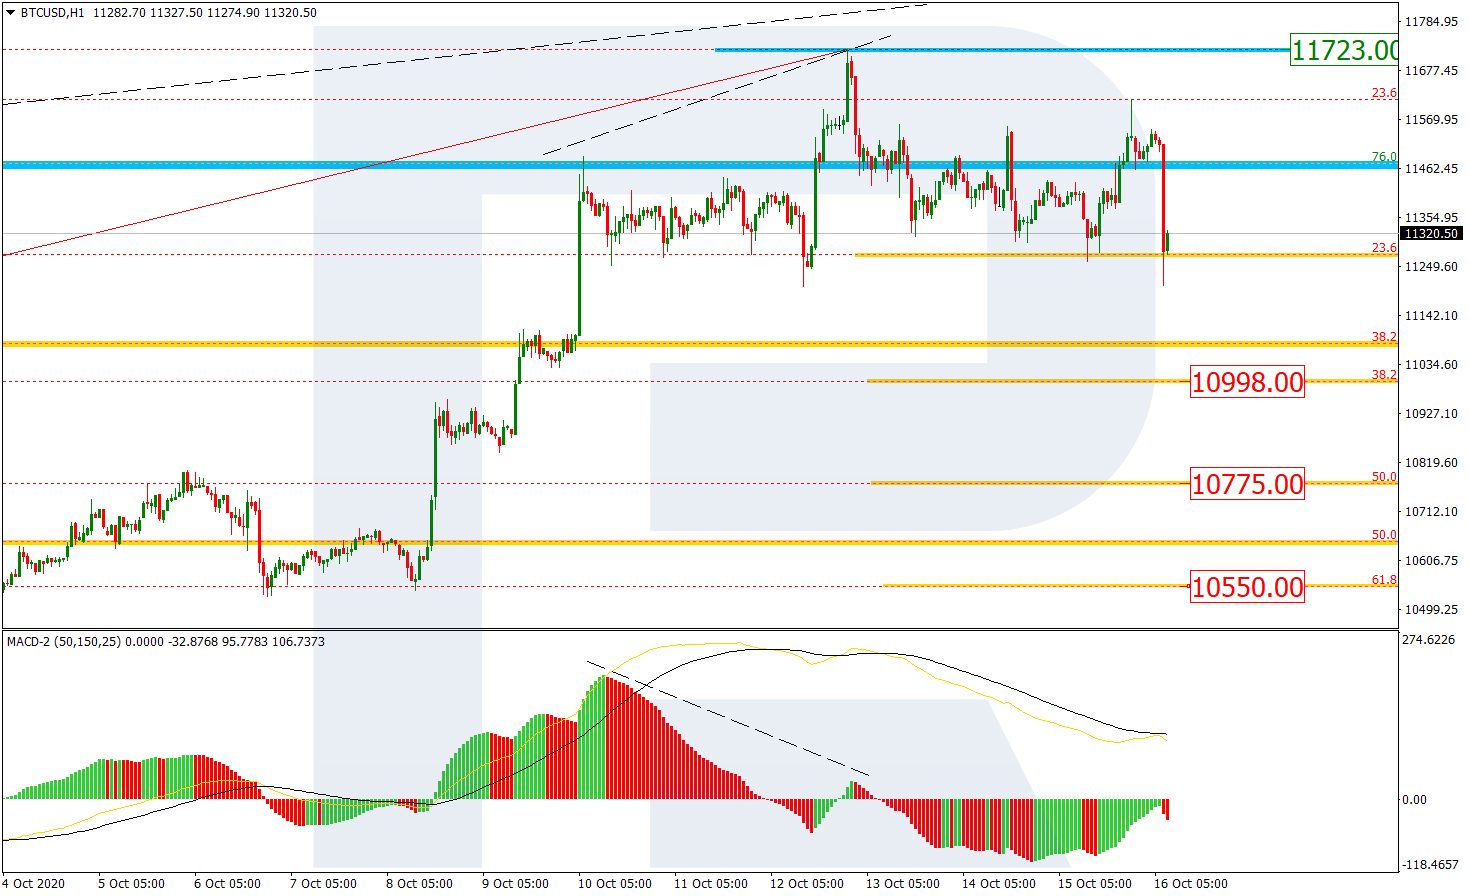
The H1 chart shows a more detailed structure of the current correction. The first descending wave has reached 23.6% fibo and later may move towards 38.2%, 50.0%, and 61.8% fibo at 10998.00, 10775.00, and 10550.00 respectively.
Free Reports:
 Get our Weekly Commitment of Traders Reports - See where the biggest traders (Hedge Funds and Commercial Hedgers) are positioned in the futures markets on a weekly basis.
 Download Our Metatrader 4 Indicators – Put Our Free MetaTrader 4 Custom Indicators on your charts when you join our Weekly Newsletter
ETHUSD, “Ethereum vs. US Dollar”
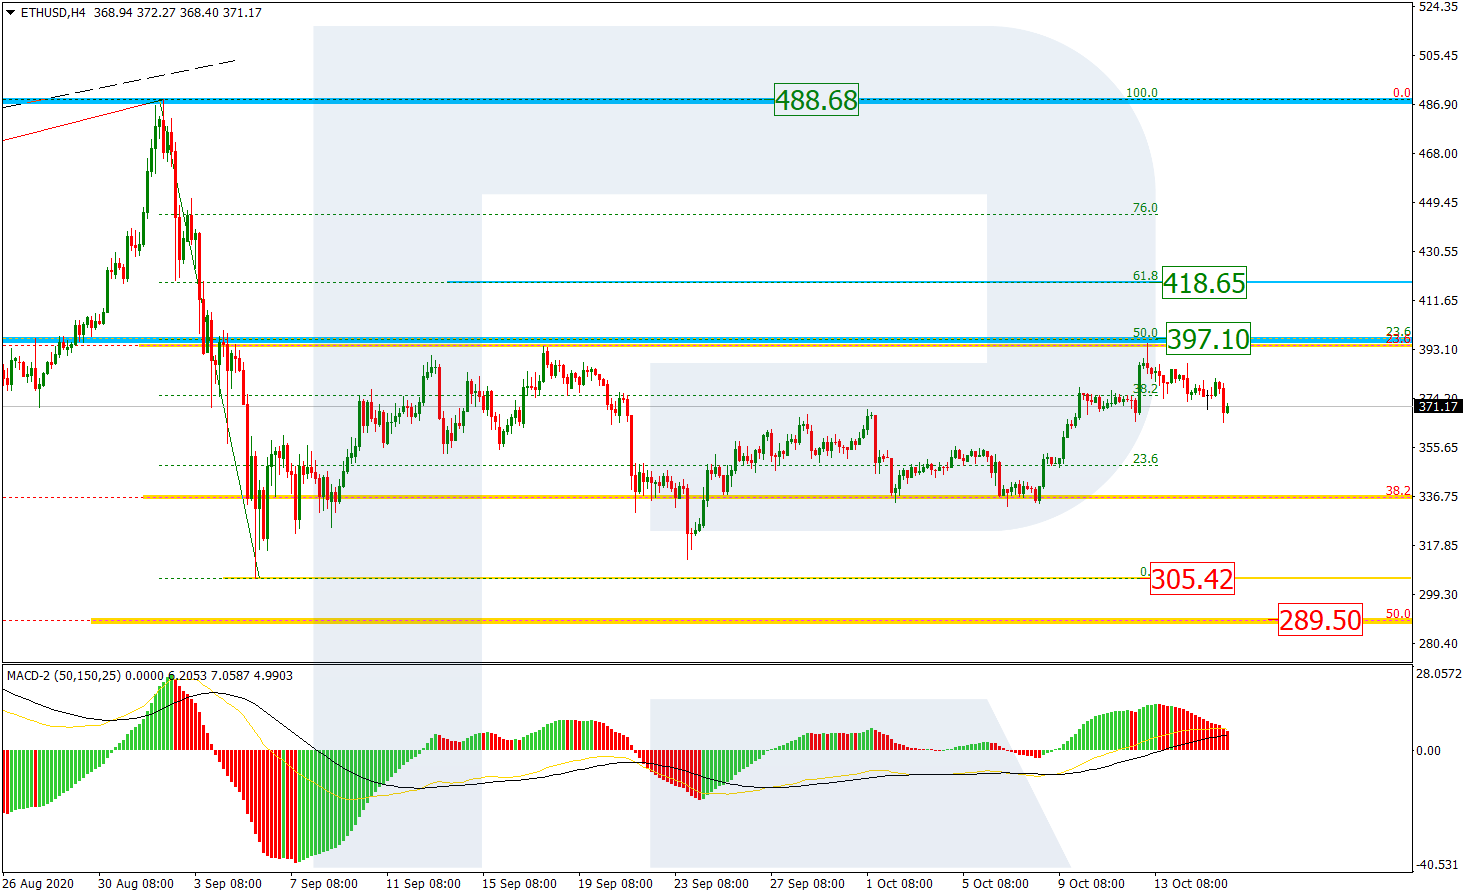
As we can see in the H4 chart, Ethereum has tried to re-test 50.0% fibo at 397.10. as long as the price is moving above the fractal low at 305.42, one shouldn’t exclude a possibility of further growth towards 61.8% fibo at 418.65. However, if ETHUSD manages to form a stable downtrend and break the above-mentioned low, the instrument may continue falling to reach 50.0% fibo at 289.50. The resistance is the high at 488.68.
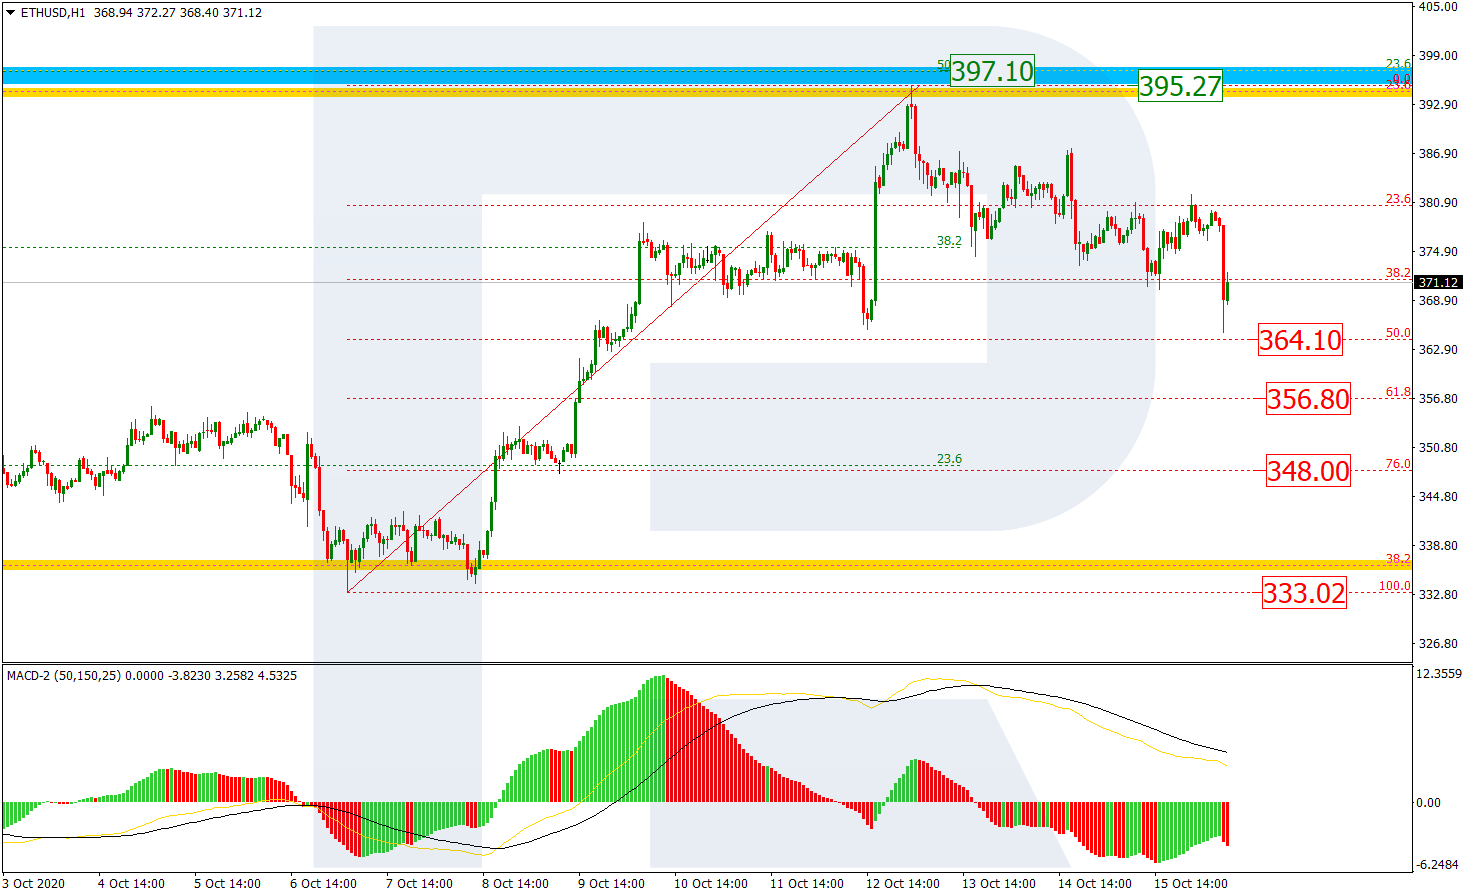
In the H1 chart, the pair is heading towards 50.0% fibo at 364.10 after a divergence. Later, the price may continue falling to reach 61.8% and 76.0% fibo at 356.80 and 348.88, as well as the low at 333.02. The local resistance is the high at 395.27.
Article By RoboForex.com
Attention!
Forecasts presented in this section only reflect the author’s private opinion and should not be considered as guidance for trading. RoboForex LP bears no responsibility for trading results based on trading recommendations described in these analytical reviews.

- COT Metals Charts: Speculator Bets led by Silver, Gold & Platinum Mar 7, 2026
- COT Bonds Charts: Speculator Bets led by 10-Year Bonds & Fed Funds Mar 7, 2026
- COT Energy Charts: Speculator Bets led by Brent Oil & Heating Oil Mar 7, 2026
- COT Soft Commodities Charts: Speculator Bets led by Corn & Soybean Meal Mar 7, 2026
- Investors run to safe-haven assets amid Middle East escalation Mar 6, 2026
- EUR/USD Under Pressure: Middle East Risks Outweigh All Else Mar 6, 2026
- Bitcoin shows resilience to Middle East events. Oil market stabilizes Mar 5, 2026
- GBP/USD: Market Not Expecting BoE Rate Cut in March Mar 5, 2026
- Brent headed for $100? Mar 4, 2026
- Global stock indices continue sell-off due to Middle East conflict Mar 4, 2026