
Article By RoboForex.com
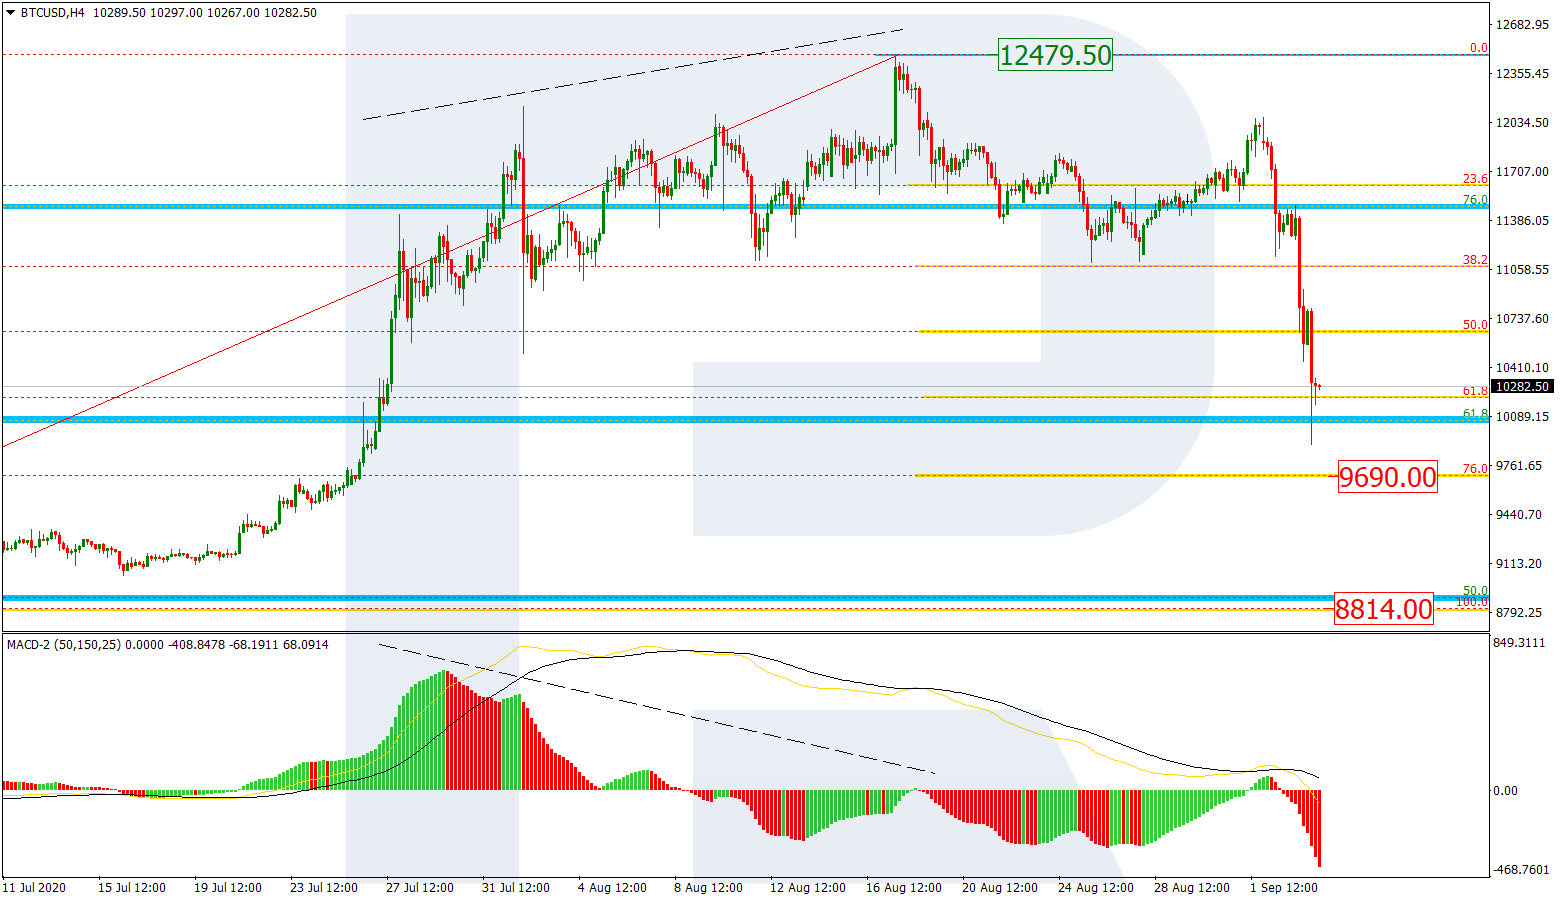
BTCUSD, “Bitcoin vs US Dollar”
On H4, the Bitcoin demonstrates the development of a steep declining wave after a short-term pullback. The bearish wave reached 61.8% Fibo and may proceed to 76.0% (9690.00). The main goal of such a movement may be the fractal low of 8814.00. The resistance is still at the peak of 12479.50.

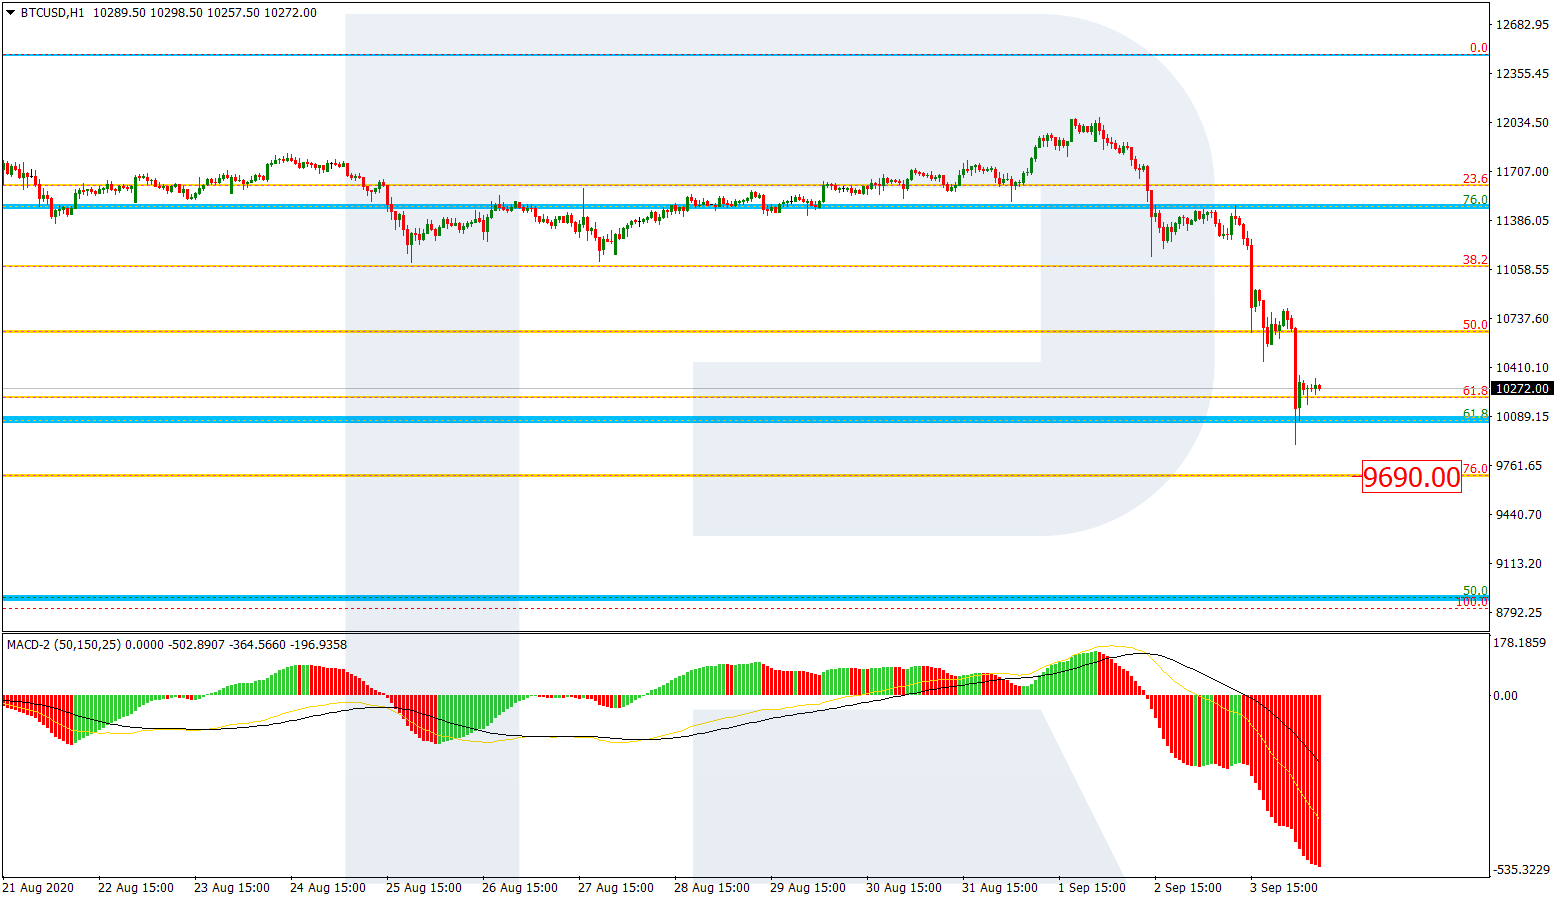
On H1, the declining wave kept going down the Fibo levels gradually with short pullbacks. Currently, having reached 61.8% Fibo, the market is performing a pullback. Another goal of the decline is 76.0%; upon reaching this, a pullback may bring the quotations to 38.2%.
Free Reports:
 Sign Up for Our Stock Market Newsletter – Get updated on News, Charts & Rankings of Public Companies when you join our Stocks Newsletter
 Get our Weekly Commitment of Traders Reports - See where the biggest traders (Hedge Funds and Commercial Hedgers) are positioned in the futures markets on a weekly basis.
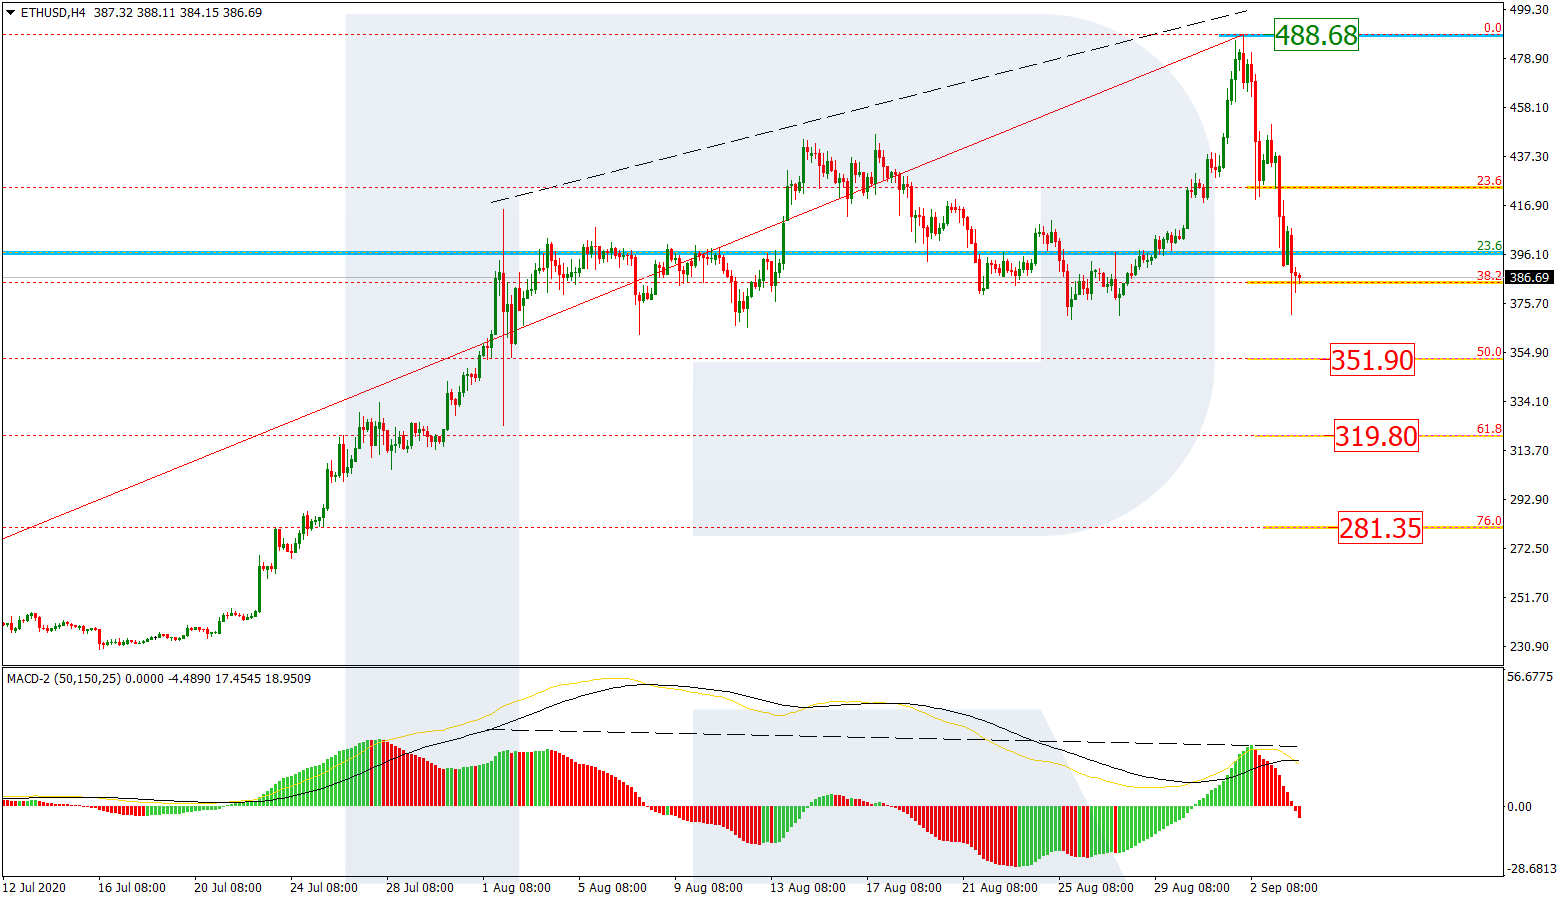
ETHUSD, “Ethereum vs. US Dollar”
On H4, the market is developing a downtrend after an uptrend and a divergence. The declining wave broke away 38.2% and is testing it. The next goals of the decline are 50.0% (351.90), 61.8% (319.80), and 76.0% (281.35). The resistance is at the high of 488.68.
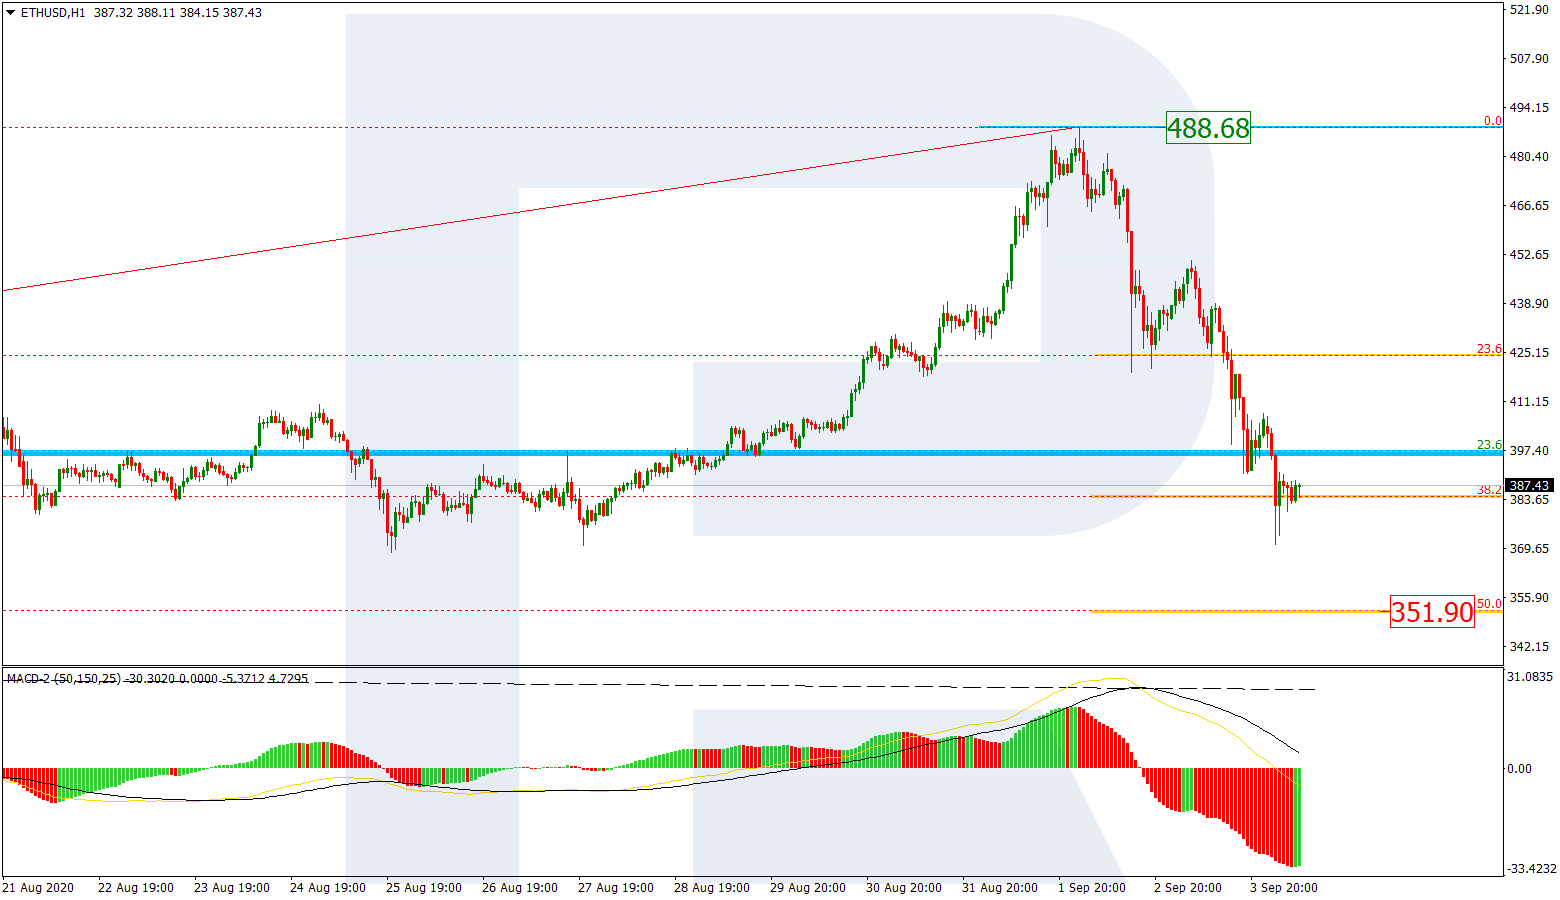
On H1, the Ethereum, having reached 38.2% Fibo, is performing a short-term pullback. The next goal of the decline is 50.0% (351.90).
Article By RoboForex.com
Attention!
Forecasts presented in this section only reflect the author’s private opinion and should not be considered as guidance for trading. RoboForex LP bears no responsibility for trading results based on trading recommendations described in these analytical reviews.

- IEA deploys strategic reserves to halt soaring oil prices Mar 11, 2026
- GBP/USD Managed to Rise, but Pressure Factors Remain in Place Mar 11, 2026
- Trump signals de-escalation in the Middle East; China’s trade surplus hits a new record Mar 10, 2026
- EUR/USD in Turbulence: Market Questions When Conflict Over Iran Will End Mar 10, 2026
- Prices push oil above $100 per barrel Mar 9, 2026
- COT Metals Charts: Speculator Bets led by Silver, Gold & Platinum Mar 7, 2026
- COT Bonds Charts: Speculator Bets led by 10-Year Bonds & Fed Funds Mar 7, 2026
- COT Energy Charts: Speculator Bets led by Brent Oil & Heating Oil Mar 7, 2026
- COT Soft Commodities Charts: Speculator Bets led by Corn & Soybean Meal Mar 7, 2026
- Investors run to safe-haven assets amid Middle East escalation Mar 6, 2026