
Article By RoboForex.com
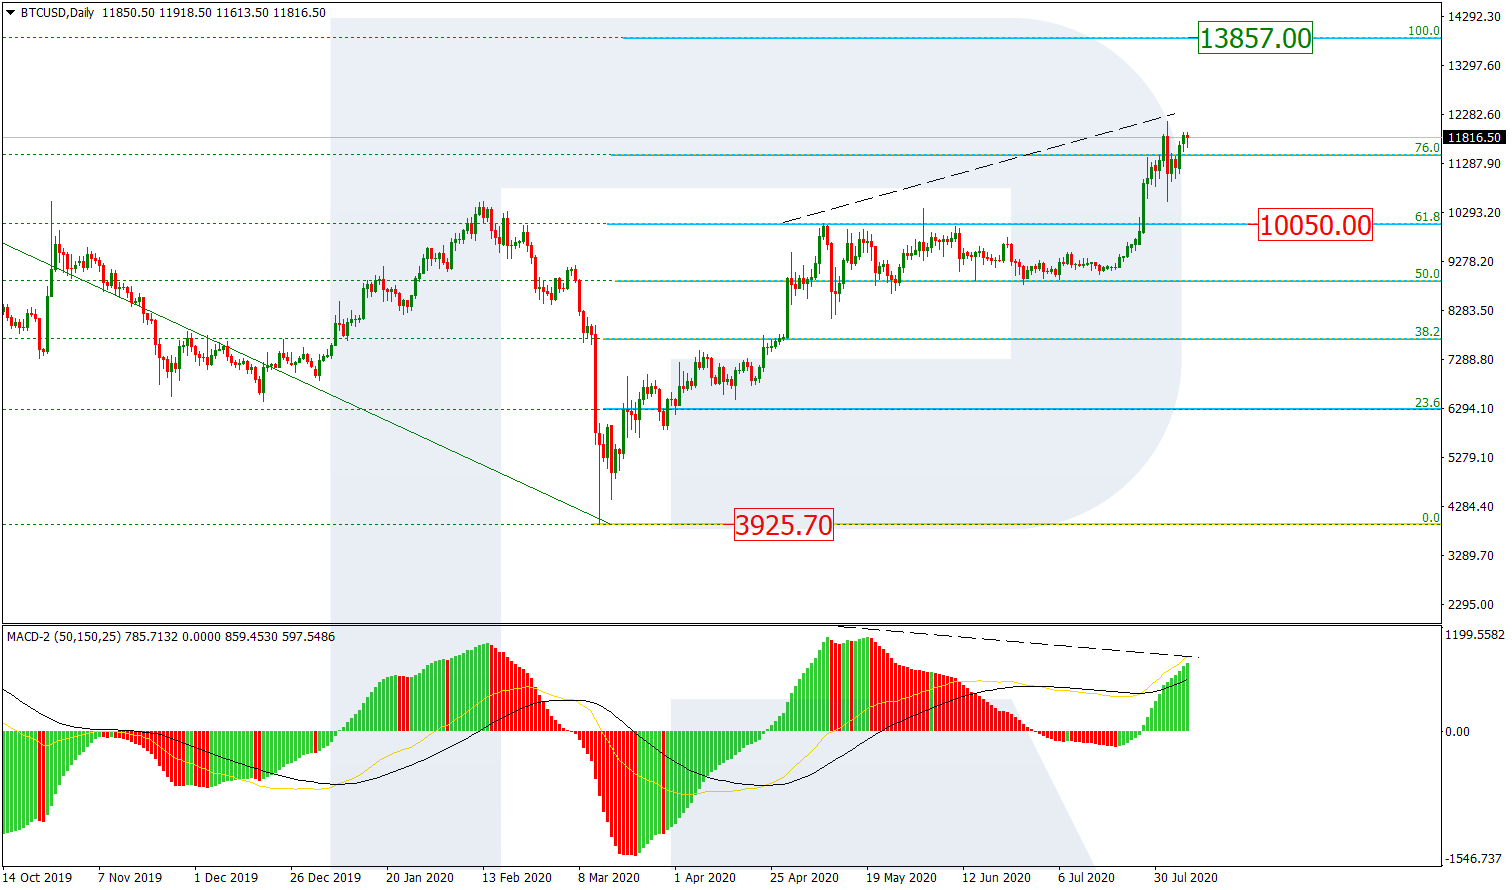
BTCUSD, “Bitcoin vs US Dollar”
As we can see in the daily chart, BTCUSD has slowed down its growth at 76.0% fibo; right now, it is correcting downwards after completing an ascending impulse. The next upside target may be the fractal high at 13857.00. it may be assumed that after reaching this target, the instrument will start another correction. The support is 61.8% fibo at 10500.00.

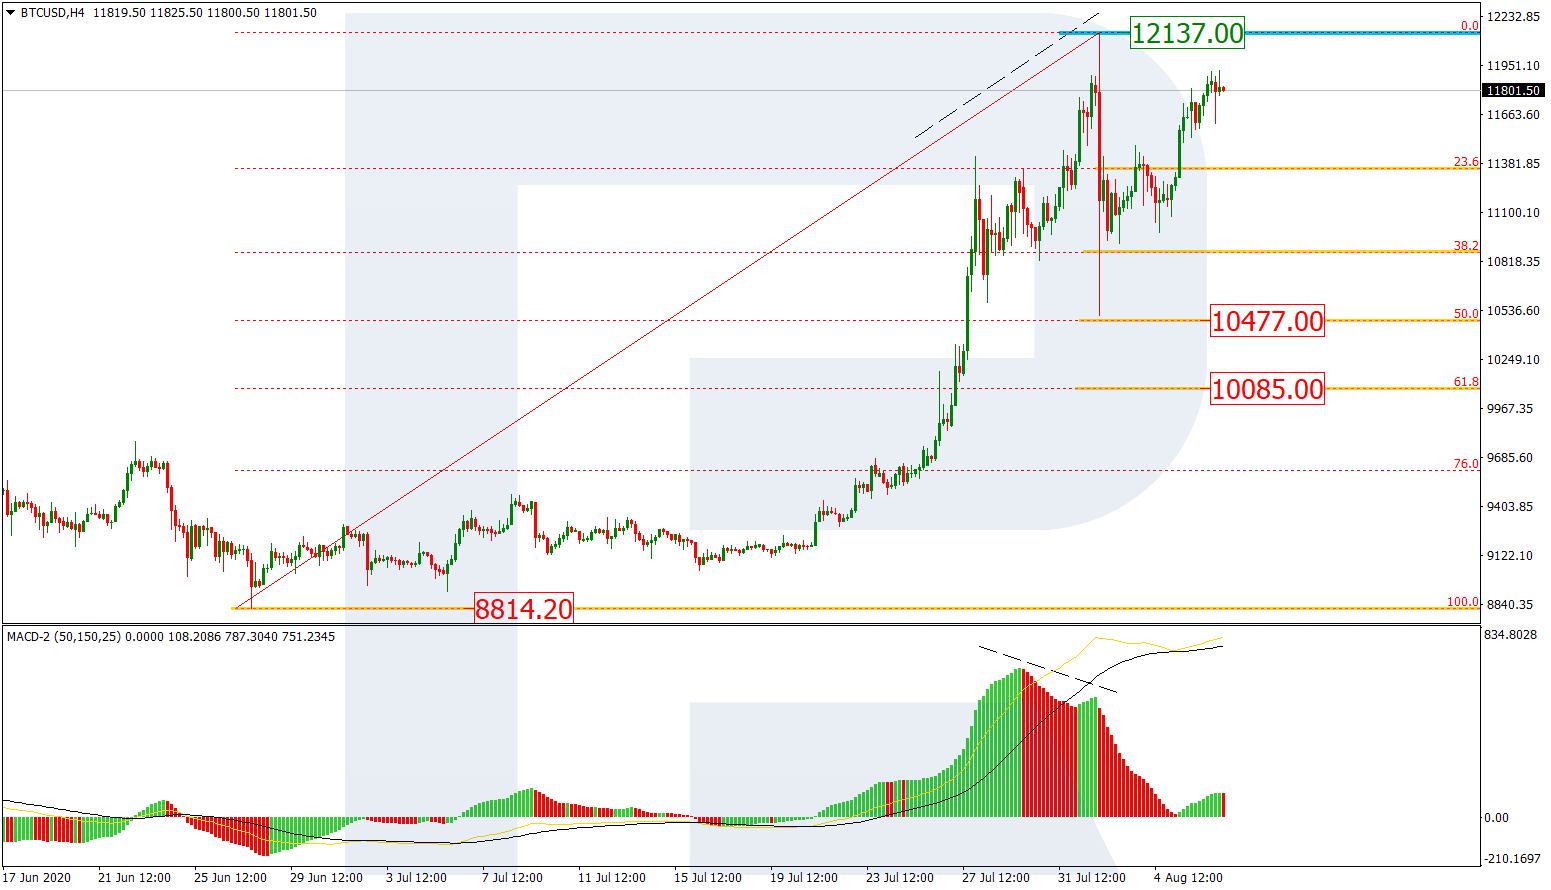
The H4 chart shows a more detailed structure of the current correction. There was a divergence on MACD, which made the pair start a new descending impulse that tried to break 50.0% fibo but failed. At the moment, the current rising wave, after reaching the high at 12137.00, has failed to test or break it. Later, the market may resume trading downwards to reach 50.0% and 61.8% fibo at 10477.00 and 10085.00 respectively.
Free Reports:
 Get our Weekly Commitment of Traders Reports - See where the biggest traders (Hedge Funds and Commercial Hedgers) are positioned in the futures markets on a weekly basis.
 Sign Up for Our Stock Market Newsletter – Get updated on News, Charts & Rankings of Public Companies when you join our Stocks Newsletter
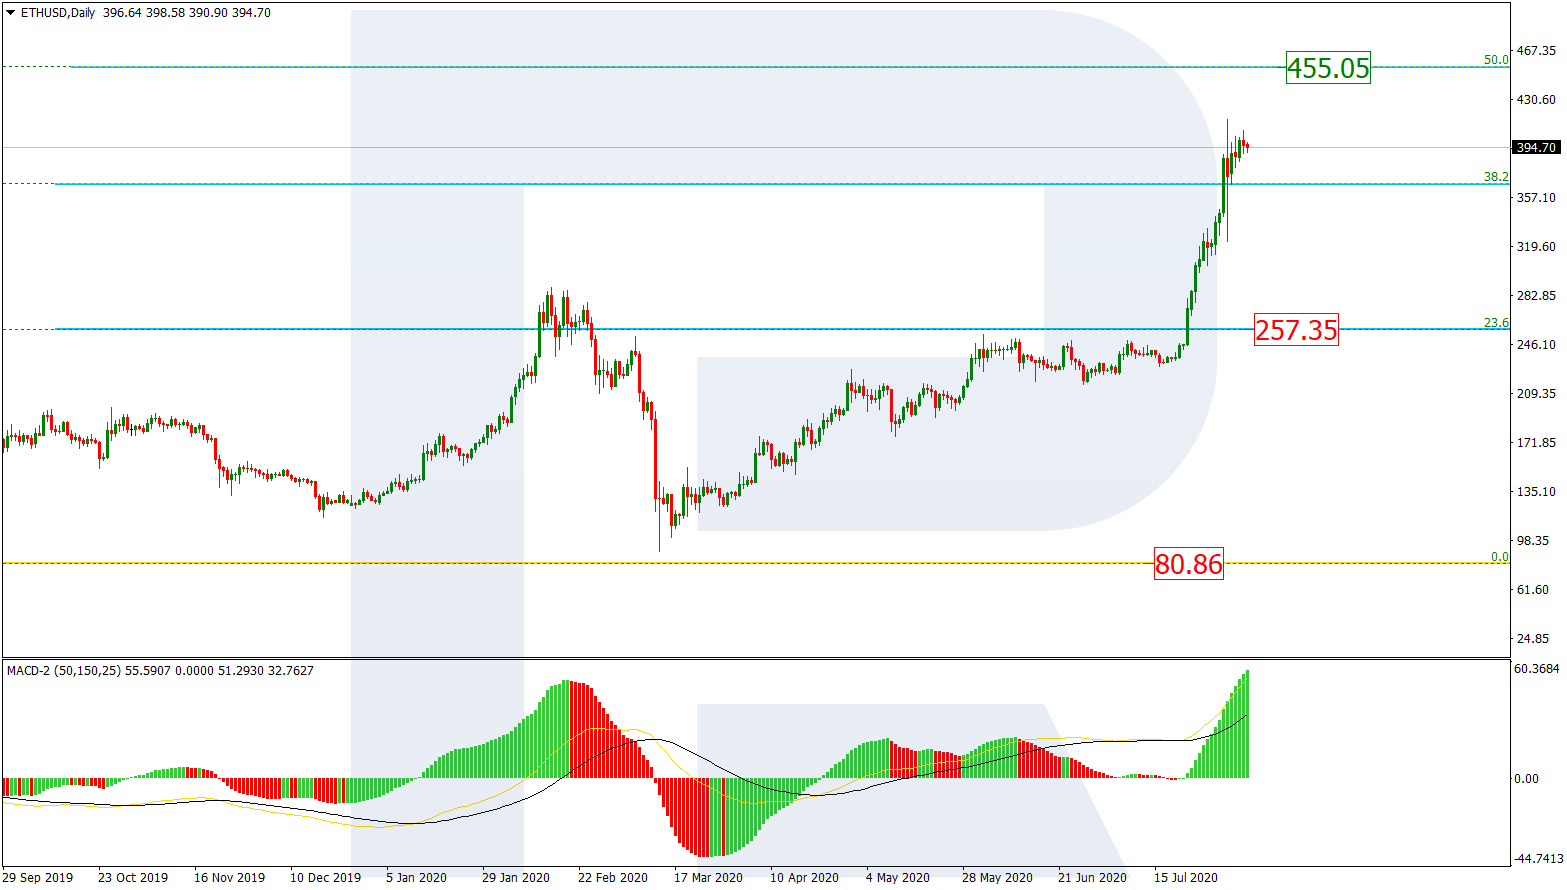
ETHUSD, “Ethereum vs. US Dollar”
As we can see in the daily chart, after breaking 38.2% fibo, Ethereum is correcting to the downside. The next upside target may be at 50.0% fibo at 455.05. One may assume that after reaching the target the asset may start a new correction. The key support is at 257.35.
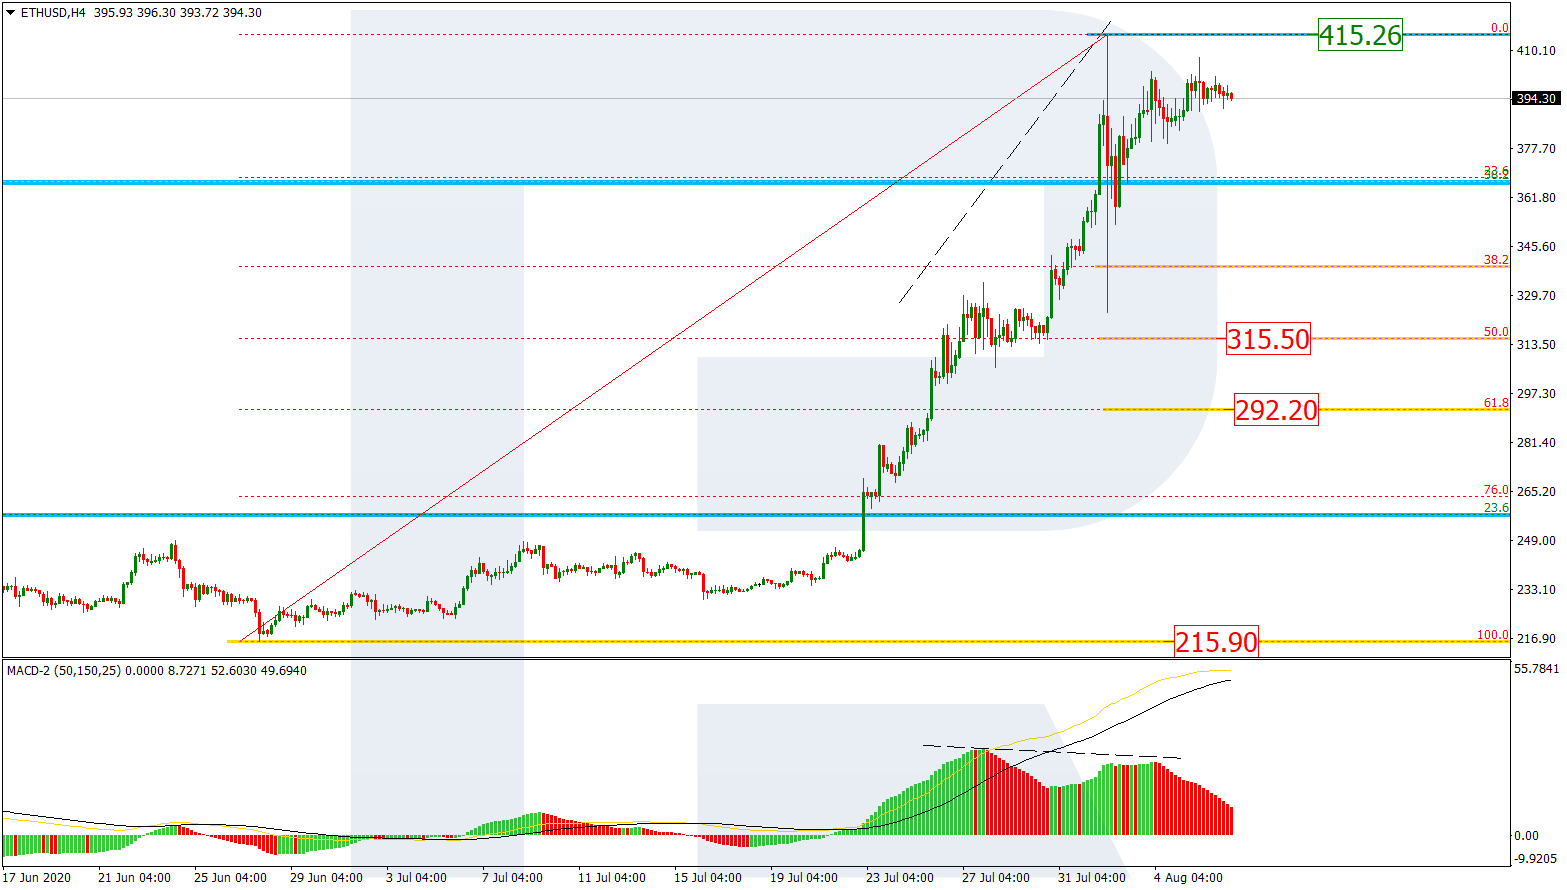
In the H4 chart, earlier, the divergence made the pair start a new descending impulse, which managed to break 38.2% fibo. After that, there was another rising wave, which has stopped close to the high at 415.26. Later, the asset may continue trading downwards to reach 50.0% and 61.8% fibo at 315.50 and 292.20 respectively.
Article By RoboForex.com
Attention!
Forecasts presented in this section only reflect the author’s private opinion and should not be considered as guidance for trading. RoboForex LP bears no responsibility for trading results based on trading recommendations described in these analytical reviews.

- Trump signals de-escalation in the Middle East; China’s trade surplus hits a new record Mar 10, 2026
- EUR/USD in Turbulence: Market Questions When Conflict Over Iran Will End Mar 10, 2026
- Prices push oil above $100 per barrel Mar 9, 2026
- COT Metals Charts: Speculator Bets led by Silver, Gold & Platinum Mar 7, 2026
- COT Bonds Charts: Speculator Bets led by 10-Year Bonds & Fed Funds Mar 7, 2026
- COT Energy Charts: Speculator Bets led by Brent Oil & Heating Oil Mar 7, 2026
- COT Soft Commodities Charts: Speculator Bets led by Corn & Soybean Meal Mar 7, 2026
- Investors run to safe-haven assets amid Middle East escalation Mar 6, 2026
- EUR/USD Under Pressure: Middle East Risks Outweigh All Else Mar 6, 2026
- Bitcoin shows resilience to Middle East events. Oil market stabilizes Mar 5, 2026