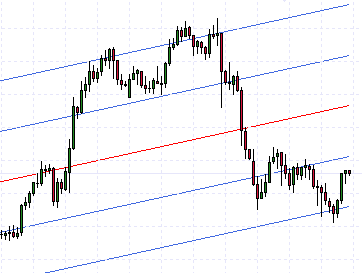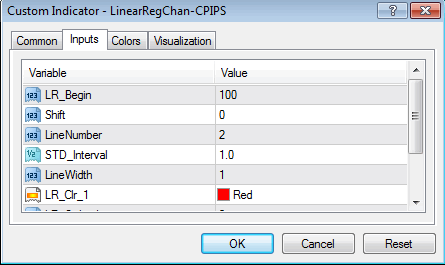


LR_Begin: Length of the linear regression lines in bars
Shift: Numbers of bars to be shifted, positive # for shift into past, negative # for shift into future
LineNumber: Number of channels to add each above and below regression line
STD_Interval: Number of standard deviations separating linear regression and 1st channel
LineWidth: Width of line and channels
LR_Clr_1: Color of linear regression line
LR_Style_1: Style of linear regression line
LR_Clr_1: Color of channels
LR_Style_1: Style of channels
LineBack: True or False = Set the line and channels as a background object


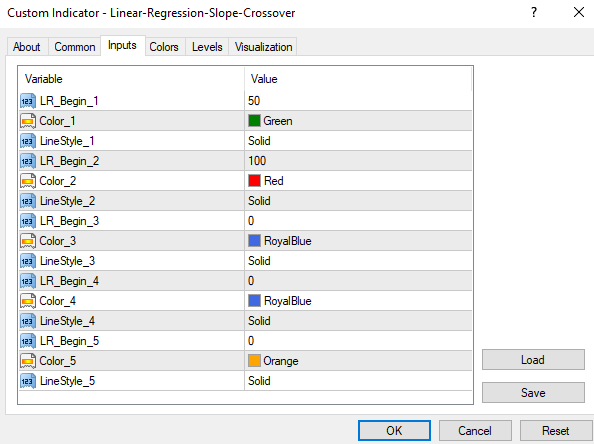
LR_Begin: This will determine the number of periods (bars or candles) for linear regression calculation.
Color: Color of the line
LineStyle: Style of Line
Up to 5 lines possible
** Placing a zero in for Period will not show that line
LR_Begin: This will determine the number of periods (bars or candles) for linear regression calculation.
DrawLRL: Include a visual linear regression line on top price chart? True or False (Good when just using this indicator alone)
LineWidth: Width of price chart line
LineColor: Color of price chart line
LineStyle: Style of price chart line
LineBack: True = Set the line and channels as a background object
**To Change the color of the histogram bars, go to Colors heading (see above image)
This website uses cookies.