Currency COT Report: Forex Speculators added to US Dollar bets for 5th week

By CountingPips.com

 usd-values


The latest data for the weekly Commitments of Traders (COT) report, released by the Commodity Futures Trading Commission (CFTC) on Monday due to the US holiday last week, showed that large futures traders added to their bets for the US dollar last week for a fifth consecutive week.

Non-commercial large futures traders, including hedge funds and large International Monetary Market speculators, had an overall US dollar long position totaling $20.39 billion as of Tuesday November 26th, according to Reuters. This was a weekly change of $3.29 billion from the $17.1 billion bullish position that was registered on November 19th, according to the data from Reuters that calculates this amount by the total of US dollar contracts against the combined contracts of the euro, British pound, Japanese yen, Australian dollar, Canadian dollar and the Swiss franc.

This latest data pushes the US dollar bullish positions to a new highest level since September 10th when US dollar bets were long at a total of $22.01 billion. Large spec bets have increased for the dollar over the last five weeks since USD bets fell to a $-3.64 billion net level on October 22nd.


Individual Currencies Large Speculators Positions in Futures:

The large non-commercial net positions for each of the individual major currencies directly against the US dollar saw weekly advances for the British pound sterling, Swiss franc, Mexican peso and the Australian dollar while there were weekly shortfalls for the euro, Canadian dollar, New Zealand dollar and the Japanese yen which fell to a new lowest level of 2013.


Individual Currency Charts:


EuroFX:

eurofx

Last Six Weeks of Large Trader Positions: EuroFX

DateLarge Trader Net PositionsWeekly Change
10/22/20137243412060
10/29/201370617-1817
11/05/201333143-37474
11/12/201316826-16317
11/19/20138911-7915
11/26/2013-431-9342


British Pound Sterling:

gbp

Last Six Weeks of Large Trader Positions: Pound Sterling

DateLg Trader NetWeekly Change
10/22/2013142622031
10/29/201310162-4100
11/05/2013-2392-12554
11/12/2013-9303-6911
11/19/2013-16657638
11/26/20133912056


Japanese Yen:

jpy

Last Six Weeks of Large Trader Positions: Yen

DateLg Trader NetWeekly Change
10/22/2013-71802-12536
10/29/2013-623959407
11/05/2013-73792-11397
11/12/2013-95107-21315
11/19/2013-112216-17109
11/26/2013-123202-10986


Swiss Franc:

chf

Last Six Weeks of Large Trader Positions: Franc

DateLg Trader NetWeekly Change
10/22/201310931164
10/29/201311451520
11/05/20138095-3356
11/12/20133189-4906
11/19/20133669480
11/26/20134652983


Canadian Dollar:

cad

Last Six Weeks of Large Trader Positions: CAD

DateLg Trader NetWeekly Change
10/22/2013-53645450
10/29/2013-15237-9873
11/05/2013-18002-2765
11/12/2013-160921910
11/19/2013-16335-243
11/26/2013-28780-12445


Australian Dollar:

aud

Last Six Weeks of Large Trader Positions: AUD

DateLg Trader NetWeekly Change
10/22/2013-2211110126
10/29/2013-23198-1087
11/05/2013-25067-1869
11/12/2013-35809-10742
11/19/2013-3576247
11/26/2013-335112251


New Zealand Dollar:

nzd

Last Six Weeks of Large Trader Positions: NZD

DateLg Trader NetWeekly Change
10/22/201313114446
10/29/201310625-2489
11/05/20139708-917
11/12/201310366658
11/19/2013124762110
11/26/201310249-2227


Mexican Peso:

mxn

Last Six Weeks of Large Trader Positions: MXN

DateLg Trader NetWeekly Change
10/22/20137214-547
10/29/20134896-2318
11/05/20135180284
11/12/201370171837
11/19/201395392522
11/26/2013124632924


*COT Report: The weekly commitment of traders report summarizes the total trader positions for open contracts in the futures trading markets. The CFTC categorizes trader positions according to commercial hedgers (traders who use futures contracts for hedging as part of the business), non-commercials (large traders who speculate to realize trading profits) and nonreportable traders (usually small traders/speculators).

The Commitment of Traders report is published every Friday by the Commodity Futures Trading Commission (CFTC) and shows futures positions data that was reported as of the previous Tuesday (3 days behind).

Each currency contract is a quote for that currency directly against the U.S. dollar, a net short amount of contracts means that more speculators are betting that currency to fall against the dollar and a net long position expect that currency to rise versus the dollar.

(The graphs overlay the forex spot closing price of each Tuesday when COT trader positions are reported for each corresponding spot currency pair.)

See more information and explanation on the weekly COT report from the CFTC website.


Article by CountingPips.comForex News


USDCHF Daily Forex Fibonacci Levels & Trends Data 2013.12.02

2013.12.02 | USDCHF Market Analysis

USDCHF Trends & Fibonacci Retracement Levels

The USDCHF currency pair has been rising in forex market trading today with the USDCHF registering a high of 0.91093 and reaching to a low of 0.90422 on the day. Trends data shows the pair is currently trying to cross over into a short-term uptrend with prices trading over the 21-period linear moving average. Over the longer term trend, the pair continues to be in a downtrend as seen on the daily chart by the 90-day Linear Regression Channels below.

Forex Trends Trading USDCHF 2013.12.02


USDCHF Trends Data: Linear Regression Indicator

10-day current trend is BEARISH / Trend strength of -75.0 pips
30-day current trend is BULLISH / Trend strength of 152.5 pips
60-day current trend is BEARISH / Trend strength of -100.5 pips
90-day current trend is BEARISH / Trend strength of -269.7 pips
180-day current trend is BEARISH / Trend strength of -479.1 pips

Fibonacci Retracement Levels: Past 100 Days

— 0.000 – 0.88892
— 0.236 – 0.90413
— 0.382 – 0.91354
— 0.500 – 0.92115
— 0.618 – 0.92876
— 0.764 – 0.93817
— 1.000 – 0.95338


By CountingPips.com – Forex Trading Apps & Currency Trade Tools

Disclaimer: Foreign Currency trading and trading on margin carries a high level of risk and volatility and can result in loss of part or all of your investment. All information and opinions contained do not constitute investment advice and accuracy of prices, charts, calculations cannot be guaranteed.


NZDUSD Daily Forex Fibonacci Levels & Trends Data 2013.12.02

2013.12.02 | NZDUSD Market Analysis

NZDUSD Trends & Fibonacci Retracement Levels

The NZDUSD currency pair has been rising in forex market trading today after gapping higher to start the week with the NZDUSD registering a high of 0.82213 and reaching to a low of 0.81500 on the day. Trends data shows the pair is currently in process of trying to break out of the short-term downtrend with prices trading a bit over the 21-period linear moving average. Over the longer term trend, the pair continues to be in an uptrend as seen on the daily chart by the 90-day Linear Regression Channels below.

Forex Trends Trading NZDUSD 2013.12.02


NZDUSD Trends Data: Linear Regression Indicator

10-day current trend is BEARISH / Trend strength of -222.7 pips
30-day current trend is BEARISH / Trend strength of -222.6 pips
60-day current trend is BULLISH / Trend strength of 6.0 pips
90-day current trend is BULLISH / Trend strength of 470.9 pips
180-day current trend is BEARISH / Trend strength of -61.5 pips

Daily Fibonacci Retracement Levels: Past 100 Days

— 0.000 – 0.85410
— 0.236 – 0.83464
— 0.382 – 0.82260
— 0.500 – 0.81286
— 0.618 – 0.80313
— 0.764 – 0.79109
— 1.000 – 0.77163


By CountingPips.com – Forex Trading Apps & Currency Trade Tools

Disclaimer: Foreign Currency trading and trading on margin carries a high level of risk and volatility and can result in loss of part or all of your investment. All information and opinions contained do not constitute investment advice and accuracy of prices, charts, calculations cannot be guaranteed.


USDCAD Daily Forex Fibonacci Levels & Trends Data 2013.12.02

2013.12.02 | USDCAD Market Analysis

USDCAD Trends & Fibonacci Retracement Levels

The USDCAD currency pair has been gaining ground in forex market trading today with the USDCAD registering a high of 1.06526 and reaching to a low of 1.06126 on the day. Trends data shows the pair is currently in a short-term uptrend  with prices trading over the 21-period linear moving average. Over the longer term trend, the pair continues to be in an uptrend as seen on the daily chart by the 90-day Linear Regression Channels below. The uptrend is continuing through the top of the fibonacci retracement level (0.0%) that registered a new high last week.

Forex Trends Trading USDCAD 2013.12.02


USDCAD Trends Data: Linear Regression Indicator

10-day current trend is BULLISH / Trend strength of 222.9 pips
30-day current trend is BULLISH / Trend strength of 220.3 pips
60-day current trend is BULLISH / Trend strength of 283.6 pips
90-day current trend is BULLISH / Trend strength of 141.6 pips
180-day current trend is BULLISH / Trend strength of 311.5 pips

Fibonacci Retracement Levels: Past 100 Days

— 0.000 – 1.06270
— 0.236 – 1.05217
— 0.382 – 1.04566
— 0.500 – 1.04039
— 0.618 – 1.03512
— 0.764 – 1.02861
— 1.000 – 1.01808


By CountingPips.com – Forex Trading Apps & Currency Trade Tools


Disclaimer: Foreign Currency trading and trading on margin carries a high level of risk and volatility and can result in loss of part or all of your investment. All information and opinions contained do not constitute investment advice and accuracy of prices, charts, calculations cannot be guaranteed.


USDJPY Forex Trading Pivot Point Levels for 2013.12.02

2013.12.02 13:30 6:30AM ET | USDJPY Currency Pair

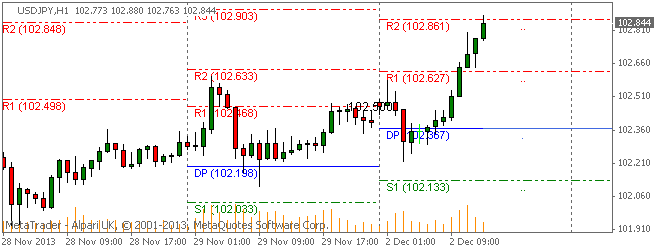
Here are the Pivot Points Levels with Support (S) and Resistance (R) for the USDJPY currency pair today. Price action is currently trading over the daily pivot point at the 102.844 price level, according to data at 6:30 AM ET. The USDJPY high for the day has been 102.880 while the low of day reached to 102.217. The pair earlier today opened the Asian trading session above the daily pivot, traded lower to below the pivot area and has trended higher over the course of the day.

SC USDJPY 2013.12.02

Daily Pivot Point: 102.367
— S1 – 102.134
— S2 – 101.873
— S3 – 101.640
— R1 – 102.628
— R2 – 102.861
— R3 – 103.122


Weekly Pivot Points: USDJPY

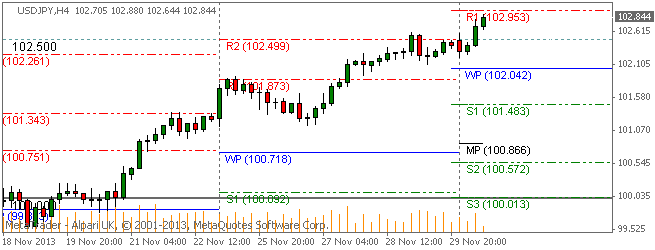
Prices are currently trading above the weekly pivot point after opening the trading week higher than both the weekly and monthly pivots.

SC USDJPY 2013.12.02

Weekly Pivot Point: 102.042
— S1 – 101.483
— S2 – 100.572
— S3 – 100.013
— R1 – 102.953
— R2 – 103.512
— R3 – 104.423


By CountingPips.com – Forex Trading Apps & Currency Trade Tools


Disclaimer: Foreign Currency trading and trading on margin carries a high level of risk and volatility and can result in loss of part or all of your investment. All information and opinions contained do not constitute investment advice and accuracy of prices, charts, calculations cannot be guaranteed.


EURUSD Forex Trading Pivot Point Levels for 2013.12.02

2013.12.02 13:30 6:30AM ET | EURUSD Currency Pair

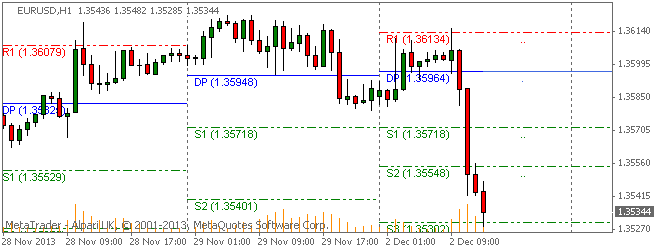
Here are the Pivot Points Levels with Support (S) and Resistance (R) for the EURUSD currency pair today. Price action is currently trading sharply under the daily pivot point at the 1.35344 price level, according to data at 6:30 AM ET. The EURUSD high for the day has been 1.36151 while the low of day reached to 1.35285. The pair earlier today opened the Asian trading session below the daily pivot, saw bullish price action into the R1 level and then has trended sharply lower to the S3 support level as the day has unfolded.

SC EURUSD 2013.12.02

Daily Pivot Point: 1.35964
— S1 – 1.35718
— S2 – 1.35548
— S3 – 1.35302
— R1 – 1.36134
— R2 – 1.36380
— R3 – 1.36550


Weekly Pivot Points: EURUSD

Prices are currently trading under the weekly pivot point after opening the trading week above this level which resides at the 1.3566 level.

SC EURUSD 2013.12.02

Weekly Pivot Point: 1.35664
— S1 – 1.35118
— S2 – 1.34348
— S3 – 1.33802
— R1 – 1.36434
— R2 – 1.36980
— R3 – 1.37750


By CountingPips.com – Forex Trading Apps & Currency Trade Tools


Disclaimer: Foreign Currency trading and trading on margin carries a high level of risk and volatility and can result in loss of part or all of your investment. All information and opinions contained do not constitute investment advice and accuracy of prices, charts, calculations cannot be guaranteed.


GBPUSD Forex Trading Pivot Point Levels for 2013.12.02

2013.12.02 13:30 6:30AM ET | GBPUSD Currency Pair

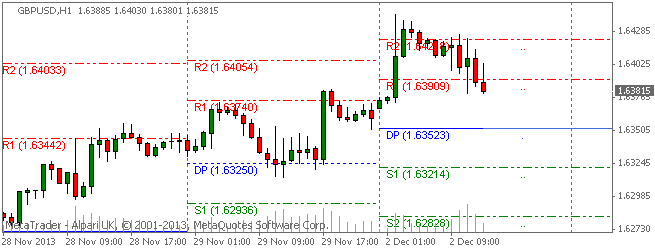
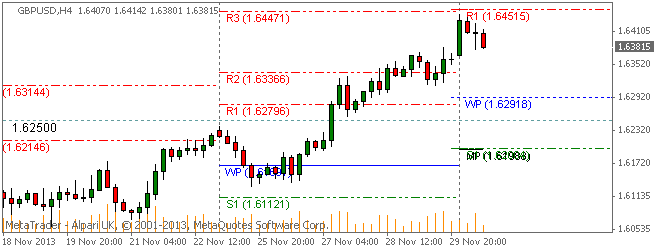
Here are the Pivot Points Levels with Support (S) and Resistance (R) for the GBPUSD currency pair today. Price action is currently trading above the daily pivot point at the 1.63815 price level, according to data at 6:30 AM ET. The GBPUSD high for the day has been 1.64414 while the low of day reached to 1.63678. The pair earlier today opened the Asian trading session above the daily pivot, traded higher to above the R2 resistance and then has been trending lower in the middle of the day.

SC GBPUSD 2013.12.02

Daily Pivot Point: 1.63523
— S1 – 1.63214
— S2 – 1.62828
— S3 – 1.62519
— R1 – 1.63909
— R2 – 1.64218
— R3 – 1.64604


Weekly Pivot Points: GBPUSD

Prices are currently trading over the weekly pivot point to start the trading week. The GBPUSD has opened the trading week well above the weekly and monthly pivots.

SC GBPUSD 2013.12.02

Weekly Pivot Point: 1.62918
— S1 – 1.62003
— S2 – 1.60407
— S3 – 1.59492
— R1 – 1.64514
— R2 – 1.65429
— R3 – 1.67025


By CountingPips.com – Forex Trading Apps & Currency Trade Tools


Disclaimer: Foreign Currency trading and trading on margin carries a high level of risk and volatility and can result in loss of part or all of your investment. All information and opinions contained do not constitute investment advice and accuracy of prices, charts, calculations cannot be guaranteed.


USDCHF Forex Trading Pivot Point Levels for 2013.12.02

2013.12.02 13:30 6:30AM ET | USDCHF Currency Pair

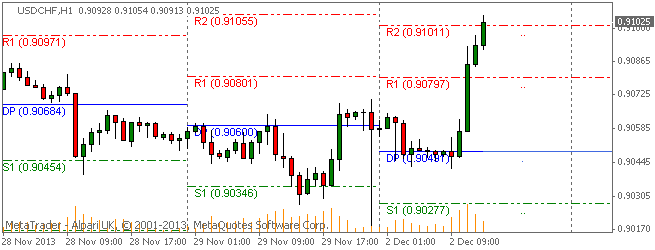
Here are the Pivot Points Levels with Support (S) and Resistance (R) for the USDCHF currency pair today. Price action is currently trading sharply over the daily pivot point at the 0.91025 price level, according to data at 6:30 AM ET. The USDCHF high for the day has been 0.91054 while the low of day reached to 0.90422. The pair earlier today opened the Asian trading session above the daily pivot and has trended higher to the R2 level (over 0.9100) at the time of writing.

SC USDCHF 2013.12.02

Daily Pivot Point: 0.90491
— S1 – 0.90278
— S2 – 0.89971
— S3 – 0.89758
— R1 – 0.90798
— R2 – 0.91011
— R3 – 0.91318


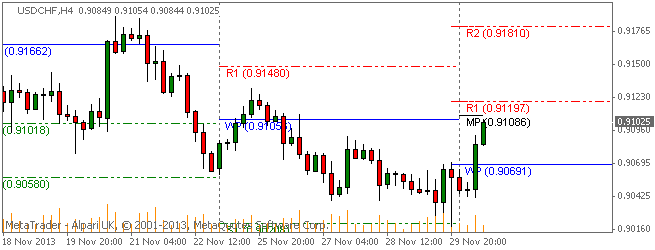
Weekly Pivot Points: USDCHF

Prices are currently trading higher than the weekly pivot point to start this trading week. The pair opened below the weekly and monthly pivots to start this week with the weekly pivot coming at 0.9069.

SC USDCHF 2013.12.02

Weekly Pivot Point: 0.90691
— S1 – 0.90078
— S2 – 0.89572
— S3 – 0.88959
— R1 – 0.91197
— R2 – 0.91810
— R3 – 0.92316


By CountingPips.comForex Trading Apps & Currency Trade Tools


Disclaimer: Foreign Currency trading and trading on margin carries a high level of risk and volatility and can result in loss of part or all of your investment. All information and opinions contained do not constitute investment advice and accuracy of prices, charts, calculations cannot be guaranteed.