Fundamental Outlook at 1400 GMT (EDT + 0400)

By GCI Fx Research

The euro moved lower vis-à-vis the U.S. dollar today as the single currency tested bids around the US$ 1.4365 level and was capped around the $1.4430 level.  The common currency retracted some of yesterday’s gains that saw the pair propelled to its highest level since October 2008.  In Fed news, traders are talking about tensions between the Obama administration and the Fed, SEC, and FIDC about the government’s plan to modify regulatory oversight over the agencies.  Many data were released in the U.S. today. First, the June employment cost index was up 0.4% q/q and 1.8% y/y. Second, June existing home sales improved for a fifth consecutive month, up 3.6% m/m, up from the revised 0.8% climb in May, while the June pending home sales index was up 9.2% y/y from a revised 5.4% in May.  Third, June personal income was off 1.3% m/m, a sharp turnaround from the revised May print of 1.3% while June personal spending was up 0.4%.  Fourth, the PCE deflator was off 0.4% y/y, down from a revised -0.3% y/y in May. The PCE core PCE index was up 0.2% m/m from 0.1% in May and up 1.5% y/y from 1.8% in May.  In eurozone news, most traders expect the European Central Bank will keep borrowing costs unchanged on Thursday when the Governing Council meets. Data released in the eurozone today saw EMU-16 July producer prices up 0.3% m/m and decline 0.6% y/y, the largest annual decline since at least January 1982.  Euro bids are cited around the US$ 1.3900 figure.

¥/ CNY

The yen depreciated marginally vis-à-vis the U.S. dollar today as the greenback tested offers around the ¥95.45 level and was supported around the ¥94.35 level. Japanese finance minister Yosano indicated he is not concerned about recent moves higher in long-term interest rates, characterizing them as “marginal.”  Economics minister Hayashi reported it is premature to know whether or not Japan has fallen back into deflation because core price declines are modest.  Data released in Japan overnight saw the July monetary base climb 6.1% y/y.  Also, it was reported Bank of Japan has purchased ¥38.10 billion of equities from banks as of 31 July as part of its ¥ 1 trillion quantitative easing program that will run through April 2010.  The Nikkei 225 stock index climbed 0.22% to close at ¥10,375.01.  U.S. dollar offers are cited around the ¥104.15 level.  The euro moved lower vis-à-vis the yen as the single currency tested bids around the ¥135.95 level and was capped around the ¥137.70 level.  The British pound moved lower vis-à-vis the yen as sterling tested bids around the ¥160.00 figure while the Swiss franc moved lower vis-à-vis the yen and tested bids around the ¥88.95 level. In Chinese news, the U.S. dollar gained ground vis-à-vis the Chinese yuan as the greenback closed at CNY 6.8315 in the over-the-counter market, up from CNY 6.8288.

Daily Market Commentary provided by GCI Financial Ltd.

GCI Financial Ltd (”GCI”) is a regulated securities and commodities trading firm, specializing in online Foreign Exchange (”Forex”) brokerage. GCI executes billions of dollars per month in foreign exchange transactions alone. In addition to Forex, GCI is a primary market maker in Contracts for Difference (”CFDs”) on shares, indices and futures, and offers one of the fastest growing online CFD trading services. GCI has over 10,000 clients worldwide, including individual traders, institutions, and money managers. GCI provides an advanced, secure, and comprehensive online trading system. Client funds are insured and held in a separate customer account. In addition, GCI Financial Ltd maintains Net Capital in excess of minimum regulatory requirements.

DISCLAIMER: GCI’s Daily Market Commentary is provided for informational purposes only. The information contained in these reports is gathered from reputable news sources and is not intended to be U.S.ed as investment advice. GCI assumes no responsibility or liability from gains or losses incurred by the information herein contained.

Pending Homes Sales rise for fifth straight month. Dollar mixed in Forex Trading today.

By CountingPips.com

U.S. Pending Homes sales rose for the fifth straight month in June according to the monthly report produced by the National Association of Realtors. The NAR report showed that pending home sales contracts signed by buyers increased 3.6 percent in June following a revised 0.1 250150bluechartspercent increase in May. June marked the first time since July 2003 that pending home sales had increased for five consecutive months. On an annual basis, the pending home sales level is 6.7 percent above the June 2008 level.

Market forecastors had predicted the sales data would show an increase of approximately 0.7 percent for the month.

NAR chief economist Lawrence Yun commented in the report about the increased sales figures this month, “Historically low mortgage interest rates, affordable home prices and large selection are encouraging buyers who’ve been on the sidelines.  Activity has been consistently much stronger for lower priced homes.”

Contributing to the sales rise for June was a 7.1 percent monthly gain in the South while sales of new homes in the West advanced by 2.9 percent. Pending home sales edged up by 0.4 percent and by 0.8 percent in the Midwest.

US Dollar mixed in Forex Trading today.

The U.S. dollar has been mixed today in forex trading against the other major currencies since the start of the day at 00:00GMT. The American currency has been trading higher versus the British pound, Australian dollar, New Zealand dollar and Canadian dollar while the dollar is lower versus the Japanese yen and trading almost unchanged against the euro and Swiss franc.

The euro is trading virtually unchanged versus the dollar so far today as the EUR/USD has  from its 1.4390 opening at 00:00 GMT to trading at 1.4391 in the U.S. trading session at 3:12pm EST according to currency data from Oanda.

The British pound has declined slightly against the USD as the GBP/USD has gone from its 1.6951 opening exchange rate to trading at 1.6924 usd per gbp. The dollar has edged down versus the Japanese yen and trades at 95.21 after opening at the day at the 95.35 exchange rate.

The dollar has gained versus the Canadian loonie as the USD/CAD trades at the exchange rate of 1.0732 after opening the day at 1.0670.

The dollar is trading almost unchanged against the Swiss franc as the USD/CHF trades at 1.0611 after opening at 1.0614 today while the dollar has been slightly stronger against the Australian dollar and versus the New Zealand dollar. The AUD/USD trades at 0.8428 after a 0.8446 opening while the NZD/USD trades at 0.6553 today after opening at the exchange rate of 0.6577.

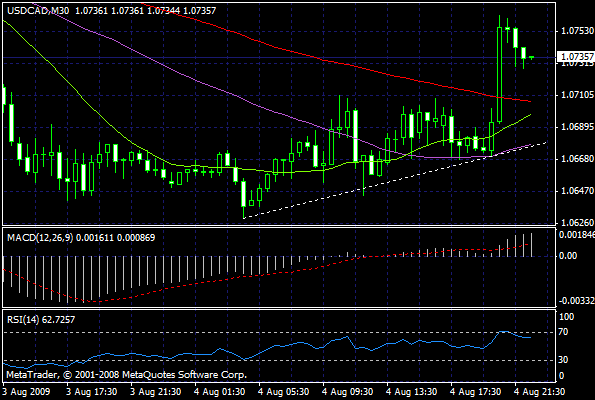
USD/CAD Chart
– The US Dollar advancing today versus the Canadian Dollar in forex trading as the USD/CAD reversed some of the gains it lost yesterday.

8-4usdcad

Fibonacci Analysis of Gold and Crude

By Adam Hewison – You may have heard about Fibonacci, the man who discovered a set of numbers which have been found to have a major affect on the market. So who is this Fibonacci fellow and why are his findings so important in the market place?

The mathematical findings by this thirteenth century Italian man has yielded a useful tool which is used in technical analysis and by scientists in a large array of fields.

In our new short video, I will look at gold and also the crude oil market using MarketClub’s Fibonacci tool. I think you will be surprised and shocked at just how accurate and up-to-date this dead mathematician’s work is in today’s markets.

This is such an important video that we only want to leave it online for a short time. We urge you to take 4 minutes and learn the Fibonacci secret to the markets.

There is no need to register for this video and of course you can watch it with our compliments, but you must act today otherwise you risk missing out on this key element to the market.

See the New Video Here….

Enjoy the video and please give us your feedback on this blog.

All the best,
Adam Hewison
President, INO.com
Co-creator, MarketClub

Greenback Touches 2009 Low vs. Currency Basket

Source: ForexYard

The Dollar fell to its lowest levels this year on Monday after the Institute for Supply Management’s index on U.S. manufacturing improved more than expected in July. Along with some better earnings reports from foreign banks, the data supported equity markets and spelled trouble for the U.S. currency because investors no longer desire its safe-haven status.

Economic News

USD – Dollar Tumbles on Optimistic Manufacturing Data

The U.S. Dollar tumbled on Monday after the publication of far better than forecast ISM Manufacturing PMI from the U.S. economy. The reading rose to an 11 month high of 48.9, notably higher than the forecasted figure of 46.4. Construction data in the U.S. also showed some big improvements. This led to a drop in the demand of the USD, as risk appetite grew throughout the day. The greenback tumbled against virtually all of its major currency pairs, as traders feel that the recession is nearly over, and economic growth will soon return to the U.S. economy. As a result, the USD fell to its lowest level in 7 months.

The EUR/USD rose to as high as 1.4444, before closing at 1.4421. This was the USD’s weakest rate against the European currency since the middle of December last year. The Dollar fell by about 250 pips vs. the British Pound to 1.6980. This was the Dollar’s lowest level vs. the GBP since about the middle of October last year. One of the only currencies that the Dollar gained ground against yesterday was the Yen. The USD/JPY cross increased by about 70 pips to the 95.43 level, as demand for higher yielding assets increased throughout much of Monday’s trading.

Looking ahead to today, forex traders can expect much of the same volatility in the market. The Dollar is set to move a lot against its major pairs, such as the GBP, EUR, JPY, and CAD. This is likely to occur, as investors continue to trade on much of yesterday’s data. Additionally, the U.S. market is set to be the main market mover again with the with the release of Personal Spending and Personal Income data at 12:30 GMT, and the publication of U.S. Pending Home Sales at 14:00 GMT. In order to take advantage of the very volatile forex market, it’s advisable that you open your USD positions now.

EUR – EUR Soars to 7 Month High versus the USD

The European currency soared to a 7 month high versus the USD yesterday, as optimistic global manufacturing data from the Euro-Zone, U.S., Britain and China led to a decline in demand for the safe-haven USD. In addition, the British Pound jumped against the Dollar, as the British economy showed really clear signs that it may rise out of recession by the end of the 3rd quarter. This was following the publication of very positive British manufacturing data, and the much better than expected pre-tax profits of HSBC and Barclays Bank.

The GBP/USD pair rose by over 250 pips in Monday’s trading to the 1.6980 level. This may also have been helped as the USD may have come under increasing pressure from the rise in Oil and other commodity prices. The EUR/USD cross climbed by 190 pips to 1.4421, the highest level since December 2008, just weeks after the collapse of Lehman Brothers. Both the EUR and GBP rose against a string of other currencies, such as the JPY, as demand for higher yielding assets rose, along with risk appetite, as yesterday’s trading dragged on.

Tuesday’s trading is set for another action packed day. The 2 most important releases from Britain will be the Construction PMI at 08:30 GMT and Nationwide Consumer Confidence figures at 23:01 GMT. From the Euro-Zone, we can expect the PPI figures at 09:00 GMT. These releases are expected to help drive market volatility for the EUR and GBP throughout the trading day. Furthermore, it is advisable to follow economic events coming out of other leading economies, such as the U.S. as they are likely to also impact these 2 currencies.

JPY – JPY Falls against All the Major Currencies

The Japanese Yen fell against all of its major currency pairs yesterday, following the release of optimistic manufacturing data from the world’s leading economies. This helped push-down demand for lower yielding assets such as the JPY and USD, and push-up demand for high yielding assets such as the GBP and EUR. Also, as the day dragged on, so did risk appetite. This led to the sell-off of the JPY and the buy-up of foreign assets. Analysts said this is trend is likely to continue as the global economy continues to recover.

The JPY fell by 70 pips against the USD to the 95.43 mark. The Japanese currency plummeted to 137.38 from 134.84 on Monday vs. the EUR. Against the British Pound, the Yen dropped nearly 360 pips to the 161.91 level. As a whole, the Yen it still a strong currency. However, if economies such as the U.S., China and Britain start showing growth in the coming months, then we may see the JPY lose lot of the strength that it gained since the start of the current economic crisis.

OIL – Crude Oil Climbs to Over $72 a Barrel

The price of Crude Oil climbed to over $72 a barrel yesterday, before closing at around $71.25. Monday’s trading saw Oil at the highest level since July 1st. Yesterday’s bullish behavior in Crude can is largely owed to the optimistic manufacturing data that was published by the leading economies, led by the U.S., Britain and China. This is important, as the U.S. and China are 2 of the biggest consumers of Oil, which also played into higher Crude prices yesterday.

The high expectations surrounding the improved global economic sentiment, increased risk appetite, which also led to a fall in demand of the USD. In turn, this helped push-up the price of Crude Oil. The price of Crude was unable to hold above the $72 mark due to a lack of demand. However, if the global economy continues to recover, and positive economic results continue to be published, we may see stronger Oil prices for the foreseeable future.

Technical News

EUR/USD

The pair has been showing a strong and consistent uptrend since the beginning of this week, and the momentum appears that it will continue uninterrupted. The small local correction is slowly losing its energy, and the daily chart is showing that the renewal of the bullish trend is quite imminent. Buying on lows might be a good strategy today.

GBP/USD

On a daily chart the pair is showing consistent bullish momentum for a while now and today is no difference. Although the signal is not strong the pair might have a local target at 1.6990, which might make it feasible for forex traders to go long with tight stops.

USD/JPY

Since the last bearish move, the pair has been consolidating around the 95.10 level for quite a while now. The hourlies provide bearish signals, suggesting that the restoration of the bearish momentum is due. Going short appears to be preferable today.

USD/CHF

The bullish move the pair is going through appears to have diminishing momentum, and lacks the ability to make a significant breach above the 1.0660 level. The hourly studies show mixed signals, and the daily chart’s Stochastic Slow is indicating a mild bearish direction. Waiting for a clearer signal on that pair appears to be a good decision today.

The Wild Card – AUD/USD

On the daily chart the moderate bullish price movement continues within the upwards channel which still has yet to be breached. The 4-hour chart is also joining that notion with the Slow Stochastic pointing to the continuation of upwards momentum. Next testing point should be around 0.8510 Forex traders have a good opportunity to enter what appears to be the beginning of a steady rising trend.

Forex Market Analysis provided by Forex Yard.

© 2006 by FxYard Ltd

Disclaimer: Trading Foreign Exchange carries a high level of risk and may not be suitable for all investors. There is a possibility that you could sustain a loss of all of your investment and therefore you should not invest money that you cannot afford to lose. You should be aware of all the risks associated with Foreign Exchange trading.

Gold Leaves $950/oz behind with Broad Depreciation of the Dollar

By Fast Brokers – Gold has climbed above our 2nd tier downtrend line and previous July highs as the GBP/USD and EUR/USD burst higher.  Both currency pairs are setting fresh 2009 highs, a bullish confirmation on their part.  Gold is enjoying its positive correlation, heading towards our 3rd tier downtrend line in a hurry.  However, June 10 highs and the 3rd tier downtrend line could prove to be worthy immediate-term obstacles with the S&P futures dangling just beneath their highly psychological 1000 level.  Even though the EUR/USD, GBP/USD, and crude futures have done their parts, 1000 should be a challenge for the S&P if psychological precedence holds true.  Therefore, even if the S&P futures should poke above 1000, we expect a retracement and ensuing near-term battle.  As a result, gold could enter a similar conflict with its aforementioned barriers.  On the other hand, most of the S&P’s correlations are confirming the uptrend, meaning that a 1000+ S&P may be in the cards.  Hence, the near-term future for gold is bright even if the immediate-term has its obstacles.

Present Price: $961.65/oz

Resistances: $962.24/oz, $963.81/oz, $965.26/oz, $966.91/oz, $968.60/oz

Supports: $961.00/oz, $959.34/oz, $958.12/oz, $956.32/oz, $954.39/oz

Psychological: $950/oz

Market Commentary provided by Fast Brokers.

Disclaimer: FastBrokers’ market commentary is provided for information purposes only and under no circumstances should be regardedneither as an investment advice nor as a solicitation or an offer to sell/buy any financial product. FastBrokers assumes no responsibility or liability from gains or losses incurred by the information herein contained.

Risk Disclosure: There is a substantial risk of loss in trading futures and foreign exchange. Please carefully review all risk disclosure documents before opening an account as these financial instruments are not appropriate for all investors.

EUR/USD Continues its Surge After Positive Global Data

By Fast Brokers – The EUR/USD has rocketed past all of our previous downtrend lines, bursting out of the gates sooner than we had anticipated.  Investors are shrugging off the much weaker than expected retail sales data out of Germany, choosing to focus on the U.S., China, and Britain instead.  All countries released stronger than expected manufacturing PMI data points, with Britain’s registering growth (50.8) for the first time since May 2008.  The higher than expected PMIs bode well for the EU’s large manufacturing sector.  The EU should benefit as the global economy pieces together consumption, so the EUR/USD is benefitting from today’s wave of positive news.

Investors are continuing their return to risk, resulting in a broad-based depreciation of the Dollar.  The EUR/USD is setting new 2009 highs, locking its sights on the psychological 1.45 mark, the next psychological barrier.  The EUR/USD appears to have some more near-term upward mobility since the currency pair has leapt past our downtrend line forming through September 22nd and December 18th highs.  These highs are the next points of heavy resistance, yet they reside around the 1.47 zone.  Hence, it’s clear this rally has legs.  Speaking of which, the EUR/USD is registering large volume on the buy-side, indicating bulls are putting their money where their mouth is.

Despite the rampant optimism, the S&P futures are trading at 1000 mark right now.  While the flood of today’s positive news could send the futures past 1000, it’s difficult to believe this highly psychological level won’t put up a good fight once it’s breached.  Therefore, the EUR/USD could hit a wall soon and consolidate should the S&P futures behave as we suspect.  There is a ton of important U.S. data left to be seen over the next two days, and investors may want to wait and see how the other indicators fare.  Data will be relatively quiet on the EU front until Thursday’s ECB monetary policy decision.  However, should U.S. and British economic data outperform leading up to the meeting, the EUR/USD may already price in a neutral/positive result from the ECB.  Regardless, the EUR/USD is making a clear case for its uptrend, giving a green light.  It would take a very large, negative shock to derail the recovery in the EUR/USD.

Present Price: 1.4413

Resistances: 1.4441, 1.4476, 1.4506, 1.4546

Supports: 1.4391, 1.4348, 1.4305, 1.4266, 1.4242

Psychological: 1.45

Market Commentary provided by Fast Brokers.

Disclaimer: FastBrokers’ market commentary is provided for information purposes only and under no circumstances should be regardedneither as an investment advice nor as a solicitation or an offer to sell/buy any financial product. FastBrokers assumes no responsibility or liability from gains or losses incurred by the information herein contained.

Risk Disclosure: There is a substantial risk of loss in trading futures and foreign exchange. Please carefully review all risk disclosure documents before opening an account as these financial instruments are not appropriate for all investors.

GBP/USD Runs Wild after Global PMI Numbers

By Fast Brokers – The Cable is continuing its remarkable run, jetting towards 1.70 in a hurry as we anticipated.  The Cable has busted through all of our trend lines, setting fresh 2009 highs in the process and making its case for a climb back to pre-crisis levels.  The EUR/USD is setting new 2009 highs today as well, indicating the significance of today’s movement.  However, 1.70 should play a psychological role for the near-term with the S&P dangling just below 1000.  While all correlations are confirming the uptrend in the GBP/USD, 1000 should prove to be a tough battle for the S&P even if the level is breached temporarily.  The Cable has been on such a run as of late, we would not be surprised to see the currency pair cool soon as investors anticipate the wave of data and central bank meetings over the next few days.

The Cable is getting its positive boost from better than expected manufacturing PMI data at home and abroad.  Britain’s manufacturing PMI ended its contraction, registering growth (50.8) for the first time since May 2008.  America’s manufacturing PMI data also headed towards growth, falling just short of the neutral 50 mark.  Additionally, the markets are reacting to positive manufacturing and export data flows from China.  The signs of a global recovery in manufacturing coupled with a better than expected Q2 earnings season are driving the Cable to confirm its uptrend.

The wave of economic data will only grow in size tomorrow, with Britain releasing its Halifax HPI and construction PMI data points while the U.S. announcing housing and pricing data of its own.  Better than expected economic data points would likely fuel the Cable’s rally since investors would price in the BOE confirming its decision to cap QE funding at its meeting on Thursday.  If the BOE and ECB both keep their alternative liquidity plans in check, investors would take this as a sign that the central bank governors are comfortable with the recovery taking root.

Meanwhile, investors should keep an eye on the S&P’s interaction with 1000.  If 1000 turns into a dense area of resistance the GBP/USD may opt to consolidate around 1.70.  However, if the S&P futures leave 1000, the GBP/USD could have added upward mobility due to its positive momentum.

Present Price: 1.6923

Resistances: 1.6939, 1.6969, 1.7025, 1.7064, 1.7104

Supports: 1.6864, 1.6832, 1.6815, 1.6768, 1.6731

Psychological: 1.70

Market Commentary provided by Fast Brokers.

Disclaimer: FastBrokers’ market commentary is provided for information purposes only and under no circumstances should be regardedneither as an investment advice nor as a solicitation or an offer to sell/buy any financial product. FastBrokers assumes no responsibility or liability from gains or losses incurred by the information herein contained.

Risk Disclosure: There is a substantial risk of loss in trading futures and foreign exchange. Please carefully review all risk disclosure documents before opening an account as these financial instruments are not appropriate for all investors.

USD/JPY Balances at 95 after Huge Gains in the GBP/USD, EUR/USD, Gold

By Fast Brokers – The USD/JPY has waded back above the psychological 95 level, looking to react positively to the inflection point of our 1st tier uptrend and 2nd tier downtrend lines.  The EUR/USD, GBP/USD, and gold are registering huge technical gains today after better than expected manufacturing data.  The USD/JPY is unwillingly participating to the upside since the currency pair is ultimately positively correlated to a global economic recovery.  While the USD/JPY hasn’t registered nearly as significant of a movement as its correlations, the USD/JPY could show a delayed reaction should the markets continue to qualify a legitimate recovery.  Therefore, the USD/JPY will likely sit tight until we see how the S&P futures handle their highly psychological 1000 level.  Should the S&P confirm a 1000+ future, the USD/JPY would likely join the party to the upside at this point.

Meanwhile, the USD/JPY will likely remain tethered to its highly psychological 95 level for the immediate-term.  The USD/JPY’s near-term resistances are 95, July 31 highs, and our 3rd tier downtrend line.  The currency pair will fight to stay above our 1st tier trend line in the meantime and solidify a solid base it can build from.  Investors will be digesting a large amount of data and central bank meetings over the next few sessions, meaning we don’t expect FX volatility to abate anytime soon.

Present Price: 95.27

Resistances: 95.41, 95.73, 96.33, 96.77, 96.96

Supports:  94.99, 94.49, 93.82, 93.28, 92.90

Psychological: 95

Market Commentary provided by Fast Brokers.

Disclaimer: FastBrokers’ market commentary is provided for information purposes only and under no circumstances should be regardedneither as an investment advice nor as a solicitation or an offer to sell/buy any financial product. FastBrokers assumes no responsibility or liability from gains or losses incurred by the information herein contained.

Risk Disclosure: There is a substantial risk of loss in trading futures and foreign exchange. Please carefully review all risk disclosure documents before opening an account as these financial instruments are not appropriate for all investors.

ISM Manufacturing data rises in July. USD declines in Forex Trading.

By CountingPips.com

U.S. Manufacturing data, released today by the Institute for Supply Management, showed that manufacturing activity contracted in July for the eightteenth straight month but did see better than expected improvement. July’s ISM Report On Business index readings for economic activity registered a 48.9 percent score following June’s 44.8 percent level and just slightly below a growing level. A score above 50 percent is considered to be economic growth and less than 50 percent is considered to be a contraction. The July score was better than economic forecasts which were expecting the ISM index reading to register 46.5 percent for the month.

Norbert J. Ore, chair of the ISM Business Survey Committee, commented on the report saying, “The decline in manufacturing was slower in July when compared to June, as the more leading components of the PMI — the New Orders and Production Indexes — rose significantly above 50 percent, thus setting an expectation for future growth in the sector. The Employment and Inventories Indexes are still contracting, but the rate is slowing and they are moving in the right direction. It is also worth noting that the New Export Orders Index shows growth following nine consecutive months of decline, suggesting that the global economy is recovering. Overall, it would be difficult to convince many manufacturers that we are on the brink of recovery, but the data suggests that we will see growth in the third quarter if the trends continue.”

Almost all of the manufacturing sectors tracked for July showed improvement over the June report with customer inventories being the exception. Customer inventories decreased by 1.0 percent in July.

New orders, production, employment, supplier deliveries, inventories, prices, exports, imports and the backlog of orders all showed increased readings for July. The exports index registered a 1.0 percent increase for July while imports  increased by 4.0 percent.

US Dollar falls lower in forex trading.

The U.S. dollar has been under pressure in forex trading against the major currencies so far in Monday trading. The dollar has fallen against the euro, Australian dollar, British pound, Swiss franc, New Zealand dollar and Canadian dollar while trading higher against the Japanese yen.

The euro has advanced versus the dollar as the EUR/USD has gone from today’s 1.4234 opening exchange rate at 00:00 GMT to trading at approximately 1.4418 in the afternoon of the US trading session at 12:22pm EST according to currency data by Oanda.

The British pound has increased today versus the American currency from 1.6723 to trading at 1.6957 dollars per pound. The dollar has decreased against the Canadian dollar after the USD/CAD’s opening at 1.0781 earlier today to trading at 1.0664 later.

The Australian dollar has also traded higher versus the USD as the AUD/USD trades at 0.8416 after opening today at 0.8372 while the New Zealand dollar has gained versus the USD and the NZD/USD trades at 0.6676 after opening at 0.6624.

The dollar has gained against the Japanese yen today as the USD/JPY has advanced from its 94.75 opening to trading at 95.26.

Meanwhile, the USD has fallen against the Swiss franc today as the USD/CHF has declined from the 1.0719 opening to trading at 1.0587.

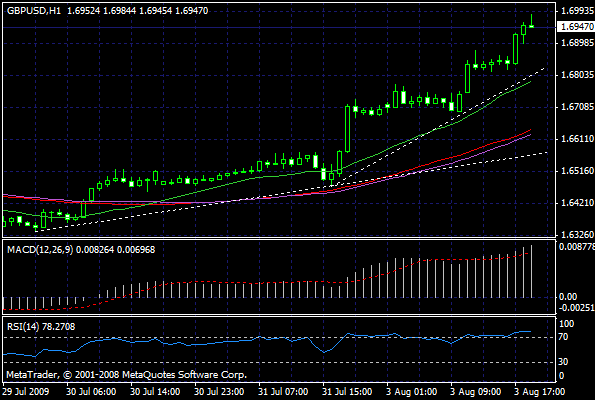
GBP/USD Chart – The British Pound Sterling advancing today against the US Dollar in Forex Trading and trading at its highest exchange rate since October 2008.

GBP/USD Forex Chart
GBP/USD Forex Chart

EUR/GBP – Short Term and Long Term Views

EUR/GBP has turned from a investment pair into a trading pair. Ever since the financial world became unglued (late 2007? Summer 2008?) the pair has been much more volatile. There are many more short term opportunities to trade the pair on an intraday basis. Additionally, on a long-term view, we are at a level of significance from many months ago.

On an intraday basis, EUR/GBP has set up for our favorite “false breakout” pattern. In the below 2 hour candlestick chart, the pair closed one timeframe outside the lower Bollinger Band, and then returned to close inside the Bollinger Bands in the next candlestick. We are confident in a move higher through out the day and into tomorrow.

For a short term trade, we buy at market (currently bid at .8507) with a Target level of .8563 (top of the Bollinger Bands) and a Stop Loss order at .8475 (right at today’s earlier lows).

For the longer timeframe, the .8420 – .8520 level attracted a lot of interest back in November of 2008. The chart of daily price actions showed the entire month of November to be a battle of bulls and bears. The move from those levels took us up to the .9800 levels; a move of approx 14 big figures. So we expect that there will be a lot of buying and selling interest at these levels again and we will wait to see the outcome. As we expect a 10 plus big figure move once the direction is settled, we are in no rush to jump in early; there will be plenty of room to position oneself.

UPDATE – Our July 27 Short EUR/CHF position finally hit our Target Profit level (anything in the 1.51xx range) on Thursday July 30th.

Update – We remain long EUR/USD from our blog post at the end of last week. We continue to target the 1.4700 area

Stay Nimble!

Stephen Leahy
Back Bay FX Services, LLC
www.backbayfx.com

Thanks to FX Solutions for the below image.