US 10-Year Treasury Note Speculators increased bearish positions to 2014 high

By CountingPips.com

Weekly CFTC Net Speculator Report


10-Yr

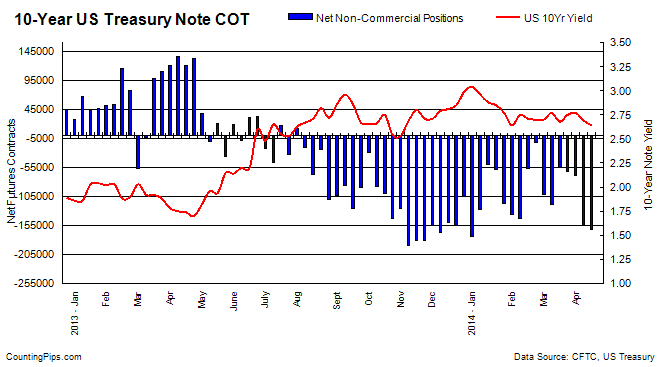
Large Speculators bearish positions increase to a total of -162,278 contracts

10 Year Treasuries: Large futures market traders added to their overall bearish bets in the 10-year treasury note futures last week for a 4th week and to the highest bearish level of 2014, according to the latest Commitment of Traders (COT) data released by the Commodity Futures Trading Commission (CFTC) on Friday.

The non-commercial futures contracts of the 10-year treasury notes, primarily traded by large speculators and hedge funds, totaled a net position of -162,278 contracts in the data reported for April 15th. This was a change of -7,104 contracts from the previous week’s total of -155,174 net contracts that was recorded on April 8th.

The current level in the 10-year note futures contracts marks the highest bearish level since December 31st when net bearish positions totaled -173,674 contracts.

Over the weekly reporting time-frame, from Tuesday April 8th to Tuesday April 15th, the yield on the 10-Year treasury note declined from 2.69 to a yield of 2.64, according to data from the United States Treasury Department.


Last 6 Weeks of Large Trader Non-Commercial Positions

DateOpen InterestLong SpecsShort SpecsNet Large SpecsWeekly Change10 Year Yield
03/11/20142412737301102419312-118210-168402.77
03/18/20142441194360226415240-55014631962.68
03/25/20142490662333722395487-61765-67512.75
04/01/20142503964346901415677-68776-70112.77
04/08/20142572114327159482333-155174-863982.69
04/15/20142497347344056506334-162278-71042.64


*COT Report: The weekly commitment of traders report summarizes the total trader positions for open contracts in the futures trading markets. The CFTC categorizes trader positions according to commercial hedgers (traders who use futures contracts for hedging as part of the business), non-commercials (large traders who speculate to realize trading profits) and nonreportable traders (usually small traders/speculators). Find CFTC criteria here: (http://www.cftc.gov/MarketReports/CommitmentsofTraders/ExplanatoryNotes/index.htm).


Article by CountingPips.comForex Trading Apps


VIX Futures Market Speculators raised bearish positions for 4th week

By CountingPips.com

Weekly CFTC Net Speculator Report


vix


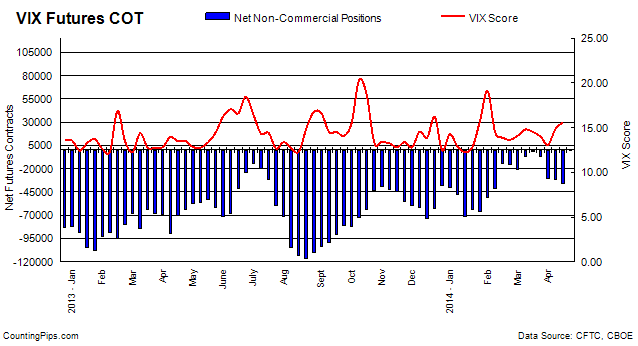
VIX Futures Contracts: Large traders and speculators continued to raise overall bearish bets in the VIX futures market last week for a fourth consecutive week, according to the latest data from the Commodity Futures Trading Commission (CFTC) released on Friday.

The VIX non-commercial futures contracts, comprising of large speculator and hedge fund positions, totaled a net bearish position of -35,946 contracts in the data reported for April 15th. This was a change of -4,200 contracts from the previous week’s total of -31,746 net contracts that was registered on April 8th.

Large speculators bearish positions are currently at a new highest level since February 11th when overall positions stood at a level of -41,108 contracts.

The VIX index, meanwhile, rose last week for a second straight week from a 14.89 reading on Tuesday April 8th to a 15.61 reading on Tuesday April 15th, according to the Chicago Board Options Exchange (CBOE) Volatility Index.


Last 6 Weeks of Large Trader Positions

DateOpen InterestLong SpecsShort SpecsNet Non-CommercialsWeekly ChangeVIX Score
03/11/2014355040114455121309-68541359214.80
03/18/2014336625107861108924-1063579114.52
03/25/2014335826109110116314-7204-614114.02
04/01/2014357046114839145412-30573-2336913.10
04/08/2014359952105096136842-31746-117314.89
04/15/201436888796296132242-35946-420015.61

*COT Report: The weekly commitment of traders report summarizes the total trader positions for open contracts in the futures trading markets. The CFTC categorizes trader positions according to commercial hedgers (traders who use futures contracts for hedging as part of the business), non-commercials (large traders who speculate to realize trading profits) and nonreportable traders (usually small traders/speculators). Find CFTC criteria here: (http://www.cftc.gov/MarketReports/CommitmentsofTraders/ExplanatoryNotes/index.htm).


Article by CountingPips.comForex Apps & Analysis


Gold Speculators decreased bullish positions for 4th consecutive week in latest COT data

By CountingPips.com

Weekly CFTC Net Speculator Report

GOLD: Large futures market traders and speculators decreased their overall bullish bets in gold futures last week for the fourth straight week last week and to the lowest level since February, according to the latest Commitment of Traders (COT) data released by the Commodity Futures Trading Commission (CFTC) on Friday.

The non-commercial futures contracts of Comex gold futures, traded by large speculators and hedge funds, totaled a net position of +79,292 contracts in the data reported through April 15th. This was a change of -9,307 contracts from the previous week’s total of +88,599 net contracts on April 8th.

Gold large speculator net positions have now declined for four consecutive weeks after reaching a 13-month high level on March 18th. The total gold net bullish position is currently at its lowest level since February 11th when net positions equaled +71,201 contracts.

Over the weekly reporting time-frame, from Tuesday April 8th to Tuesday April 15th, the gold price fell from approximately $1,310.10 to $1,302.90 per ounce, according to gold futures price data from investing.com.

Last 6 Weeks of Large Trader Non-Commercial Positions

DateOpen InterestLong SpecsShort SpecsNet Non-CommercialsWeekly ChangeGold Price
03/11/20144153401704825159211889037241346.70
03/18/201442062618332446510136814179241359.00
03/25/201439826416908351766117317-194971311.00
04/01/201436345115815258007100145-171721279.60
04/08/20143654001496936109488599-115461310.10
04/15/20143695771474326814079292-93071302.90

*COT Report: The weekly commitment of traders report summarizes the total trader positions for open contracts in the futures trading markets. The CFTC categorizes trader positions according to commercial hedgers (traders who use futures contracts for hedging as part of the business), non-commercials (large traders who speculate to realize trading profits) and nonreportable traders (usually small traders/speculators). Find CFTC criteria here: (http://www.cftc.gov/MarketReports/CommitmentsofTraders/ExplanatoryNotes/index.htm).

Article by CountingPips.comForex Trading Apps


Crude Oil Speculators raised bullish positions for 4th week in COT data

By CountingPips.com

Weekly CFTC Net Speculator Report

CRUDE OIL: Large futures market traders and speculators raised their overall bullish bets in crude oil futures for a fourth straight week and to a new highest level since March 11th last week, according to the latest Commitment of Traders (COT) data released by the Commodity Futures Trading Commission (CFTC) on Friday.

The non-commercial contracts of crude oil futures, primarily traded by large speculators and hedge funds, totaled a net position of +409,551 contracts in the data reported for April 15th. This was a change of +9,764 contracts for the week. The previous week had registered a total of +399,787 net contracts in the data through April 8th.

The total of +409,551 bullish positions pushes crude oil positions to the highest level since March 11th when total net positions reached +406,832 contracts.

Over the weekly reporting time-frame, from Tuesday April 8th to Tuesday April 15th, the crude oil price modestly rose from $102.33 to $103.78 per barrel, according to Nymex futures price data from investing.com. Brent crude prices rose from $107.56 to $109.20 per barrel from Tuesday April 8th to Tuesday April 15th, also according to prices from investing.com.

Last 6 Weeks of Large Trader Non-Commercial Positions

DateOpen InterestLong SpecsShort SpecsNet Non-CommercialsWeekly ChangeOil Price
03/11/20141697240511076104244406832-18986100.03
03/18/20141623266492620108335384285-2254798.88
03/25/20141604566498080106906391174688999.19
04/01/2014164450750238911060639178360999.61
04/08/201416554725120351122483997878004102.33
04/15/201416742765234901139394095519764103.78


*COT Report: The weekly commitment of traders report summarizes the total trader positions for open contracts in the futures trading markets. The CFTC categorizes trader positions according to commercial hedgers (traders who use futures contracts for hedging as part of the business), non-commercials (large traders who speculate to realize trading profits) and nonreportable traders (usually small traders/speculators). Find CFTC criteria here: (http://www.cftc.gov/MarketReports/CommitmentsofTraders/ExplanatoryNotes/index.htm).

Article by CountingPips.comForex Trading News


GBPUSD Forex Trading Pivot Point Levels for 2014.04.18

2014.04.18 12:30 6:30AM ET | GBPUSD Currency Pair

SC GBPUSD 2014.04.18

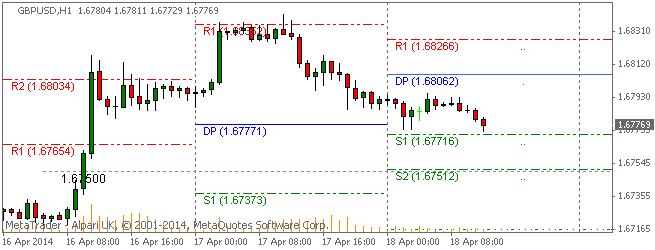
Here are the Pivot Points Levels with Support (S) and Resistance (R) for the GBPUSD currency pair today. Price action is currently trading at the 1.67769 price level and under the daily pivot point, according to data at 6:30 AM ET. The GBPUSD high for the day has been 1.67954 while the low of day has reached to 1.67729. The pair earlier today opened the Asian trading session below the daily pivot and has trended slightly lower so far today.

Daily Pivot Point: 1.68062
— S1 – 1.67716
— S2 – 1.67512
— S3 – 1.67166
— R1 – 1.68266
— R2 – 1.68612
— R3 – 1.68816


Weekly Pivot Points: GBPUSD

SC GBPUSD 2014.04.18

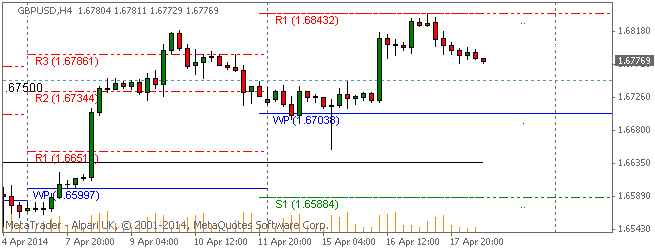
Prices are currently trading over the weekly pivot point at time of writing after finding resistance at the R1 resistance level. The GBPUSD has been on an overall bullish trend this week after opening the trading week modestly above the weekly pivot.

Weekly Pivot Point: 1.67038
— S1 – 1.65885
— S2 – 1.64490
— S3 – 1.63337
— R1 – 1.68433
— R2 – 1.69586
— R3 – 1.70981


By CountingPips.com – Forex Trading Apps & Currency Trade Tools
Disclaimer: Foreign Currency trading and trading on margin carries a high level of risk and volatility and can result in loss of part or all of your investment. All information and opinions contained do not constitute investment advice and accuracy of prices, charts, calculations cannot be guaranteed.


EURUSD Forex Trading Pivot Point Levels for 2014.04.18

2014.04.18 12:30 6:30AM ET | EURUSD Currency Pair

SC EURUSD 2014.04.18

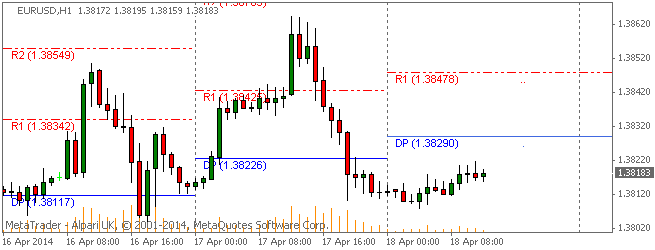
Here are the Pivot Points Levels with Support (S) and Resistance (R) for the EURUSD currency pair today. Price action is currently trading at the 1.38183 price level and under the daily pivot point, according to data at 6:30 AM ET. The EURUSD high for the day has been 1.38218 while the low of day has fallen to 1.38079. The pair earlier today opened the Asian trading session below the daily pivot and has trended slightly higher so far today.

Daily Pivot Point: 1.38290
— S1 – 1.37938
— S2 – 1.37750
— S3 – 1.37398
— R1 – 1.38478
— R2 – 1.38830
— R3 – 1.39018


Weekly Pivot Points: EURUSD

SC EURUSD 2014.04.18

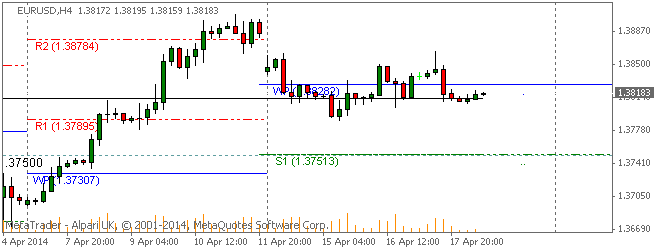
Prices are currently trading under the weekly pivot point at time of writing. The EURUSD has been on an overall bearish trend this week after opening the trading week below the weekly pivot.

Weekly Pivot Point: 1.38282
— S1 – 1.37514
— S2 – 1.36187
— S3 – 1.35419
— R1 – 1.39609
— R2 – 1.40377
— R3 – 1.41704


By CountingPips.com – Forex Trading Apps & Currency Trade Tools
Disclaimer: Foreign Currency trading and trading on margin carries a high level of risk and volatility and can result in loss of part or all of your investment. All information and opinions contained do not constitute investment advice and accuracy of prices, charts, calculations cannot be guaranteed.


USDCHF Forex Trading Pivot Point Levels for 2014.04.18

2014.04.18 12:31 6:30AM ET | USDCHF Currency Pair

SC USDCHF 2014.04.18

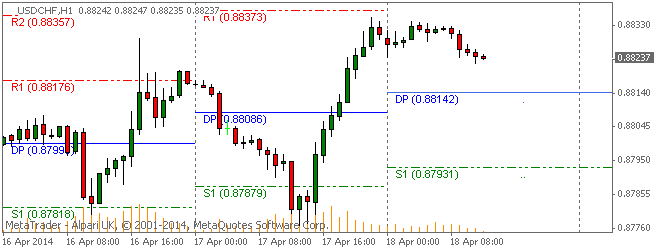
Here are the Pivot Points Levels with Support (S) and Resistance (R) for the USDCHF currency pair today. Price action is currently trading at the 0.88237 price level and over the daily pivot point, according to data at 6:30 AM ET. The USDCHF high for the day has been 0.88341 while the low of day has fallen to 0.88224. The pair earlier today opened the Asian trading session above the daily pivot and has trended slightly lower into the morning of the US session.

Daily Pivot Point: 0.88142
— S1 – 0.87930
— S2 – 0.87556
— S3 – 0.87344
— R1 – 0.88516
— R2 – 0.88728
— R3 – 0.89102


Weekly Pivot Points: USDCHF

SC USDCHF 2014.04.18

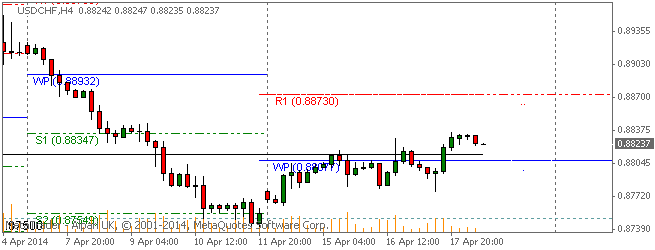
Prices are currently trading over the weekly pivot point at time of writing. The USDCHF has been on an overall bullish trend this week after opening the trading week below the weekly pivot.

Weekly Pivot Point: 0.88077
— S1 – 0.86905
— S2 – 0.86253
— S3 – 0.85081
— R1 – 0.88729
— R2 – 0.89901
— R3 – 0.90553


By CountingPips.comForex Trading Apps & Currency Trade Tools

Disclaimer: Foreign Currency trading and trading on margin carries a high level of risk and volatility and can result in loss of part or all of your investment. All information and opinions contained do not constitute investment advice and accuracy of prices, charts, calculations cannot be guaranteed.


USDJPY Forex Trading Pivot Point Levels for 2014.04.16

2014.04.16 12:30 6:30AM ET | USDJPY Currency Pair

SC USDJPY 2014.04.16

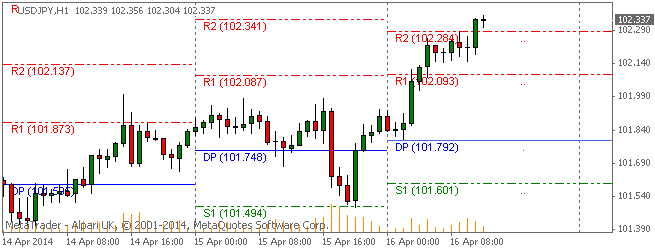
Here are the Pivot Points Levels with Support (S) and Resistance (R) for the USDJPY currency pair today. Price action is currently trading well over the daily pivot point at the 102.337 price level, according to data at 6:30 AM ET. The USDJPY high for the day has been 102.356 while the low of day has reached to 101.798. The pair earlier today opened the Asian trading session just above the daily pivot and has trended higher to above the R2 resistance level today.

Daily Pivot Point: 101.792
— S1 – 101.600
— S2 – 101.300
— S3 – 101.108
— R1 – 102.092
— R2 – 102.284
— R3 – 102.584


Weekly Pivot Points: USDJPY

SC USDJPY 2014.04.16

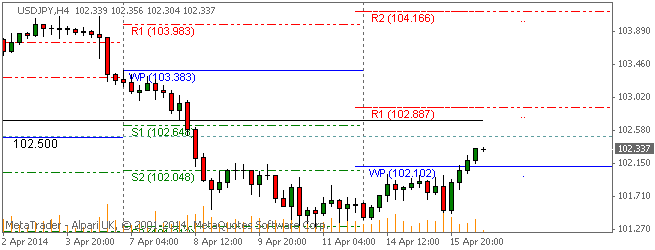
Prices have broken out over the weekly pivot point at time of writing. The USDJPY is now on an overall bullish trend this week after opening the trading week below the weekly pivot.

Weekly Pivot Point: 102.102
— S1 – 100.823
— S2 – 100.038
— S3 – 98.759
— R1 – 102.887
— R2 – 104.166
— R3 – 104.951


By CountingPips.com – Forex Trading Apps & Currency Trade Tools
Disclaimer: Foreign Currency trading and trading on margin carries a high level of risk and volatility and can result in loss of part or all of your investment. All information and opinions contained do not constitute investment advice and accuracy of prices, charts, calculations cannot be guaranteed.


EURUSD Forex Trading Pivot Point Levels for 2014.04.16

2014.04.16 12:30 6:30AM ET | EURUSD Currency Pair

SC EURUSD 2014.04.16

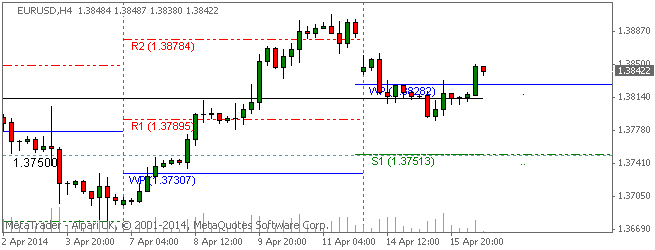
Here are the Pivot Points Levels with Support (S) and Resistance (R) for the EURUSD currency pair today. Price action is currently trading at the 1.38422 price level and over the daily pivot point, according to data at 6:30 AM ET. The EURUSD high for the day has been 1.38506 while the low of day has reached to 1.38059. The pair earlier today opened the Asian trading session just above the daily pivot and has trended higher to between the R1 and R2 resistance levels.

Daily Pivot Point: 1.38117
— S1 – 1.37910
— S2 – 1.37685
— S3 – 1.37478
— R1 – 1.38342
— R2 – 1.38549
— R3 – 1.38774


Weekly Pivot Points: EURUSD

SC EURUSD 2014.04.16

Prices are currently trading over the weekly pivot point at time of writing. The EURUSD has been on an overall sideways trend this week after opening the trading week gapping lower although still above the weekly pivot.

Weekly Pivot Point: 1.38282
— S1 – 1.37514
— S2 – 1.36187
— S3 – 1.35419
— R1 – 1.39609
— R2 – 1.40377
— R3 – 1.41704


Monthly Pivot Point: 1.38130
— S1 – 1.36599
— S2 – 1.35511
— S3 – 1.33980
— R1 – 1.39218
— R2 – 1.40749
— R3 – 1.41837


By CountingPips.com – Forex Trading Apps & Currency Trade Tools
Disclaimer: Foreign Currency trading and trading on margin carries a high level of risk and volatility and can result in loss of part or all of your investment. All information and opinions contained do not constitute investment advice and accuracy of prices, charts, calculations cannot be guaranteed.


GBPUSD Forex Trading Pivot Point Levels for 2014.04.16

2014.04.16 12:30 6:30AM ET | GBPUSD Currency Pair

SC GBPUSD 2014.04.16

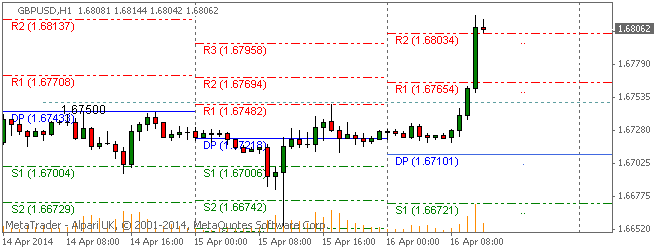
Here are the Pivot Points Levels with Support (S) and Resistance (R) for the GBPUSD currency pair today. Price action is currently trading at the 1.68062 price level and sharply over the daily pivot point, according to data at 6:30 AM ET. The GBPUSD high for the day has been 1.68169 while the low of day has reached to 1.67190. The pair earlier today opened the Asian trading session above the daily pivot and has trended sharply higher to above the R2 resistance level.

Daily Pivot Point: 1.67101
— S1 – 1.66721
— S2 – 1.66168
— S3 – 1.65788
— R1 – 1.67654
— R2 – 1.68034
— R3 – 1.68587


Weekly Pivot Points: GBPUSD

SC GBPUSD 2014.04.16

Prices are currently trading over the weekly pivot point at time of writing. The GBPUSD has been on an overall bullish trend this week after opening the trading week slightly above the weekly pivot.

Weekly Pivot Point: 1.67038
— S1 – 1.65885
— S2 – 1.64490
— S3 – 1.63337
— R1 – 1.68433
— R2 – 1.69586
— R3 – 1.70981


By CountingPips.comForex Trading Apps & Currency Trade Tools

Disclaimer: Foreign Currency trading and trading on margin carries a high level of risk and volatility and can result in loss of part or all of your investment. All information and opinions contained do not constitute investment advice and accuracy of prices, charts, calculations cannot be guaranteed.