Czech center-left Social Democrat leader Bohuslav Sobotka won a strong mandate from his party on Sunday to try to form a government with two centrist parties following an early election two weeks ago. He will also negotiate with the Christian Democrats, a smaller centrist formation that returned to parliament after dropping out in 2010. The three parties together won 111 out of the 200 seats in the lower house of parliament, as the previously ruling center-right parties suffered a crushing defeat. “Social democrats are ready now to negotiate responsibly to create the new government and we will strive to put as much as possible of our winning program into its agenda,” Sobotka, a former finance minister, said.
Large Speculators turn bullish on US Dollar bets in Forex Futures data
By CountingPips.com
The latest data for the weekly Commitments of Traders (COT) report was released on Friday by the Commodity Futures Trading Commission (CFTC) and showed that large futures speculators turned bullish on the US dollar last week after four straight weeks of bearish positions.
Non-commercial large futures traders, including hedge funds and large International Monetary Market speculators, had an overall US dollar long position totaling $7.02 billion as of Tuesday November 5th. This was a weekly change of $10.17 billion from the total position of $-3.146 billion that was registered on October 29th, according to data from Reuters that calculates this amount by the total of US dollar contracts against the combined contracts of the euro, British pound, Japanese yen, Australian dollar, Canadian dollar and the Swiss franc.
US dollar positions, on November 5th, were at their most bullish level since September 17th when US dollar bets were long at a total of $10.8 billion.
Individual Currencies Large Speculators Positions in Futures:
The large non-commercial net positions for each of the individual major currencies directly against the US dollar on November 5th showed weekly increases for just the Mexican peso while there were declines for the euro, British pound sterling, Japanese yen, Swiss franc, Canadian dollar, Australian dollar and the New Zealand dollar.
Individual Currency Charts:
EuroFX:
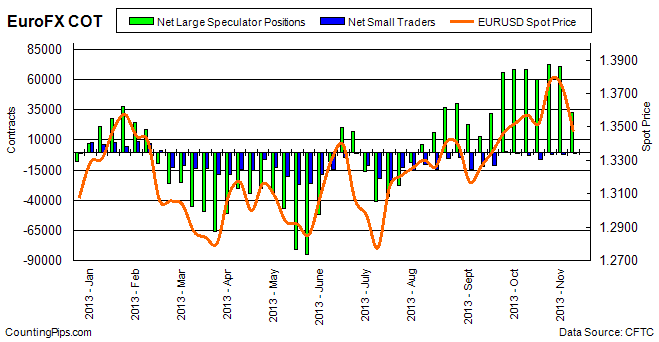
Last Six Weeks of Large Trader Positions: EuroFX
Date | Large Trader Net Positions | Weekly Change |
10/01/2013 | 68276 | 2432 |
10/08/2013 | 68683 | 407 |
10/15/2013 | 60374 | -8309 |
10/22/2013 | 72434 | 12060 |
10/29/2013 | 70617 | -1817 |
11/05/2013 | 33143 | -37474 |
British Pound Sterling:
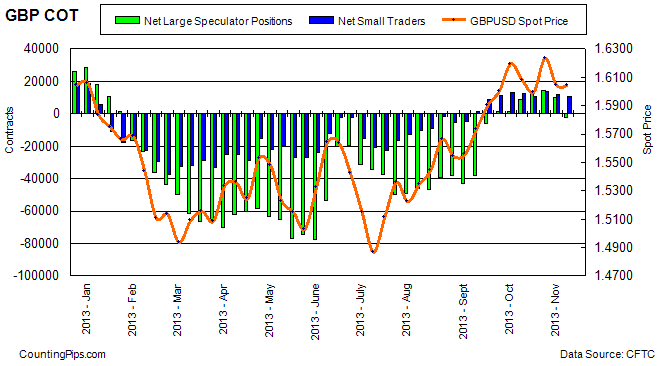
Last Six Weeks of Large Trader Positions: Pound Sterling
Date | Lg Trader Net | Weekly Change |
10/01/2013 | 1496 | 322 |
10/08/2013 | 8771 | 7275 |
10/15/2013 | 12231 | 3460 |
10/22/2013 | 14262 | 2031 |
10/29/2013 | 10162 | -4100 |
11/05/2013 | -2392 | -12554 |
Japanese Yen:
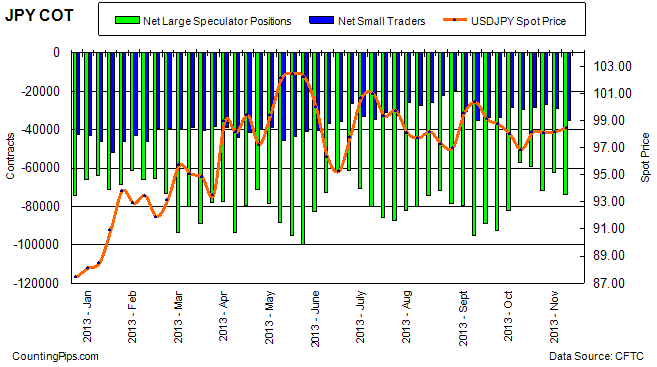
Last Six Weeks of Large Trader Positions: Yen
Date | Lg Trader Net | Weekly Change |
10/01/2013 | -82324 | 10494 |
10/08/2013 | -57097 | 25227 |
10/15/2013 | -59266 | -2169 |
10/22/2013 | -71802 | -12536 |
10/29/2013 | -62395 | 9407 |
11/05/2013 | -73792 | -11397 |
Swiss Franc:
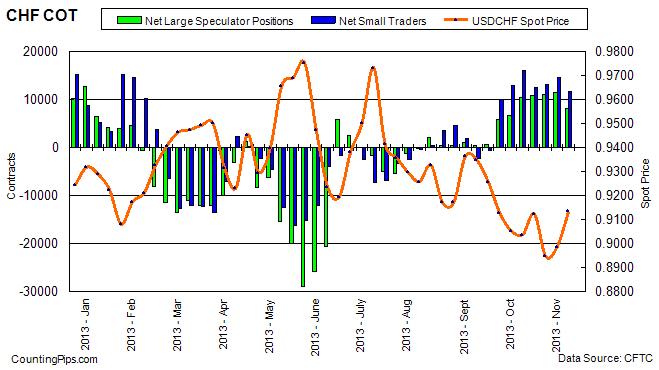
Last Six Weeks of Large Trader Positions: Franc
Date | Lg Trader Net | Weekly Change |
10/01/2013 | 6636 | 891 |
10/08/2013 | 10415 | 3779 |
10/15/2013 | 10767 | 352 |
10/22/2013 | 10931 | 164 |
10/29/2013 | 11451 | 520 |
11/05/2013 | 8095 | -3356 |
Canadian Dollar:
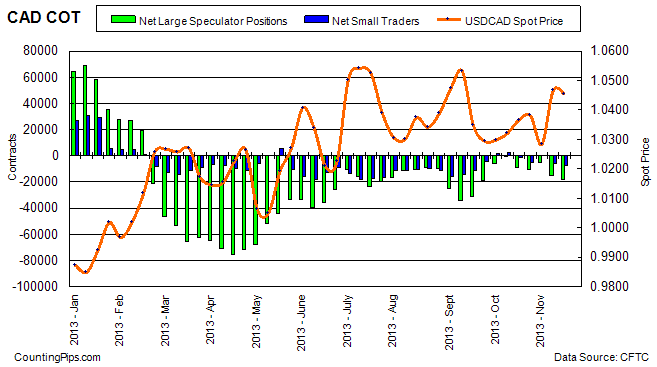
Last Six Weeks of Large Trader Positions: CAD
Date | Lg Trader Net | Weekly Change |
10/01/2013 | -955 | 4720 |
10/08/2013 | -8663 | -7708 |
10/15/2013 | -10814 | -2151 |
10/22/2013 | -5364 | 5450 |
10/29/2013 | -15237 | -9873 |
11/05/2013 | -18002 | -2765 |
Australian Dollar:
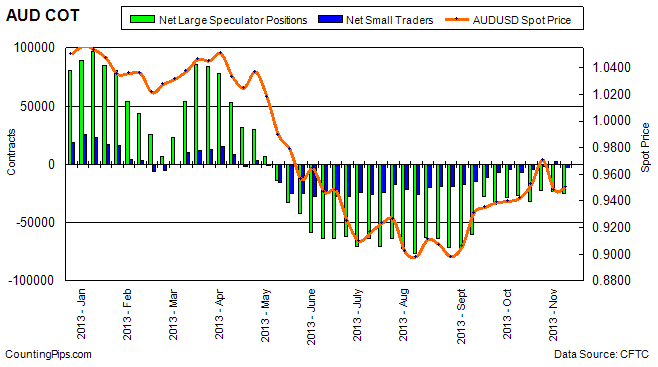
Last Six Weeks of Large Trader Positions: AUD
Date | Lg Trader Net | Weekly Change |
10/01/2013 | -28804 | 6015 |
10/08/2013 | -26404 | 2400 |
10/15/2013 | -32237 | -5833 |
10/22/2013 | -22111 | 10126 |
10/29/2013 | -23198 | -1087 |
11/05/2013 | -25067 | -1869 |
New Zealand Dollar:
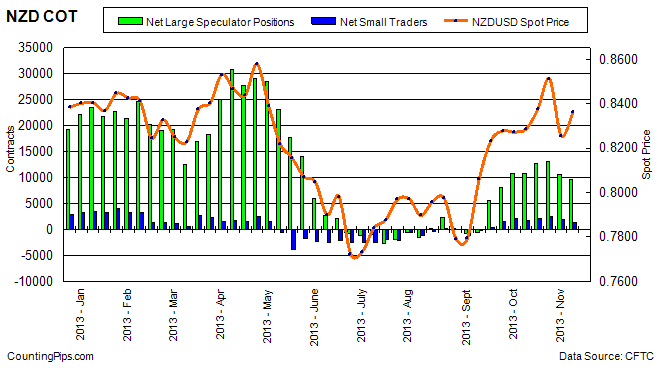
Last Six Weeks of Large Trader Positions: NZD
Date | Lg Trader Net | Weekly Change |
10/01/2013 | 10891 | 2836 |
10/08/2013 | 10766 | -125 |
10/15/2013 | 12668 | 1902 |
10/22/2013 | 13114 | 446 |
10/29/2013 | 10625 | -2489 |
11/05/2013 | 9708 | -917 |
Mexican Peso:
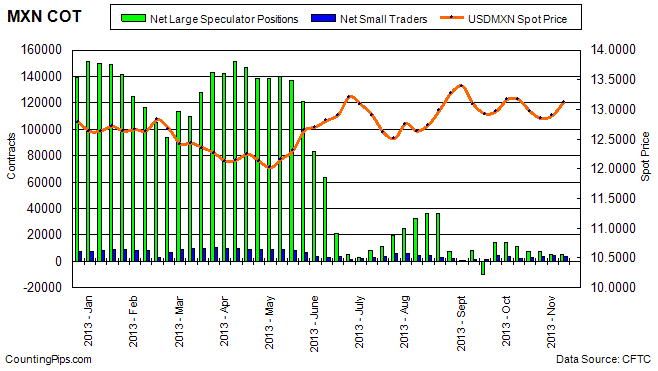
Last Six Weeks of Large Trader Positions: MXN
Date | Lg Trader Net | Weekly Change |
10/01/2013 | 14601 | 578 |
10/08/2013 | 10933 | -3668 |
10/15/2013 | 7761 | -3172 |
10/22/2013 | 7214 | -547 |
10/29/2013 | 4896 | -2318 |
11/05/2013 | 5180 | 284 |
*COT Report: The weekly commitment of traders report summarizes the total trader positions for open contracts in the futures trading markets. The CFTC categorizes trader positions according to commercial hedgers (traders who use futures contracts for hedging as part of the business), non-commercials (large traders who speculate to realize trading profits) and nonreportable traders (usually small traders/speculators).
The Commitment of Traders report is published every Friday by the Commodity Futures Trading Commission (CFTC) and shows futures positions data that was reported as of the previous Tuesday (3 days behind).
Each currency contract is a quote for that currency directly against the U.S. dollar, a net short amount of contracts means that more speculators are betting that currency to fall against the dollar and a net long position expect that currency to rise versus the dollar.
(The graphs overlay the forex spot closing price of each Tuesday when COT trader positions are reported for each corresponding spot currency pair.)
See more information and explanation on the weekly COT report from the CFTC website.
Article by CountingPips.com – Currency Trading News
US 10-Year Treasury Note Speculators increase bearish positions
By CountingPips.com
Weekly CFTC Net Speculator Report
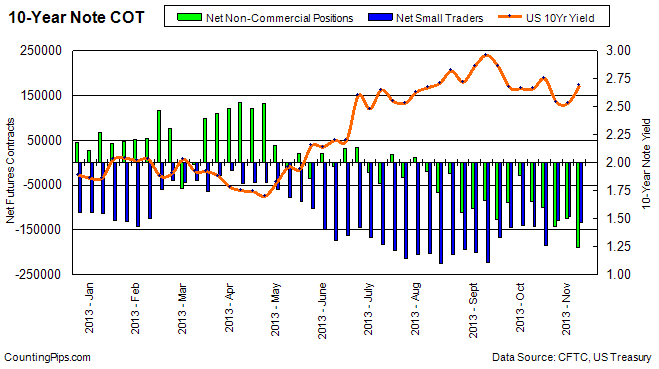
10 Year Treasuries: Large trader and futures market speculators raised their overall bearish positions by the largest amount since late August in the 10-year treasury note futures for November 5th, according to data released by the Commodity Futures Trading Commission (CFTC) on Friday. The non-commercial futures contracts of the 10-year treasury notes, traded by large speculators and hedge funds, totaled a net position of -189,188 contracts in the data reported for November 5th. This was a change of -63,518 contracts from the previous week’s total of -125,670 net contracts that was registered on October 29th. This most recent data represents the highest bearish position in 10-year notes in 2013 and the biggest change in non-commercial positions since August 27th when positions declined by -85,985 contracts.
Over the same time-frame, the yield on the 10-Year treasury note increased from 2.53 on Tuesday October 29th to 2.69 on Tuesday November 5th, according to US Treasury data.
Last 6 Weeks of Large Trader Positions
Date | Net Large Specs | Weekly Change | 10 Year Yield |
10/01/2013 | -28536 | 60571 | 2.66 |
10/08/2013 | -87571 | -59035 | 2.66 |
10/15/2013 | -99788 | -12217 | 2.75 |
10/22/2013 | -142550 | -42762 | 2.54 |
10/29/2013 | -125670 | 16880 | 2.53 |
11/05/2013 | -189188 | -63518 | 2.69 |
*COT Report: The weekly commitment of traders report summarizes the total trader positions for open contracts in the futures trading markets. The CFTC categorizes trader positions according to commercial hedgers (traders who use futures contracts for hedging as part of the business), non-commercials (large traders who speculate to realize trading profits) and nonreportable traders (usually small traders/speculators). Find CFTC criteria here: (http://www.cftc.gov/MarketReports/CommitmentsofTraders/ExplanatoryNotes/index.htm).
Article by CountingPips.com – Forex Trading News & Analysis
VIX Futures Speculators added to bearish bets last week – COT Data
By CountingPips.com
Weekly CFTC Net Speculator Report
VIX: Large traders and speculators slightly increased their bearish positions on November 5th in the VIX futures market after decreasing bearish positions the previous four weeks, according to the Commodity Futures Trading Commission (CFTC) data released on Friday. The VIX non-commercial contracts, usually representing large speculators and hedge funds, totaled a net position of -41,908 contracts in the data reported for November 5th. This was a change of -2,235 contracts from the previous week’s total of -39,673 net contracts that was registered on October 29th.
Over the same time-frame, the VIX index score edged lower from 13.41 on Tuesday October 29th to 13.27 on Tuesday November 5th, according to the Chicago Board Options Exchange (CBOE) Volatility Index.
Last 6 Weeks of Large Trader Positions
Date | Net Non-Commericals | Change |
10/01/2013 | -81942 | -408 |
10/08/2013 | -72250 | 9692 |
10/15/2013 | -63614 | 8636 |
10/22/2013 | -43297 | 20317 |
10/29/2013 | -39673 | 3624 |
11/05/2013 | -41908 | -2235 |
*COT Report: The weekly commitment of traders report summarizes the total trader positions for open contracts in the futures trading markets. The CFTC categorizes trader positions according to commercial hedgers (traders who use futures contracts for hedging as part of the business), non-commercials (large traders who speculate to realize trading profits) and nonreportable traders (usually small traders/speculators). Find CFTC criteria here: (http://www.cftc.gov/MarketReports/CommitmentsofTraders/ExplanatoryNotes/index.htm).
Article by CountingPips.com – Forex News & Analysis
VIDEO: Pied-à-Terre Markets Are Hot in These Cities
A snapshot of three global cities (New York, Paris, and London) and the market for luxury studios and one bedroom homes, and what buyers should know about buying a pied-à-terre abroad. Photo: Emmanuel Fradin for The Wall Street Journal.
USDCHF Daily Forex Fibonacci Levels & Trends Data 2013.11.08
2013.11.08 | USDCHF Market Analysis
USDCHF Trends & Fibonacci Retracement Levels
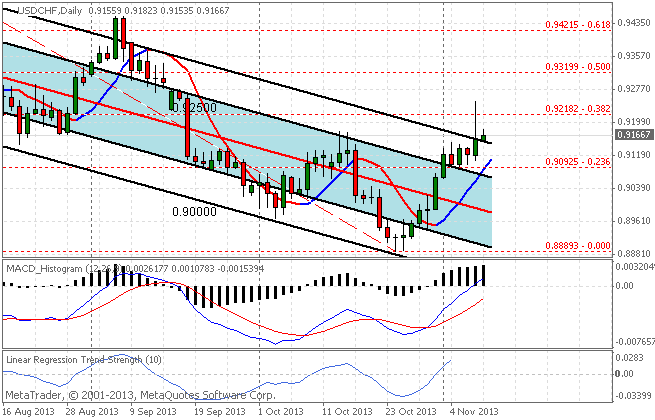
The USDCHF currency pair has been rising in forex market trading the past two days with the USDCHF registering a high of 0.91823 and a low of 0.91535 so far today. Trends data today shows the pair continues to be in a short-term uptrend as prices are trading over our favored short-term moving average. Over the longer term trend, as seen on the chart by the 90 day Linear Regression Channels indicator, the pair continues to be in a downtrend. Prices are currently in overbought or extreme deviation from the mean territory (2 standard deviations above center line) which can signal the start of a new trend change or an impending sharp return to the trend.
USDCHF Trends Data: Linear Regression Indicator
10-day current trend is BULLISH / Trend strength of 272.9 pips
30-day current trend is BULLISH / Trend strength of 33.4 pips
60-day current trend is BEARISH / Trend strength of -308.7 pips
90-day current trend is BEARISH / Trend strength of -480.5 pips
180-day current trend is BEARISH / Trend strength of -449.4 pips
Fibonacci Retracement Levels over last 100 Days
— 0.000 – 0.88893
— 0.236 – 0.90925
— 0.382 – 0.92182
— 0.500 – 0.93199
— 0.618 – 0.94215
— 0.764 – 0.95472
— 1.000 – 0.97504
By CountingPips.com – Forex Trading Apps & Currency Trade News
Disclaimer: Foreign Currency trading and trading on margin carries a high level of risk and volatility and can result in loss of part or all of your investment. All information and opinions contained do not constitute investment advice and accuracy of prices, charts, calculations cannot be guaranteed.
EURUSD Daily Forex Fibonacci Levels & Trends Data
2013.11.08 | EURUSD Market Analysis
EURUSD Trends & Fibonacci Retracement Levels
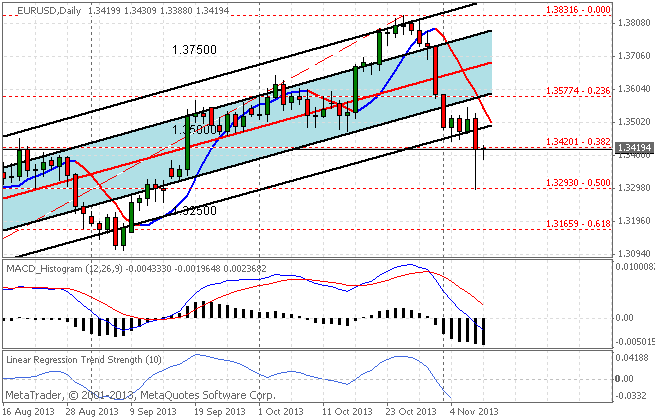
The EURUSD currency pair has been falling in forex market trading over the past couple days with the pair remaining under the major 1.3500 level. Trends data shows the pair is currently in a short-term downtrend as prices are trading under our favored short-term moving average. Over the longer term trend, as seen on the chart by the 90 day Linear Regression Channels, the pair continues to be in an uptrend although the pair trades at the edge of our channels (an extreme deviation or oversold level) and further downward direction from here can indicate a possible trend change.
EURUSD Trends Data: Linear Regression Indicator
10-day current trend is BEARISH
30-day current trend is BULLISH
60-day current trend is BULLISH
90-day current trend is BULLISH
180-day current trend is BULLISH
Fibonacci Retracement Target Levels
— 0.000 – 0.88893
— 0.236 – 0.90925
— 0.382 – 0.92182
— 0.500 – 0.93199
— 0.618 – 0.94215
— 0.764 – 0.95472
— 1.000 – 0.97504
By CountingPips.com – Forex Trading Apps & Currency Trade News
Disclaimer: Foreign Currency trading and trading on margin carries a high level of risk and volatility and can result in loss of part or all of your investment. All information and opinions contained do not constitute investment advice and accuracy of prices, charts, calculations cannot be guaranteed.
VIDEO: Government Shutdown Hit Economy, Wasted Money: White House
The White House budget office on Thursday catalogued the economic damage from the 16-day government shutdown, saying the closure wasted billions of government dollars and hurt individuals and businesses that depend on government functions. Broadly speaking, the shutdown shaved an estimated 0.2 to 0.6 of a percentage point off U.S. gross domestic product in the last three months of the year. Budget Director Sylvia Matthews Burwell said the report was prepared at the request of Democratic Senator Barbara Mikulski and because the White House wanted to document the impact of the shutdown.
VIDEO: Debate sobre el sector bancario en Europa
Han pasado cinco años desde estallido de la crisis y en Europa todavía se debate sobre la reforma del sistema financiero y la unión bancaria. La organización Finance Watch ha organizado una conferencia con expertos en Bruselas. Cree que los europeos todavía están expuestos a los riesgos de cualquier fallo. “El principal problema en Europa es que tenemos bancos demasiado grandes, que funcionan de una forma muy compleja y están muy interconectados lo que hace que cualquier sistema para proteger a los contribuyentes de la quiebra de los bancos no logre sus objetivos”, ha dicho Thierry Philipponat, secretario general de Finance Watch. La Organización para la Cooperación y el Desarrollo Económico (OCDE) piensa que Europa todavía no tiene los recursos suficientes para prevenir futuras crisis. “Si dejamos que el problema venga es bueno tener un mercado único, una autoridad de resolución y un gran fondo de rescate. Son instrumentos que cuestan mucho dinero. Pero la clave es evitar llegar a ese punto”, ha explicado Adrian Blundell-Wignall, consejero de la OCDE. Muchos creen que los políticos dan demasiado dinero a los bancos para su rescate, pero que ese dinero nunca o casi nunca se sabe muy bien a dónde va. De hecho menos de un tercio de todo el dinero llega a los hogares en forma de préstamos. “Los grupos de consumidores tienen que tener más poder. Pero incluso si están en esta posición necesitan acceder a las reglas del mercado desde el principio porque sino será demasiado tarde”, aclara Walter Mattli, profesor de la Universidad de Oxford.
USDJPY Trading Pivot Point & Trends Levels for 2013.11.07
2013.11.07 14:00 7:00AM ET | USDJPY Currency Pair
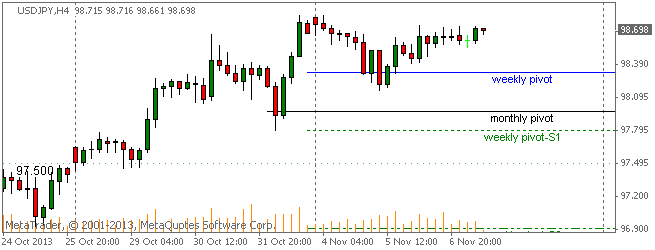
Here are today’s current Pivot Points Levels with Support (S) and Resistance (R) for the USDJPY currency pair. Price action is currently trading higher than the daily pivot point at the 98.677 price level, according to data at 7:00 AM ET. The pair opened the Asian trading session earlier today above the daily pivot and has traded higher over the course of the day after bouncing off the pivot area.
Daily Pivot Point: 98.599
— S1 – 98.450
— S2 – 98.251
— S3 – 98.102
— R1 – 98.798
— R2 – 98.947
— R3 – 99.146
Weekly Pivot Points: USDJPY
Prices are currently trading over the weekly pivot point on Thursday Nov. 7th. The USDJPY has been on a down and up path so far this week after opening the trading week above the weekly pivot. The pair has not made much headway either way on the week.
Weekly Pivot Point: 98.317
— S1 – 97.795
— S2 – 96.914
— S3 – 96.392
— R1 – 99.198
— R2 – 99.720
— R3 – 100.601
USDJPY Trends & Fibonacci Retracement Levels
The USDJPY currency pair has been almost unchanged in forex market trading today with the USDJPY registering a high of 98.739 and a low of 98.547 on the day. Trend data shows the pair is currently in a short-term uptrend as prices are trading over our favored short-term moving average. Over the longer term trend, as seen on the chart by the 90 day Linear Regression Channels, the pair continues to be in a downtrend. The pair is currently trading at the significant fibonacci 50% retracement level which should provide support or resistance going forward.
USDJPY Trends Data: Linear Regression Indicator
10-day current trend is BULLISH / Trend strength of 154.8 pips
30-day current trend is BULLISH / Trend strength of 67.5 pips
60-day current trend is BEARISH / Trend strength of -46.8 pips
90-day current trend is BEARISH / Trend strength of -139.3 pips
180-day current trend is BULLISH / Trend strength of 197.7 pips
Fibonacci Retracement Levels
— 0.000 – 101.524
— 0.236 – 100.173
— 0.382 – 99.337
— 0.500 – 98.661
— 0.618 – 97.985
— 0.764 – 97.149
— 1.000 – 95.798
By CountingPips.com – Currency Trading Apps & Forex Trade Tools
Disclaimer: Foreign Currency trading and trading on margin carries a high level of risk and volatility and can result in loss of part or all of your investment. All information and opinions contained do not constitute investment advice and accuracy of prices, charts, calculations cannot be guaranteed.