USDCHF Forex Trading Pivot Point Levels for 2013.11.13

2013.11.13 13:30 6:30AM ET | USDCHF Currency Pair

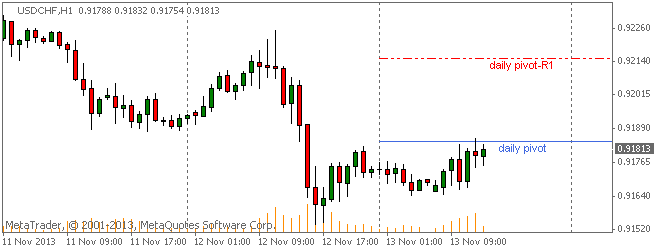
Here are the current Pivot Points Levels with Support (S) and Resistance (R) for the USDCHF currency pair. Price action is currently trading slightly under the daily pivot point at the 0.91813 price level, according to data at 6:30 AM ET. The pair opened the Asian trading session earlier today below the daily pivot and has traded higher over the course of the day and finding resistance at the pivot.

SC USDCHF 2013.11.13

Daily Pivot Point: 0.91843
— S1 – 0.91434
— S2 – 0.91128
— S3 – 0.90719
— R1 – 0.92149
— R2 – 0.92558
— R3 – 0.92864


Weekly Pivot Points: USDCHF

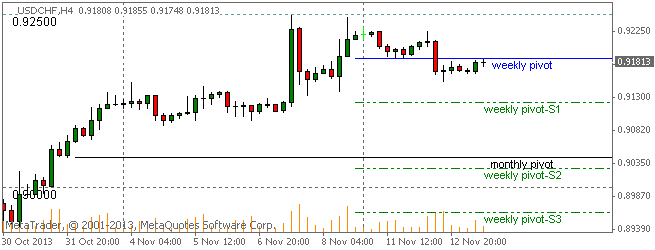
Prices are currently trading just under the weekly pivot point at time of writing. The USDCHF has been on a moderately bearish pace this week after opening the trading week above the weekly and monthly pivots.

SC USDCHF 2013.11.13

Weekly Pivot Point: 0.91860
— S1 – 0.91233
— S2 – 0.90273
— S3 – 0.89646
— R1 – 0.92820
— R2 – 0.93447
— R3 – 0.94407


By CountingPips.com – Forex Trading Apps & Currency Trade Tools

Disclaimer: Foreign Currency trading and trading on margin carries a high level of risk and volatility and can result in loss of part or all of your investment. All information and opinions contained do not constitute investment advice and accuracy of prices, charts, calculations cannot be guaranteed.


USDJPY Forex Trading Pivot Point Levels for 2013.11.13

2013.11.13 13:30 6:30AM ET | USDJPY Currency Pair

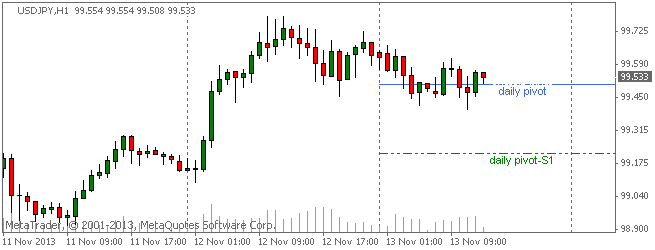
Here are the current Pivot Points Levels with Support (S) and Resistance (R) for the USDJPY currency pair. Price action is currently trading slightly over the daily pivot point at the 99.533 price level, according to data at 6:30 AM ET. The pair opened the Asian trading session earlier today higher than the daily pivot and has traded lower over the course of the day to around the pivot level.

SC USDJPY 2013.11.13

Daily Pivot Point: 99.503
— S1 – 99.217
— S2 – 98.810
— S3 – 98.524
— R1 – 99.910
— R2 – 100.196
— R3 – 100.603


Weekly Pivot Points: USDJPY

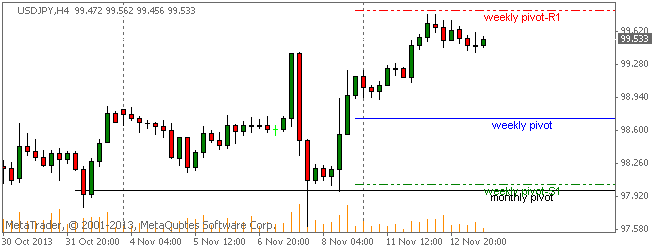
Prices are currently trading higher than the weekly pivot point at time of writing. The USDJPY has been on a bullish pace this week and has touched a high near the R1 level after opening the trading week above the weekly and monthly pivots.

SC USDJPY 2013.11.13

Weekly Pivot Point: 98.721
— S1 – 98.040
— S2 – 96.929
— S3 – 96.248
— R1 – 99.832
— R2 – 100.513
— R3 – 101.624


By CountingPips.comForex Trading Apps & Currency Trade Tools


Disclaimer: Foreign Currency trading and trading on margin carries a high level of risk and volatility and can result in loss of part or all of your investment. All information and opinions contained do not constitute investment advice and accuracy of prices, charts, calculations cannot be guaranteed.
 

EURUSD Forex Trading Pivot Point Levels for 2013.11.13

2013.11.13 13:30 6:30AM ET | EURUSD Currency Pair

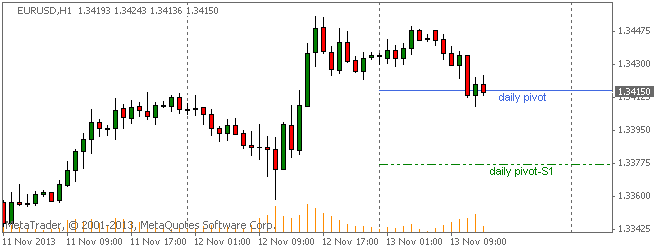
Here are the current Pivot Points Levels with Support (S) and Resistance (R) for the EURUSD currency pair. Price action is currently trading just slightly under the daily pivot point at the 1.34150 price level, according to data at 6:30 AM ET. The pair opened the Asian trading session earlier today above the daily pivot and has fallen lower over the progress of the day.

SC EURUSD 2013.11.13

Daily Pivot Point: 1.34162
— S1 – 1.33769
— S2 – 1.33189
— S3 – 1.32796
— R1 – 1.34742
— R2 – 1.35135
— R3 – 1.35715


Weekly Pivot Points: EURUSD

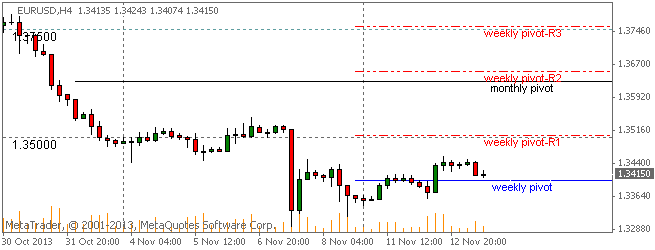
Prices are currently trading slightly over the weekly pivot point at time of writing. The EURUSD has been on a moderately bullish pace this week after opening the trading week below the weekly and monthly pivots.

SC EURUSD 2013.11.13

Weekly Pivot Point: 1.34001
— S1 – 1.32535
— S2 – 1.31482
— S3 – 1.30016
— R1 – 1.35054
— R2 – 1.36520
— R3 – 1.37573


By CountingPips.com – Forex Trading Apps & Currency Trade Tools


Disclaimer: Foreign Currency trading and trading on margin carries a high level of risk and volatility and can result in loss of part or all of your investment. All information and opinions contained do not constitute investment advice and accuracy of prices, charts, calculations cannot be guaranteed.
 

VIDEO: Chicago Bonds Hold Up In Light Trading After Downgrade

U.S. municipal bonds issued by Chicago held up in light trading even as the city’s debt suffered another triple-notch ratings downgrade on mounting concerns about its public pension liabilities. Late on Friday, Fitch Ratings cut its credit rating on Chicago’s $8 billion of unlimited tax general obligation bonds to A-minus from AA-minus, citing the city’s lack of meaningful fixes for its underfunded city worker retirement system. In one of a handful of small Chicago debt trades on Monday, some of the city’s 30-year taxable bonds, due January 2040, opened lower at 92.6 cents on the dollar from 93.5 cents on Friday.

GBPUSD Daily Fibonacci Forex Levels & Trends Data 2013.11.12

2013.11.12 | GBPUSD Market Analysis

GBPUSD Trends & Fibonacci Retracement Levels

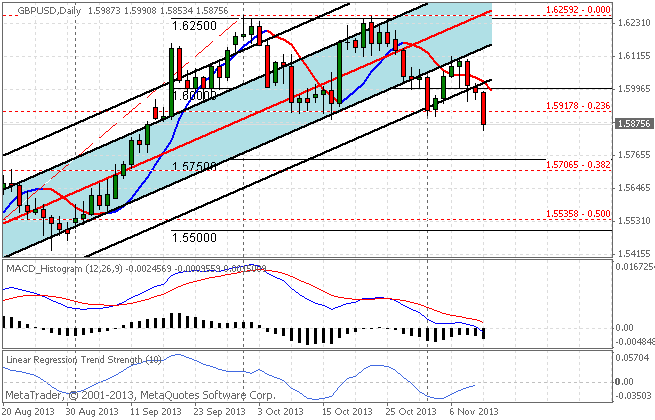
The GBPUSD currency pair has been falling fast in forex market trading today with the GBPUSD registering a high of 1.59908 and a low of 1.58534 so far on the day. Trends data shows the pair is currently in a short-term downtrend as prices are trading under our favored short-term moving average of 21 periods. Over the longer term trend, as seen on the chart by the 90 day Linear Regression Channels, this pair continues to be in an uptrend although with prices declining outside the channels, we have to watch for a possible change in trend.

SC GBPUSD 2013.11.12


GBPUSD Trends Data: Linear Regression Indicator

10-day current trend is BEARISH / Trend strength of -66.2 pips
30-day current trend is BEARISH / Trend strength of -95.0 pips
60-day current trend is BULLISH / Trend strength of 571.2 pips
90-day current trend is BULLISH / Trend strength of 1118.0 pips
180-day current trend is BULLISH / Trend strength of 1020.5 pips

Fibonacci Retracement Levels over last 100 Days

— 0.000 – 1.62592
— 0.236 – 1.59178
— 0.382 – 1.57065
— 0.500 – 1.55358
— 0.618 – 1.53651
— 0.764 – 1.51538
— 1.000 – 1.48124


By CountingPips.com – Forex Trading Apps & Currency Trade Tools


Disclaimer: Foreign Currency trading and trading on margin carries a high level of risk and volatility and can result in loss of part or all of your investment. All information and opinions contained do not constitute investment advice and accuracy of prices, charts, calculations cannot be guaranteed.


USDJPY Daily Forex Fibonacci Levels & Trends Data 2013.11.12

2013.11.12 | USDJPY Market Analysis

USDJPY Trends & Fibonacci Retracement Levels

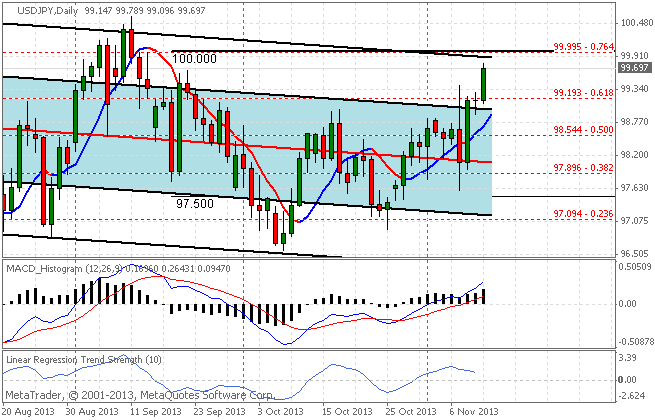
The USDJPY currency pair has been riding higher in forex market trading today with the USDJPY registering a high of 99.789 and a low of 99.096 so far on the day. Trends data shows the pair is currently in a short-term uptrend as prices are trading higher than our favored short-term moving average (21 periods). Over the longer term trend, as seen on the chart by the 90 day Linear Regression Channels, the pair continues to be in an slight downtrend and prices are currently heading for a collision with the 100 major price level.

SC USDJPY 2013.11.12


USDJPY Trends Data: Linear Regression Indicator

10-day current trend is BULLISH / Trend strength of 116.3 pips
30-day current trend is BULLISH / Trend strength of 158.1 pips
60-day current trend is BEARISH / Trend strength of -52.0 pips
90-day current trend is BEARISH / Trend strength of -83.8 pips
180-day current trend is BULLISH / Trend strength of 156.7 pips

Fibonacci Retracement Levels over last 100 Days

— 0.000 – 101.524
— 0.236 – 100.173
— 0.382 – 99.337
— 0.500 – 98.661
— 0.618 – 97.985
— 0.764 – 97.149
— 1.000 – 95.798


By CountingPips.com – Forex Trading Apps & Currency Trade Tools


Disclaimer: Foreign Currency trading and trading on margin carries a high level of risk and volatility and can result in loss of part or all of your investment. All information and opinions contained do not constitute investment advice and accuracy of prices, charts, calculations cannot be guaranteed.


USDCHF Daily Forex Fibonacci Retracement Levels & Trends Data 2013.11.12

2013.11.12 | USDCHF Market Analysis

USDCHF Trends & Fibonacci Retracement Levels

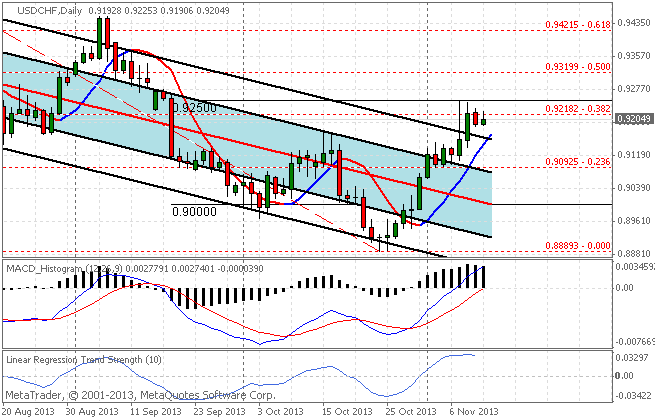
The USDCHF currency pair has been rising in forex market trading over the past week. The USDCHF has registered a high of 0.92253 and a low of 0.91906 so far on the day. Trends data shows the pair is currently in a short-term uptrend (and perhaps topping out) as prices are trading over our favored short-term moving average. Over the longer term trend, as seen on the chart by the 90 day Linear Regression Channels, the pair continues to be in an downtrend while with prices sustained outside the channels will threaten this overall trend.

SC USDCHF 2013.11.12


USDCHF Trends Data: Linear Regression Indicator

10-day current trend is BULLISH / Trend strength of 245.8 pips
30-day current trend is BULLISH / Trend strength of 94.7 pips
60-day current trend is BEARISH / Trend strength of -272.4 pips
90-day current trend is BEARISH / Trend strength of -424.4 pips
180-day current trend is BEARISH / Trend strength of -450.1 pips

Fibonacci Retracement Levels over last 100 Days

— 0.000 – 0.88893
— 0.236 – 0.90925
— 0.382 – 0.92182
— 0.500 – 0.93199
— 0.618 – 0.94215
— 0.764 – 0.95472
— 1.000 – 0.97504


By CountingPips.comForex News & Forex Trading Apps


Disclaimer: Foreign Currency trading and trading on margin carries a high level of risk and volatility and can result in loss of part or all of your investment. All information and opinions contained do not constitute investment advice and accuracy of prices, charts, calculations cannot be guaranteed.


EURUSD Daily Fibonacci Forex Levels & Trends Data 2013.11.12

2013.11.12 | EURUSD Market Analysis

EURUSD Trends & Fibonacci Retracement Levels

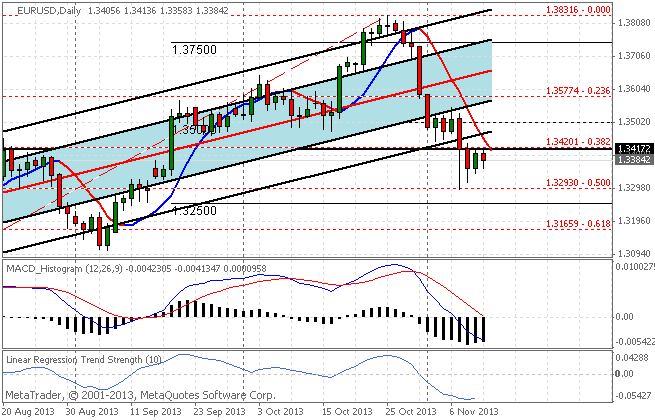
The EURUSD currency pair has been declining modestly in forex market trading today with the EURUSD registering a high of 1.34136 and a low of 1.33583 on the day. Trends data shows the pair is currently in a short-term downtrend as prices are trading under our favored short-term moving average. Over the longer term trend, as seen on the chart by the 90 day Linear Regression Channels, the pair continues to be in an uptrend and look for the 1.3400 level to act as important support/resistance going forward.

SC EURUSD 2013.11.12


EURUSD Trends Data: Linear Regression Indicator

10-day current trend is BEARISH / Trend strength of -395.4 pips
30-day current trend is BEARISH / Trend strength of -92.9 pips
60-day current trend is BULLISH / Trend strength of 383.9 pips
90-day current trend is BULLISH / Trend strength of 556.6 pips
180-day current trend is BULLISH / Trend strength of 719.2 pips

Fibonacci Retracement Levels over last 100 Days

— 0.000 – 1.38316
— 0.236 – 1.35774
— 0.382 – 1.34201
— 0.500 – 1.32930
— 0.618 – 1.31659
— 0.764 – 1.30086
— 1.000 – 1.27544


By CountingPips.com – Forex Trading Apps & Currency Trade Tools


Disclaimer: Foreign Currency trading and trading on margin carries a high level of risk and volatility and can result in loss of part or all of your investment. All information and opinions contained do not constitute investment advice and accuracy of prices, charts, calculations cannot be guaranteed.
 

USDJPY Forex Trading Pivot Point Levels for 2013.11.12

2013.11.12 14:00 7:00AM ET | USDJPY Currency Pair

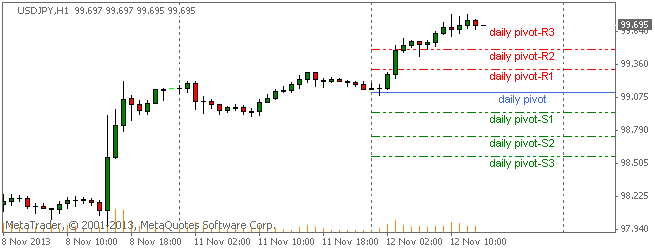
Here are the current Pivot Points Levels with Support (S) and Resistance (R) for the USDJPY currency pair. Price action is currently trading well over the daily pivot point at the 99.695 price level, according to data at 7:00 AM ET. The pair opened the Asian trading session earlier today slightly above the daily pivot and has trended sharply higher so far today to over the R3 resistance level.

SC USDJPY 2013.11.12

Daily Pivot Point: 99.117
— S1 – 98.944
— S2 – 98.741
— S3 – 98.568
— R1 – 99.320
— R2 – 99.493
— R3 – 99.696


Weekly Pivot Points: USDJPY

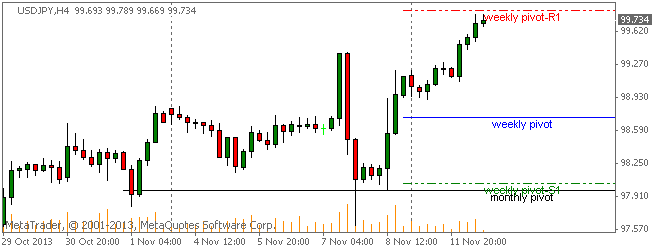
Prices are currently trading over the weekly pivot point at time of writing. The USDJPY has been on a bullish pace so far this week after opening the trading week above the weekly and monthly pivots and now trades at the R1 resistance weekly level.

SC USDJPY 2013.11.12

Weekly Pivot Point: 98.721
— S1 – 98.040
— S2 – 96.929
— S3 – 96.248
— R1 – 99.832
— R2 – 100.513
— R3 – 101.624


By CountingPips.com – Forex Trading Apps & Currency Trade Tools


Disclaimer: Foreign Currency trading and trading on margin carries a high level of risk and volatility and can result in loss of part or all of your investment. All information and opinions contained do not constitute investment advice and accuracy of prices, charts, calculations cannot be guaranteed.


GBPUSD Forex Trading Pivot Points: Pound drops sharply to US Dollar

2013.11.12 | GBPUSD Currency Pair

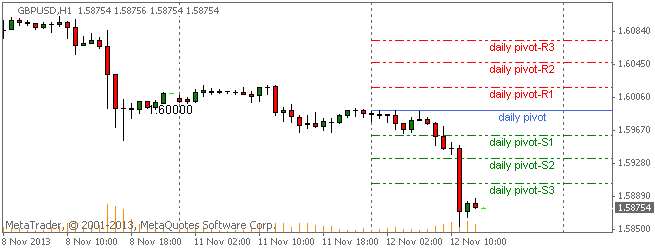
Here are the current Pivot Points Levels with Support (S) and Resistance (R) for the GBPUSD currency pair. Price action is currently trading sharply lower than the daily pivot point at the 1.58754 price level, according to data at 7:00 AM ET. The pair opened the Asian trading session earlier today slightly below the daily pivot and has dropped lower over the course of the day falling all the way through the S3 support level.

SC GBPUSD 2013.11.12

Daily Pivot Point: 1.59910
— S1 – 1.59611
— S2 – 1.59344
— S3 – 1.59045
— R1 – 1.60177
— R2 – 1.60476
— R3 – 1.60743


Weekly Pivot Points: GBPUSD

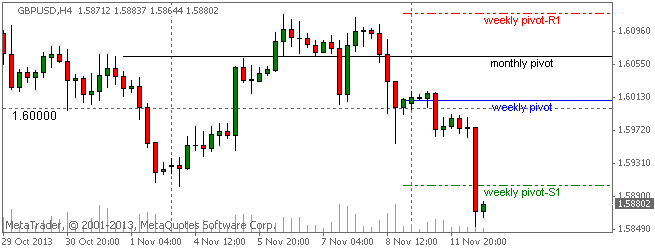
Prices are currently trading under the weekly pivot point at time of writing on Tuesday Nov, 12th. The GBPUSD has been on a bearish pace this week after opening the trading week slightly below the weekly pivot and further below the monthly pivot.

SC GBPUSD 2013.11.12

Weekly Pivot Point: 1.60101
— S1 – 1.59035
— S2 – 1.57957
— S3 – 1.56891
— R1 – 1.61179
— R2 – 1.62245
— R3 – 1.63323


By CountingPips.comForex Trading Apps & Currency Trade Tools

Disclaimer: Foreign Currency trading and trading on margin carries a high level of risk and volatility and can result in loss of part or all of your investment. All information and opinions contained do not constitute investment advice and accuracy of prices, charts, calculations cannot be guaranteed.