EURUSD Forex Trading Pivot Point Levels for 2013.11.21

2013.11.21 13:30 6:30AM ET | EURUSD Currency Pair

Here are the current Pivot Points Levels with Support (S) and Resistance (R) for the EURUSD currency pair. Price action is currently trading under the daily pivot point at the 1.34292 price level, according to data at 6:30 AM ET. The pair opened the Asian trading session earlier today below the daily pivot and has traded sideways over the course of the day.

SC EURUSD 2013.11.21

Daily Pivot Point: 1.34768
— S1 – 1.33751
— S2 – 1.33126
— S3 – 1.32109
— R1 – 1.35393
— R2 – 1.36410
— R3 – 1.37035


Weekly Pivot Points: EURUSD

Prices are currently trading under the weekly pivot point at time of writing. The EURUSD has been on a bearish pace this week after opening the trading week above the weekly pivot, ascending to over 1.3550 and the R1 resistance before retreating.

SC EURUSD 2013.11.21

Weekly Pivot Point: 1.34479
— S1 – 1.33907
— S2 – 1.32871
— S3 – 1.32299
— R1 – 1.35515
— R2 – 1.36087
— R3 – 1.37123


By CountingPips.com – Forex Trading Apps & Currency Trade Tools

Disclaimer: Foreign Currency trading and trading on margin carries a high level of risk and volatility and can result in loss of part or all of your investment. All information and opinions contained do not constitute investment advice and accuracy of prices, charts, calculations cannot be guaranteed.


USDCHF Daily Forex Fibonacci Levels & Trends Data 2013.11.21

2013.11.21 | USDCHF Market Analysis

USDCHF Trends & Fibonacci Retracement Levels

The USDCHF currency pair has been declining in forex market trading today with the USDCHF registering a high of 0.91876 and a low of 0.91405 on the day. Trends data shows the pair is currently in a short-term downtrend as prices are trading under our favored short-term moving average of 21 periods. Over the longer term trend, as seen on the chart by the 90 day Linear Regression Channels indicator, the pair continues to be in a downtrend with prices meeting resistance at the 50% retracement area (0.91831).

SC USDCHF 2013.11.21


USDCHF Trends Data: Linear Regression Indicator

10-day current trend is BEARISH / Trend strength of -60.0 pips
30-day current trend is BULLISH / Trend strength of 142.4 pips
60-day current trend is BEARISH / Trend strength of -229.8 pips
90-day current trend is BEARISH / Trend strength of -311.5 pips
180-day current trend is BEARISH / Trend strength of -457.7 pips

Fibonacci Retracement Levels over last 100 Days

— 0.000 – 0.88892
— 0.236 – 0.90924
— 0.382 – 0.92182
— 0.500 – 0.93198
— 0.618 – 0.94214
— 0.764 – 0.95472
— 1.000 – 0.97504


By CountingPips.comForex Trading Apps & Currency Trade Tools


Disclaimer: Foreign Currency trading and trading on margin carries a high level of risk and volatility and can result in loss of part or all of your investment. All information and opinions contained do not constitute investment advice and accuracy of prices, charts, calculations cannot be guaranteed.


GBPUSD Daily Forex Fibonacci Levels & Trends Data 2013.11.21

2013.11.21 | GBPUSD Market Analysis

GBPUSD Trends & Fibonacci Retracement Levels

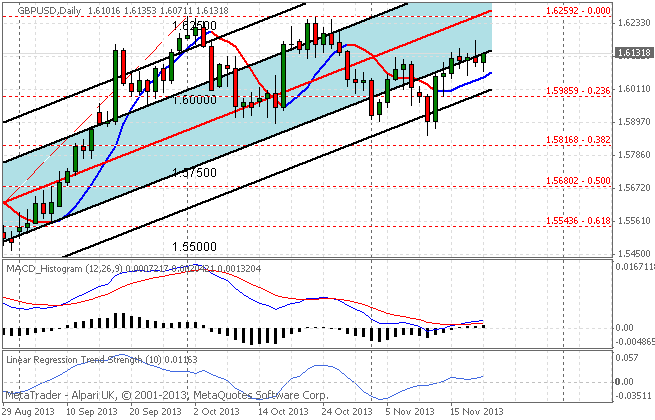
The GBPUSD currency pair has been rising in forex market trading today after yesterday’s up and down day with the GBPUSD registering a high of 1.61353 and a low of 1.60711. Trends data shows the pair is currently in a short-term uptrend as prices are trading over our favored short-term moving average of 21 periods. Over the longer term trend, as seen on the chart by the 90 day Linear Regression Channels indicator, the pair continues to be in an uptrend and remains above the 1.6100 level.

forex GBPUSD 2013.11.21


GBPUSD Trends Data: Linear Regression Indicator

10-day current trend is BULLISH / Trend strength of 139.0 pips
30-day current trend is BULLISH / Trend strength of 21.3 pips
60-day current trend is BULLISH / Trend strength of 423.3 pips
90-day current trend is BULLISH / Trend strength of 960.2 pips
180-day current trend is BULLISH / Trend strength of 1025.2 pips

Fibonacci Retracement Levels over last 100 Days

— 0.000 – 1.62592
— 0.236 – 1.59178
— 0.382 – 1.57065
— 0.500 – 1.55358
— 0.618 – 1.53651
— 0.764 – 1.51538
— 1.000 – 1.48124


By CountingPips.comForex Trading Apps & Currency Trade Tools


Disclaimer: Foreign Currency trading and trading on margin carries a high level of risk and volatility and can result in loss of part or all of your investment. All information and opinions contained do not constitute investment advice and accuracy of prices, charts, calculations cannot be guaranteed.


VIDEO: Norway, UK, U.S. Allocate $280 Mln To Stop Deforestation

The governments of Norway, Britain and the United States on Wednesday said they will allocate $280 million of their multi-billion dollar climate change finances to a new initiative aimed at halting deforestation. Agriculture drives around 80 percent of the planet’s deforestation, causing nearly a fifth of global greenhouse gas emissions as forest roughly the size of Costa Rica is chopped down worldwide each year. “This isn’t just an environmental issue. The U.N. summit is struggling to make progress on an effort to protect forests and cut carbon emissions, known as Reducing Emissions from Deforestation and Forest Degradation (REDD+).

AUDUSD Daily Forex Fibonacci Levels & Trends Data 2013.11.20

2013.11.20 | AUDUSD Market Analysis

AUDUSD Trends & Fibonacci Retracement Levels

The AUDUSD currency pair has been falling in forex market trading today with the AUDUSD registering a high of 0.94464 and a low of 0.93808 on the day. Trends data shows the pair is currently in a short-term uptrend as prices have crossed over our favored short-term moving average. Over the longer term trend, as seen on the chart by the 90 day Linear Regression Channels, the pair continues to be in an uptrend with the major 0.9500 level a possible target upcoming.

SC AUDUSD 2013.11.20


AUDUSD Trends Data: Linear Regression Indicator

10-day current trend is BEARISH / Trend strength of -74.5 pips
30-day current trend is BEARISH / Trend strength of -228.1 pips
60-day current trend is BULLISH / Trend strength of 374.2 pips
90-day current trend is BULLISH / Trend strength of 527.1 pips
180-day current trend is BEARISH / Trend strength of -1162.6 pips

Fibonacci Retracement Levels over last 100 Days

— 0.000 – 0.97568
— 0.236 – 0.95420
— 0.382 – 0.94092
— 0.500 – 0.93018
— 0.618 – 0.91944
— 0.764 – 0.90616
— 1.000 – 0.88468


By CountingPips.comForex Trading Apps & Currency Trade Tools


Disclaimer: Foreign Currency trading and trading on margin carries a high level of risk and volatility and can result in loss of part or all of your investment. All information and opinions contained do not constitute investment advice and accuracy of prices, charts, calculations cannot be guaranteed.


GBPUSD Forex Trading Pivot Point Levels for 2013.11.20

2013.11.20 13:30 6:30AM ET | GBPUSD Currency Pair

Here are the current Pivot Points Levels with Support (S) and Resistance (R) for the GBPUSD currency pair. Price action is currently trading higher than the daily pivot point at the 1.61403 price level, according to data at 6:30 AM ET. The pair opened the Asian trading session earlier today above the daily pivot, bounced off the pivot line and has traded higher over the course of the day.

SC GBPUSD 2013.11.20

Daily Pivot Point: 1.61024
— S1 – 1.60737
— S2 – 1.60298
— S3 – 1.60011
— R1 – 1.61463
— R2 – 1.61750
— R3 – 1.62189


Weekly Pivot Points: GBPUSD

Prices are currently trading over the weekly pivot point at time of writing. The GBPUSD has been on a slightly bullish pace this week after opening the trading week above the weekly pivot.

SC GBPUSD 2013.11.20

Weekly Pivot Point: 1.60339
— S1 – 1.59341
— S2 – 1.57534
— S3 – 1.56536
— R1 – 1.62146
— R2 – 1.63144
— R3 – 1.64951


By CountingPips.comForex Trading Apps & Currency Trade Tools


Disclaimer: Foreign Currency trading and trading on margin carries a high level of risk and volatility and can result in loss of part or all of your investment. All information and opinions contained do not constitute investment advice and accuracy of prices, charts, calculations cannot be guaranteed.


USDCHF Forex Trading Pivot Point Levels for 2013.11.20

2013.11.20 13:30 6:30AM ET | USDCHF Currency Pair

Here are the current Pivot Points Levels with Support (S) and Resistance (R) for the USDCHF currency pair. Price action is currently trading under the daily pivot point (pre-market US trading session) at the 0.91092 price level, according to data at 6:30 AM ET. The pair opened the Asian trading session earlier today below the daily pivot, spiked lower early and has traded back higher over the course of the day.

SC USDCHF 2013.11.20

Daily Pivot Point: 0.91175
— S1 – 0.90916
— S2 – 0.90757
— S3 – 0.90498
— R1 – 0.91334
— R2 – 0.91593
— R3 – 0.91752


Weekly Pivot Points: USDCHF

Prices are currently trading under the weekly pivot point and down at the S1 support level. The USDCHF has been on a bearish pace this week after opening the trading week below the weekly pivot.

SC USDCHF 2013.11.20

Weekly Pivot Point: 0.91662
— S1 – 0.91019
— S2 – 0.90580
— S3 – 0.89937
— R1 – 0.92101
— R2 – 0.92744
— R3 – 0.93183


By CountingPips.com – Forex Trading Apps & Currency Trade Tools


Disclaimer: Foreign Currency trading and trading on margin carries a high level of risk and volatility and can result in loss of part or all of your investment. All information and opinions contained do not constitute investment advice and accuracy of prices, charts, calculations cannot be guaranteed.


EURUSD Forex Trading Pivot Point Levels for 2013.11.20

2013.11.20 13:30 6:30AM ET | EURUSD Currency Pair

Here are the current Pivot Points Levels with Support (S) and Resistance (R) for the EURUSD currency pair. Price action is currently trading at the daily pivot point at the 1.35221 price level, according to data at 6:30 AM ET. The pair opened the Asian trading session earlier today above the daily pivot, spiking higher to the 1.3580 level and has traded lower  over the course of the day.

SC EURUSD 2013.11.20

Daily Pivot Point: 1.35234
— S1 – 1.35005
— S2 – 1.34640
— S3 – 1.34411
— R1 – 1.35599
— R2 – 1.35828
— R3 – 1.36193


Weekly Pivot Points: EURUSD

Prices are currently trading over the weekly pivot point at time of writing and reside near the  R1 resistance level. The EURUSD has been on a bullish pace this week after opening the trading week above the weekly and monthly pivots.

SC EURUSD 2013.11.20

Weekly Pivot Point: 1.34479
— S1 – 1.33907
— S2 – 1.32871
— S3 – 1.32299
— R1 – 1.35515
— R2 – 1.36087
— R3 – 1.37123


By CountingPips.com – Forex Trading Apps & Currency Trade Tools

Disclaimer: Foreign Currency trading and trading on margin carries a high level of risk and volatility and can result in loss of part or all of your investment. All information and opinions contained do not constitute investment advice and accuracy of prices, charts, calculations cannot be guaranteed.


USDJPY Forex Trading Pivot Point Levels for 2013.11.20

2013.11.20 13:30 6:30AM ET | USDJPY Currency Pair

Here are the current Pivot Points Levels with Support (S) and Resistance (R) for the USDJPY currency pair today. Price action is currently trading under the daily pivot point at the 99.878 price level, according to data at 6:30 AM ET. The pair opened the Asian trading session earlier today above the daily pivot and has trended lower over the course of the day although not straying too far from the pivot.

SC USDJPY 2013.11.20

Daily Pivot Point: 99.974
— S1 – 99.703
— S2 – 99.292
— S3 – 99.021
— R1 – 100.385
— R2 – 100.656
— R3 – 101.067


Weekly Pivot Points: USDJPY

Prices are currently trading slightly above the weekly pivot point at time of writing. The USDJPY has been on an overall  bearish pace this week after opening the trading week above the weekly and monthly pivots.

SC USDJPY 2013.11.20

Weekly Pivot Point: 99.833
— S1 – 99.241
— S2 – 98.323
— S3 – 97.731
— R1 – 100.751
— R2 – 101.343
— R3 – 102.261


By CountingPips.comForex Trading Apps & Currency Trade Tools


Disclaimer: Foreign Currency trading and trading on margin carries a high level of risk and volatility and can result in loss of part or all of your investment. All information and opinions contained do not constitute investment advice and accuracy of prices, charts, calculations cannot be guaranteed.