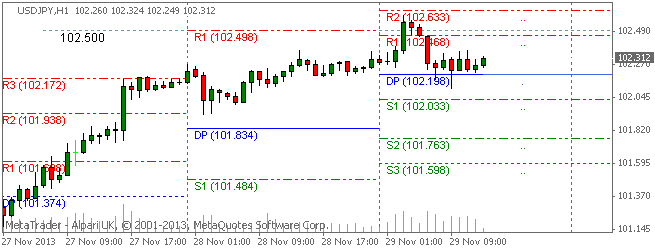
USDJPY Forex Trading Pivot Point Levels for 2013.11.29

2013.11.29 13:30 6:30AM ET | USDJPY Currency Pair

Here are the current Pivot Points Levels with Support (S) and Resistance (R) for the USDJPY currency pair today. Price action is currently trading slightly above the daily pivot point at the 102.312 price level, according to data at 6:30 AM ET. The USDJPY high for the day has been 102.601 while the low of day reached 102.107. The pair opened the Asian trading session earlier today over the daily pivot and has traded sideways overall so far today.

SC USDJPY 2013.11.29

Daily Pivot Point: 102.198
— S1 – 102.034
— S2 – 101.763
— S3 – 101.599
— R1 – 102.469
— R2 – 102.633
— R3 – 102.904


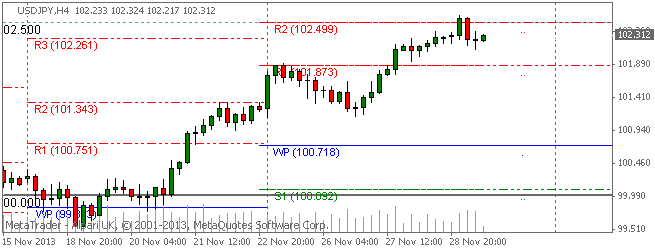
Weekly Pivot Points: USDJPY

Prices are currently trading over the weekly pivot point at time of writing. The USDJPY has been on an overall bullish pace this week after opening the trading week above the weekly pivot.

SC USDJPY 2013.11.29

Weekly Pivot Point: 100.718
— S1 – 100.093
— S2 – 98.937
— S3 – 98.312
— R1 – 101.874
— R2 – 102.499
— R3 – 103.655


By CountingPips.com – Forex Trading Apps & Currency Trade Tools


Disclaimer: Foreign Currency trading and trading on margin carries a high level of risk and volatility and can result in loss of part or all of your investment. All information and opinions contained do not constitute investment advice and accuracy of prices, charts, calculations cannot be guaranteed.


GBPUSD maintains momentum above 1.6300 level in Forex

2013.11.29 13:30 6:30AM ET | GBPUSD Currency Pair

Here are the current Pivot Points Levels with Support (S) and Resistance (R) for the GBPUSD currency pair today. Price action is currently trading just above the daily pivot point at the 1.63341 price level, according to data at 6:30 AM ET. The GBPUSD high for the day has been 1.63730 while the low of day reached 1.63137. The pair opened the Asian trading session earlier today above the daily pivot and traded higher then lower over the course of the day with resistance at the R1 level and support being found around the pivot area.

SC GBPUSD 2013.11.29

Daily Pivot Point: 1.63250
— S1 – 1.62935
— S2 – 1.62446
— S3 – 1.62131
— R1 – 1.63739
— R2 – 1.64054
— R3 – 1.64543


Weekly Pivot Points: GBPUSD

Prices are currently trading over the weekly pivot point at time of writing. The GBPUSD has been on a bullish pace this week after opening the trading week above the weekly pivot. The pair has reached above the R2 resistance level and currently trades slightly below this level at 1.6334.

SC GBPUSD 2013.11.29

Weekly Pivot Point: 1.61691
— S1 – 1.61121
— S2 – 1.60016
— S3 – 1.59446
— R1 – 1.62796
— R2 – 1.63366
— R3 – 1.64471


By CountingPips.com – Forex Trading Apps & Currency Trade Tools


Disclaimer: Foreign Currency trading and trading on margin carries a high level of risk and volatility and can result in loss of part or all of your investment. All information and opinions contained do not constitute investment advice and accuracy of prices, charts, calculations cannot be guaranteed.


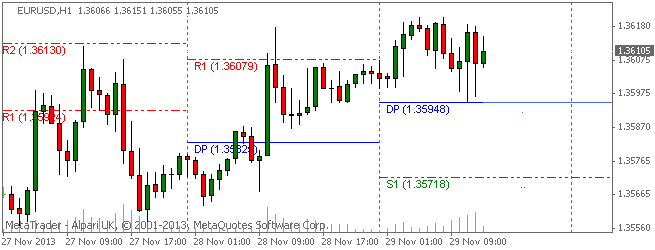
EURUSD Forex: Euro finishing bullish week vs US Dollar around 1.3600

2013.11.29 13:30 6:30AM ET | EURUSD Currency Pair

Here are the current Pivot Points Levels with Support (S) and Resistance (R) for the EURUSD currency pair today. Price action is currently trading over the daily pivot point at the 1.36105 price level, according to data at 6:30 AM ET. The
EURUSD high for the day has been 1.36210 while the low of day reached 1.35950. The pair opened the Asian trading session earlier today modestly above the daily pivot and has traded overall higher over the course of the day with prices currently consolidating above 1.3600.

SC EURUSD 2013.11.29

Daily Pivot Point: 1.35948
— S1 – 1.35719
— S2 – 1.35401
— S3 – 1.35172
— R1 – 1.36266
— R2 – 1.36495
— R3 – 1.36813


Weekly Pivot Points: EURUSD

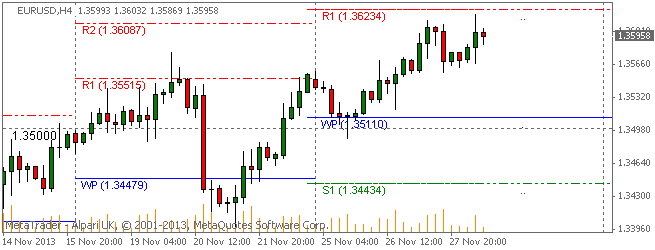
Prices are currently trading above the weekly pivot point on the last trading day of the week. The EURUSD has been on a steady bullish pace this week after opening the trading week above the weekly pivot and has extended its run to the R1 resistance level at 1.3623.

SC EURUSD 2013.11.29

Weekly Pivot Point: 1.35110
— S1 – 1.34434
— S2 – 1.33310
— S3 – 1.32634
— R1 – 1.36234
— R2 – 1.36910
— R3 – 1.38034


By CountingPips.com – Forex Trading Apps & Currency Trade Tools


Disclaimer: Foreign Currency trading and trading on margin carries a high level of risk and volatility and can result in loss of part or all of your investment. All information and opinions contained do not constitute investment advice and accuracy of prices, charts, calculations cannot be guaranteed.


USDCHF Forex Trading Pivot Point Levels for 2013.11.29

2013.11.29 13:30 6:30AM ET | USDCHF Currency Pair

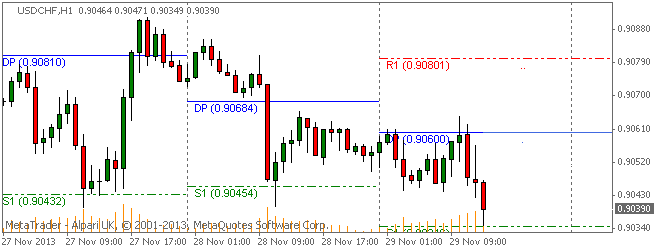
Here are the current Pivot Points Levels with Support (S) and Resistance (R) for the USDCHF currency pair today. Price action is currently trading below the daily pivot point at the 0.90390 price level, according to data at 6:30 AM ET. The
USDCHF high for the day has been 0.90643 while the low of day reached 0.90349. The pair opened the Asian trading session earlier today slightly below the daily pivot and has trended lower over the course of the day with the pair reaching a low right at theĀ  S1 support level today.

SC USDCHF 2013.11.29

Daily Pivot Point: 0.90600
— S1 – 0.90345
— S2 – 0.90145
— S3 – 0.89890
— R1 – 0.90800
— R2 – 0.91055
— R3 – 0.91255


Weekly Pivot Points: USDCHF

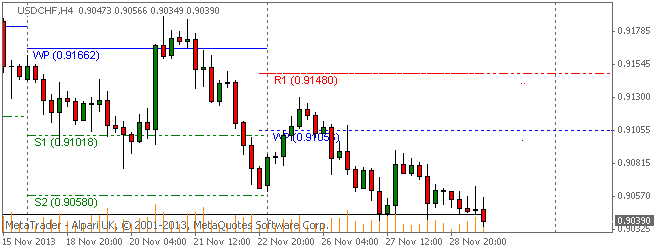
Prices are currently trading under the weekly pivot point on the last day the trading week. The USDCHF has been on a bearish pace this week after opening the trading week below the weekly pivot.

SC USDCHF 2013.11.29

Weekly Pivot Point: 0.91056
— S1 – 0.90208
— S2 – 0.89784
— S3 – 0.88936
— R1 – 0.91480
— R2 – 0.92328
— R3 – 0.92752


By CountingPips.comForex Trading Apps & Currency Trade Tools


Disclaimer: Foreign Currency trading and trading on margin carries a high level of risk and volatility and can result in loss of part or all of your investment. All information and opinions contained do not constitute investment advice and accuracy of prices, charts, calculations cannot be guaranteed.


VIDEO: History: Stock Appetite Rises After Turkey Day

Turkey Day has a way of increasing investors’ appetite for U.S. stocks. In fact, investors tend to gobble up stocks and push prices higher from the end of Thanksgiving week through year’s end, according to data compiled by Bespoke Investment Group. Going back to 1945, the broad Standard & Poor’s 500-stock index has posted has average gains of 1.8%, with positive returns 71% of the time in the period from Thanksgiving to year’s end

VIDEO: Pope Names Private Secretary To Supervise Vatican Bank

Pope Francis named his personal secretary to supervise the activities of the Vatican bank on Thursday, in a sign the pontiff wants to keep a tight grip on the drive to clean up its operations and image. Alfred Xuereb, a 55-year-old Maltese prelate, will be responsible for overseeing two commissions created by the pope to supervise the bank itself and the economic structure and finances of the Holy See, the Vatican said in a statement. Since taking office in March, Francis has moved to tackle years of financial scandals involving the Vatican bank, formally known as the Institute for Works of Religion, which is under investigation on suspicion of money laundering.

USDJPY Daily Forex Fibonacci Levels & Trends Data 2013.11.28

2013.11.28 | USDJPY Market Analysis

USDJPY Trends & Fibonacci Retracement Levels

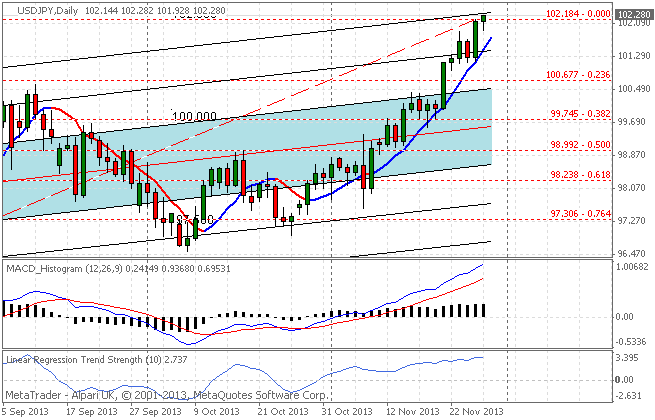
The USDJPY currency pair has been rising sharply in forex market trading in recent days and weeks with the USDJPY registering a high of 102.282 and a low of 101.928 for today. Trends data shows the pair is currently in a short-term uptrend as prices are trading over the 21-period linear short-term moving average. Over the longer term trend, as seen on the chart by the 90 day Linear Regression Channels indicator, the pair continues to be in an uptrend and is currently breaking through the fibonacci retracement cycle high at 102.18.

SC USDJPY 2013.11.28


USDJPY Trends Data: Linear Regression Indicator

10-day current trend is BULLISH / Trend strength of 275.9 pips
30-day current trend is BULLISH / Trend strength of 466.5 pips
60-day current trend is BULLISH / Trend strength of 163.0 pips
90-day current trend is BULLISH / Trend strength of 194.7 pips
180-day current trend is BULLISH / Trend strength of 125.0 pips

Fibonacci Retracement Levels: Past 100 Days

— 0.000 – 102.184
— 0.236 – 100.677
— 0.382 – 99.745
— 0.500 – 98.992
— 0.618 – 98.238
— 0.764 – 97.306
— 1.000 – 95.799


By CountingPips.com – Forex Trading Apps & Currency Trade Tools


Disclaimer: Foreign Currency trading and trading on margin carries a high level of risk and volatility and can result in loss of part or all of your investment. All information and opinions contained do not constitute investment advice and accuracy of prices, charts, calculations cannot be guaranteed.


USDCHF Daily Forex Fibonacci Levels & Trends Data 2013.11.28

2013.11.28 | USDCHF Market Analysis

USDCHF Trends & Fibonacci Retracement Levels

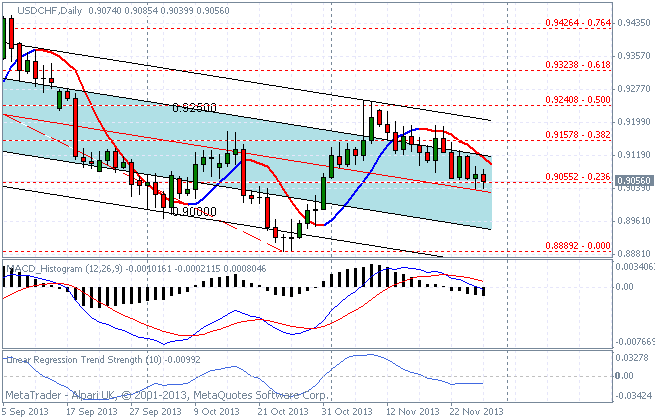
The USDCHF currency pair has been falling in forex market trading today with the USDCHF registering a high of 0.90854 and a low of 0.90399 on the day. Trends data shows the pair is currently in a short-term downtrend as prices are trading under the short-term 21 period linear moving average. Over the longer term trend, as seen on the chart by the 90 day Linear Regression Channels indicator, the pair continues to be in a downtrend with prices trading at the 23.6% fibonacci retracement level of the pullback from 0.8889 low.

SC USDCHF 2013.11.28


USDCHF Trends Data: Linear Regression Indicator

10-day current trend is BEARISH / Trend strength of -109.2 pips
30-day current trend is BULLISH / Trend strength of 173.2 pips
60-day current trend is BEARISH / Trend strength of -154.5 pips
90-day current trend is BEARISH / Trend strength of -275.1 pips
180-day current trend is BEARISH / Trend strength of -473.5 pips

Fibonacci Retracement Levels: Past 100 Days

— 0.000 – 0.88892
— 0.236 – 0.90552
— 0.382 – 0.91578
— 0.500 – 0.92408
— 0.618 – 0.93238
— 0.764 – 0.94264
— 1.000 – 0.95924


By CountingPips.com – Forex Trading Apps & Currency Trade Tools


Disclaimer: Foreign Currency trading and trading on margin carries a high level of risk and volatility and can result in loss of part or all of your investment. All information and opinions contained do not constitute investment advice and accuracy of prices, charts, calculations cannot be guaranteed.


USDCAD pulls back from new cycle high at 1.0600

2013.11.28 | USDCAD Market Analysis

USDCAD Trends & Fibonacci Retracement Levels

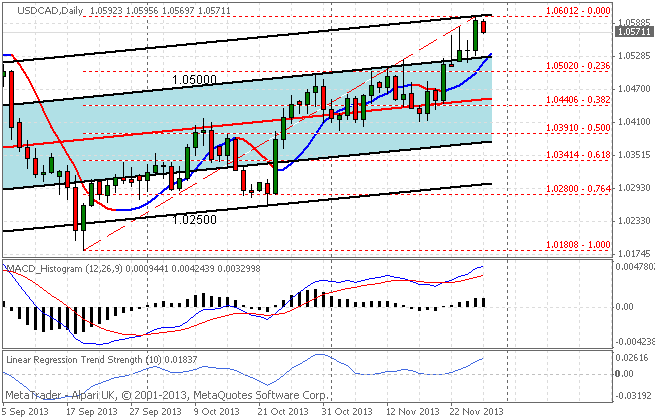
The USDCAD currency pair has been declining in forex market trading today with the USDCAD registering a high of 1.05956 and a low of 1.05697 on the day. Trends data shows the pair is currently in a short-term uptrend with pricesĀ  trading over the 21 period linear short-term moving average. Over the longer term trend, as seen on the chart by the 90 day Linear Regression Channels, the pair continues to be in an uptrend that established a new fibonacci retracement cycle high at 1.0601 level on Wednesday.

SC USDCAD 2013.11.28


USDCAD Trends Data: Linear Regression Indicator

10-day current trend is BULLISH / Trend strength of 172.0 pips
30-day current trend is BULLISH / Trend strength of 217.9 pips
60-day current trend is BULLISH / Trend strength of 224.7 pips
90-day current trend is BULLISH / Trend strength of 126.1 pips
180-day current trend is BULLISH / Trend strength of 297.8 pips

Fibonacci Retracement Levels: Past 100 Days

— 0.000 – 1.06012
— 0.236 – 1.05020
— 0.382 – 1.04406
— 0.500 – 1.03910
— 0.618 – 1.03414
— 0.764 – 1.02800
— 1.000 – 1.01808


By CountingPips.com – Forex Trading Apps & Currency Trade Tools


Disclaimer: Foreign Currency trading and trading on margin carries a high level of risk and volatility and can result in loss of part or all of your investment. All information and opinions contained do not constitute investment advice and accuracy of prices, charts, calculations cannot be guaranteed.


EURUSD Forex Trading Pivot Point Levels for 2013.11.28

2013.11.28 13:30 6:30AM ET | EURUSD Currency Pair

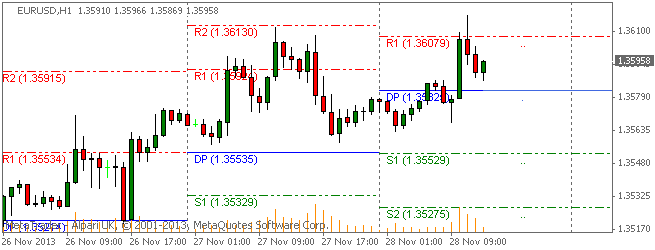
Here are the current Pivot Points Levels with Support (S) and Resistance (R) for the EURUSD currency pair today. Price action is currently trading over the daily pivot point at the 1.35958 price level, according to data at 6:30 AM ET. The
EURUSD high for the day has been 1.36178 while the low of day reached to 1.35631. The pair opened the Asian trading session earlier today below the daily pivot and has trended higher over the course of the day and found resistance above the R1 level.

SC EURUSD 2013.11.28

Daily Pivot Point: 1.35825
— S1 – 1.35529
— S2 – 1.35275
— S3 – 1.34979
— R1 – 1.36079
— R2 – 1.36375
— R3 – 1.36629


Weekly Pivot Points: EURUSD

Prices are currently trading over the weekly pivot point at time of writing. The EURUSD has been on a bullish pace this week after opening the trading week above the weekly pivot. The pair dipped earlier in the week finding support at the 1.3500 level and pivot area before starting on a bullish path higher.

SC EURUSD 2013.11.28

Weekly Pivot Point: 1.35110
— S1 – 1.34434
— S2 – 1.33310
— S3 – 1.32634
— R1 – 1.36234
— R2 – 1.36910
— R3 – 1.38034


By CountingPips.comForex Trading Apps & Currency Trade Tools


Disclaimer: Foreign Currency trading and trading on margin carries a high level of risk and volatility and can result in loss of part or all of your investment. All information and opinions contained do not constitute investment advice and accuracy of prices, charts, calculations cannot be guaranteed.