VIX Futures Speculators decreased bearish bets for 1st time since October

By CountingPips.com

Weekly CFTC Net Speculator Report


vix


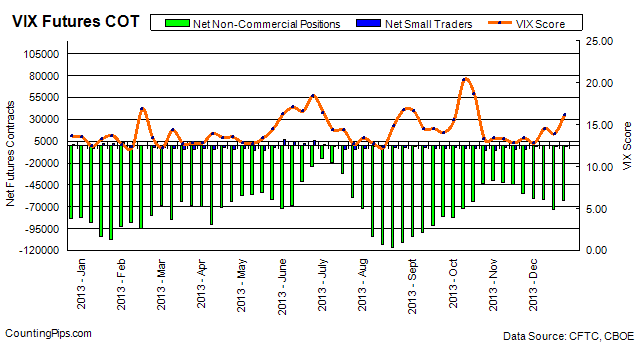
VIX Futures Contracts: Large traders and speculators pulled back on their bearish positions in the VIX futures market on December 17th, according to the latest data from the Commodity Futures Trading Commission (CFTC) released on Friday. The VIX non-commercial contracts, traded usually by large speculators and hedge funds, saw a total net position of -62,637 contracts in the data reported for December 17th. This was a change of +10,695 contracts from the previous week’s total of -73,332 net contracts on December 10th. Speculators had raised their bearish bets for the previous six weeks and December 17th was the first decrease in bearish bets since October 29th.

Meanwhile, the VIX index, also known as the fear index, rose from 13.91 on Tuesday December 10th to 16.21 on Tuesday December 17th, according to the Chicago Board Options Exchange (CBOE) Volatility Index.


Last 6 Weeks of Large Trader Positions

DateNet Non-CommericalsChangeVIX Score
11/12/2013-44525-261712.82
11/19/2013-54855-1033013.39
11/26/2013-60024-516912.81
12/03/2013-62050-202614.55
12/10/2013-73332-1128213.91
12/17/2013-626371069516.21


*COT Report: The weekly commitment of traders report summarizes the total trader positions for open contracts in the futures trading markets. The CFTC categorizes trader positions according to commercial hedgers (traders who use futures contracts for hedging as part of the business), non-commercials (large traders who speculate to realize trading profits) and nonreportable traders (usually small traders/speculators). Find CFTC criteria here: (http://www.cftc.gov/MarketReports/CommitmentsofTraders/ExplanatoryNotes/index.htm).


Article by CountingPips.comForex News & Analysis


VIDEO: Voters In Madagascar Want End To Crisis Sparked By Coup

Madagascar’s voters cast ballots on Friday in a run-off presidential election, but many expect old political rifts to persist and see no quick fix for their battered economy after a coup five years ago drove away investors and donors. Voters have a choice between a former finance minister backed by outgoing President Andry Rajoelina, the disc jockey-turned-statesman whom the army helped to power in 2009, and an ally of Marc Ravalomanana, the leader who was ousted in the coup.

Forex Pivot Point Levels: EURUSD trades lower to 1.3650 level

2013.12.20 13:30 6:30AM ET | EURUSD Currency Pair

SC EURUSD 2013.12.20

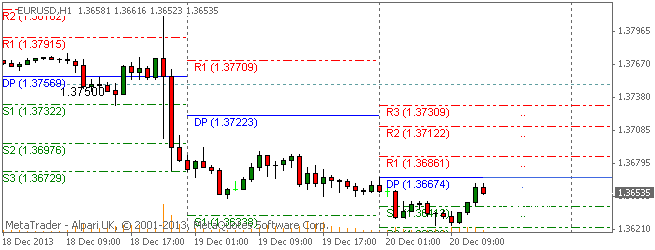
Here are the Pivot Points Levels with Support (S) and Resistance (R) for the EURUSD currency pair today. Price action is currently trading under the daily pivot point at the 1.36535 price level, according to data at 6:30 AM ET. The EURUSD high for the day has been 1.36669 while the low of day reached to 1.36246. The pair earlier today opened the Asian trading session just below the daily pivot and has trended lower over the course of the day with support for the pair found at the R2 and then the R1 level.

Daily Pivot Point: 1.36674
— S1 – 1.36414
— S2 – 1.36226
— S3 – 1.35966
— R1 – 1.36862
— R2 – 1.37122
— R3 – 1.37310


Weekly Pivot Points: EURUSD

SC EURUSD 2013.12.20

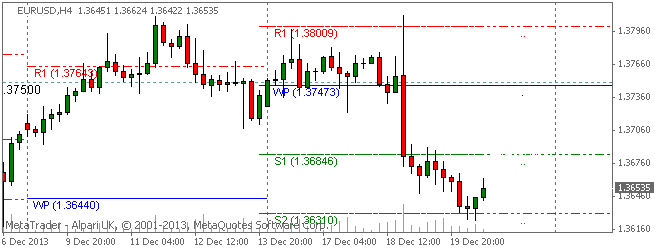
Prices are currently trading under the weekly pivot point after opening the trading week slightly below the weekly pivot. The EURUSD has been on an overall bearish trend this week following the US Fed decision to taper stimulus. The EURUSD has declined to the S2 support level under 1.3650 after seeing prices top out the week above 1.3800.

Weekly Pivot Point: 1.37473
— S1 – 1.36846
— S2 – 1.36310
— S3 – 1.35683
— R1 – 1.38009
— R2 – 1.38636
— R3 – 1.39172


By CountingPips.com – Forex Trading Apps & Currency Trade Tools


Disclaimer: Foreign Currency trading and trading on margin carries a high level of risk and volatility and can result in loss of part or all of your investment. All information and opinions contained do not constitute investment advice and accuracy of prices, charts, calculations cannot be guaranteed.


Forex Trading: Bullish Action brings USDJPY above 104.50

2013.12.20 13:30 6:30AM ET | USDJPY Currency Pair

SC USDJPY 2013.12.20

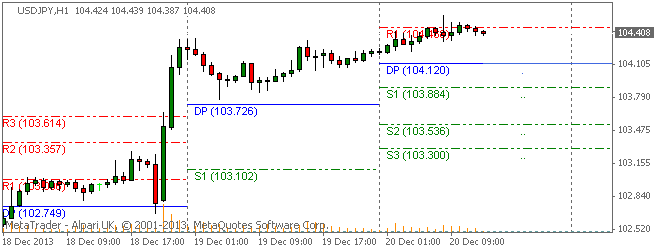
Here are the Pivot Points Levels with Support (S) and Resistance (R) for the USDJPY currency pair today. Price action is currently trading over the daily pivot point at the 104.408 price level, according to data at 6:30 AM ET. The USDJPY high for the day has been 104.583 while the low of day reached to 104.204. The pair earlier today opened the Asian trading session above the daily pivot on Friday and has trended higher over the course of the day with prices finding resistance in the R1 resistance area around 104.46.

Daily Pivot Point: 104.120
— S1 – 103.885
— S2 – 103.536
— S3 – 103.301
— R1 – 104.469
— R2 – 104.704
— R3 – 105.053


Weekly Pivot Points: USDJPY

SC USDJPY 2013.12.20

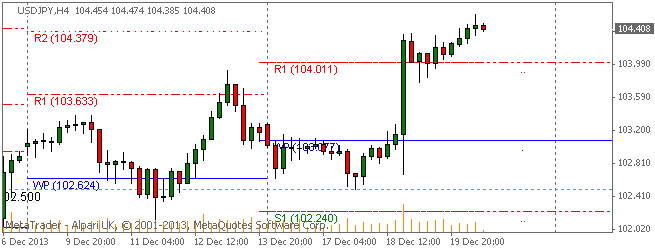
Prices are currently trading well over the weekly pivot point after opening the trading week slightly above the weekly pivot. The USDJPY has been on an overall bullish trend this week after the US Federal Reserve decision to taper their stimulus program and the US dollar strength has pushed the USDJPY to touch the 104.50 level this week.

Weekly Pivot Point: 103.077
— S1 – 102.241
— S2 – 101.306
— S3 – 100.470
— R1 – 104.012
— R2 – 104.848
— R3 – 105.783


By CountingPips.com – Forex Trading Apps & Currency Trade Tools


Disclaimer: Foreign Currency trading and trading on margin carries a high level of risk and volatility and can result in loss of part or all of your investment. All information and opinions contained do not constitute investment advice and accuracy of prices, charts, calculations cannot be guaranteed.


USDCHF Forex Trading Pivot Point Levels for 2013.12.20

2013.12.20 13:30 6:30AM ET | USDCHF Currency Pair

SC USDCHF 2013.12.20

Here are the Pivot Points Levels with Support (S) and Resistance (R) for the USDCHF currency pair today. Price action is currently trading slightly over the daily pivot point at the 0.89779 price level, according to data at 6:30 AM ET. The USDCHF high for the day has been 0.90003 while the low of day reached to 0.89726. The pair earlier today opened the Asian trading session above the daily pivot and trended higher to the R1 level where resistance was found before falling towards the pivot.

Daily Pivot Point: 0.89661
— S1 – 0.89462
— S2 – 0.89141
— S3 – 0.88942
— R1 – 0.89982
— R2 – 0.90181
— R3 – 0.90502


Weekly Pivot Points: USDCHF

SC USDCHF 2013.12.20

Prices are trading sharply higher than the weekly pivot point and currently trade at the R2 resistance level. The USDCHF has been on an overall bullish trend this week after opening the trading week slightly above the weekly pivot.

Weekly Pivot Point: 0.88885
— S1 – 0.88435
— S2 – 0.87938
— S3 – 0.87488
— R1 – 0.89382
— R2 – 0.89832
— R3 – 0.90329


By CountingPips.com – Forex Trading Apps & Currency Trade Tools


Disclaimer: Foreign Currency trading and trading on margin carries a high level of risk and volatility and can result in loss of part or all of your investment. All information and opinions contained do not constitute investment advice and accuracy of prices, charts, calculations cannot be guaranteed.


EURUSD Forex Uptrend dealt a blow by Fed Tapering

2013.12.19 | EURUSD Trends & Major Market Levels Analysis

Forex Trends Trading EURUSD 2013.12.19

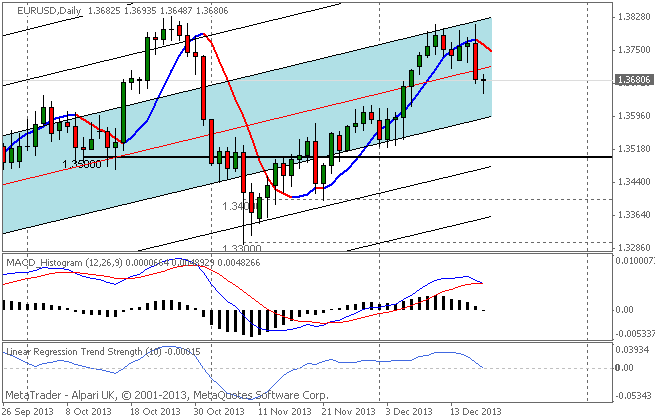
The EURUSD currency pair has been falling slightly in forex market trading today after a sharp decline in trading on Wednesday. The EURUSD has reached a high of 1.36935 today while marking a low point of 1.36487 so far on the day. Trends data shows the pair has crossed over into a short-term downtrend with prices trading under the 21-period linear moving average. Over the longer term trend, the pair continues to be in an uptrend as seen on the daily chart by the 90-day Linear Regression Channels below.

The EURUSD pair was brought below the 1.3700 level in Wednesday’s trading following the US Fed decision to pullback slightly or taper their monthly stimulus program.  This news was positive for the US dollar against the other major currencies in the short-term. Going forward for the EURUSD, watch for near term resistance at the 1.3700 major level while support will likely be seen at the 1.3650 level and then the 1.3600 area looming below.


EURUSD Trends Data: Linear Regression Indicator

10-day current trend is BULLISH / Trend strength of 2.6 pips
30-day current trend is BULLISH / Trend strength of 394.2 pips
60-day current trend is BULLISH / Trend strength of 101.8 pips
90-day current trend is BULLISH / Trend strength of 405.6 pips
180-day current trend is BULLISH / Trend strength of 769.6 pips

Fibonacci Retracement Levels: Past 100 Days

— 0.000 – 1.38317
— 0.236 – 1.36600
— 0.382 – 1.35537
— 0.500 – 1.34679
— 0.618 – 1.33820
— 0.764 – 1.32757
— 1.000 – 1.31040


By CountingPips.com – Forex Trading Apps & Currency Trade Tools


Disclaimer: Foreign Currency trading and trading on margin carries a high level of risk and volatility and can result in loss of part or all of your investment. All information and opinions contained do not constitute investment advice and accuracy of prices, charts, calculations cannot be guaranteed.


USDCAD Daily Forex Trend boosted by Fed Tapering Decision

2013.12.19 | USDCAD Market Analysis

USDCAD Trends & Major Market Levels

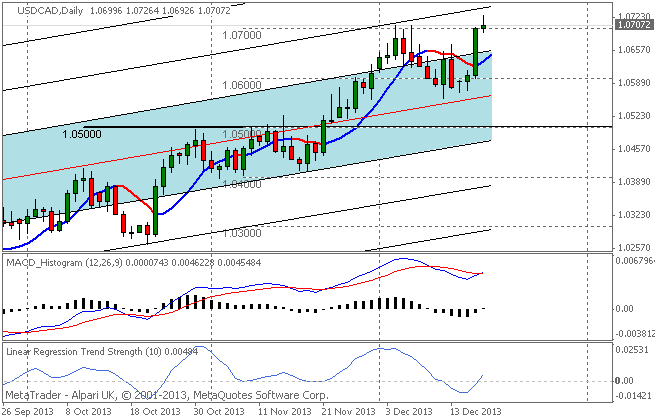
The USDCAD currency pair has been gaining ground in forex market trading today with the USDCAD registering a high of 1.07264 and reaching to a low of 1.06926 on the day. Trends data shows the pair is currently in a short-term uptrend with prices trading over the 21-period linear moving average. Over the longer term trend, the pair continues to be in an uptrend as seen on the daily chart by the 90-day Linear Regression Channels below. The USDCAD pair was boosted in Wednesday’s trading following the US Fed announcement to taper their stimulus program. Look for the 1.0700 level to provide a strong support and resistance area going forward.

Forex Trends Trading USDCAD 2013.12.19


USDCAD Trends Data: Linear Regression Indicator

10-day current trend is BULLISH / Trend strength of 46.3 pips
30-day current trend is BULLISH / Trend strength of 247.5 pips
60-day current trend is BULLISH / Trend strength of 390.7 pips
90-day current trend is BULLISH / Trend strength of 249.2 pips
180-day current trend is BULLISH / Trend strength of 351.9 pips

Fibonacci Retracement Levels: Past 100 Days

— 0.000 – 1.07067
— 0.236 – 1.05826
— 0.382 – 1.05058
— 0.500 – 1.04438
— 0.618 – 1.03817
— 0.764 – 1.03049
— 1.000 – 1.01808


By CountingPips.com – Forex Trading Apps & Currency Trade Tools


Disclaimer: Foreign Currency trading and trading on margin carries a high level of risk and volatility and can result in loss of part or all of your investment. All information and opinions contained do not constitute investment advice and accuracy of prices, charts, calculations cannot be guaranteed.


USDJPY Forex Trading Pivot Point Levels for 2013.12.19

2013.12.19 13:30 6:30AM ET | USDJPY Currency Pair

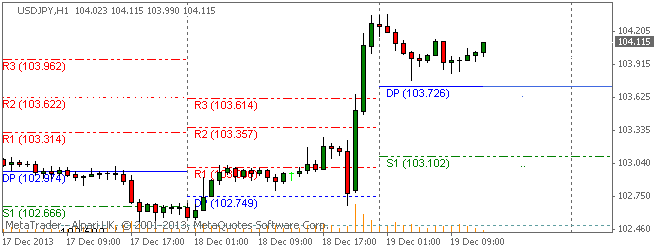
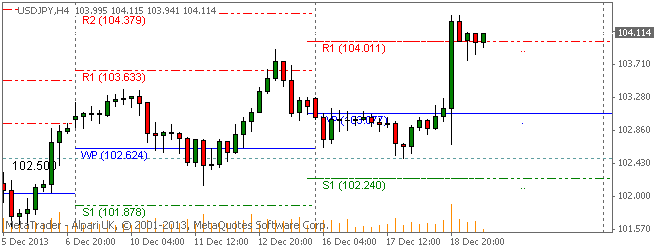
Here are the Pivot Points Levels with Support (S) and Resistance (R) for the USDJPY currency pair today. Price action is currently trading over the daily pivot point at the 104.115 price level, according to data at 6:30 AM ET. The USDJPY high for the day has been 104.356 while the low of day reached to 103.772. The pair earlier today opened the Asian trading session above the daily pivot and has trended slightly lower over the course of the day.

SC USDJPY 2013.12.19

Daily Pivot Point: 103.726
— S1 – 103.102
— S2 – 101.930
— S3 – 101.306
— R1 – 104.898
— R2 – 105.522
— R3 – 106.694


Weekly Pivot Points: USDJPY

Prices are currently trading over the weekly pivot point and above the R1 resistance level at time of writing. The USDJPY has been on an overall bullish trend this week after getting a boost from yesterday’s US Fed tapering decision.

SC USDJPY 2013.12.19

Weekly Pivot Point: 103.077
— S1 – 102.241
— S2 – 101.306
— S3 – 100.470
— R1 – 104.012
— R2 – 104.848
— R3 – 105.783


By CountingPips.comForex Trading Apps & Currency Trade Tools


Disclaimer: Foreign Currency trading and trading on margin carries a high level of risk and volatility and can result in loss of part or all of your investment. All information and opinions contained do not constitute investment advice and accuracy of prices, charts, calculations cannot be guaranteed.


USDCHF Forex Trading Pivot Point Levels for 2013.12.19

2013.12.19 13:30 6:30AM ET | USDCHF Currency Pair

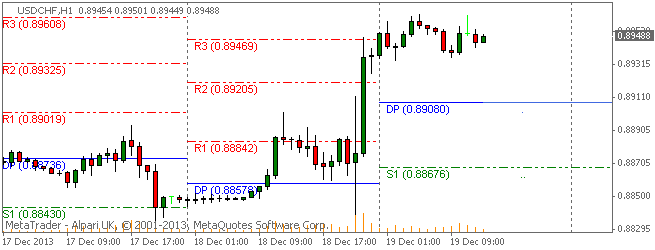
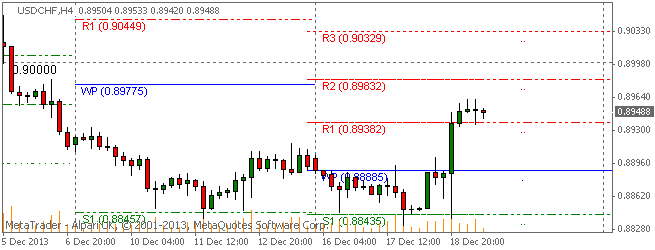
Here are the Pivot Points Levels with Support (S) and Resistance (R) for the USDCHF currency pair today. Price action is currently trading well over the daily pivot point at the 0.89488 price level, according to data at 6:30 AM ET. The USDCHF high for the day has been 0.89623 while the low of day reached to 0.89339. The pair earlier today opened the Asian trading session above the daily pivot and has trended mainly sideways from the open of the day.

SC USDCHF 2013.12.19

Daily Pivot Point: 0.89080
— S1 – 0.88676
— S2 – 0.87983
— S3 – 0.87579
— R1 – 0.89773
— R2 – 0.90177
— R3 – 0.90870


Weekly Pivot Points: USDCHF

Prices are currently trading over the weekly pivot point and above the R1 level at time of writing. The USDCHF has been on an overall bullish trend this week after opening the trading week slightly above the weekly pivot.

SC USDCHF 2013.12.19

Weekly Pivot Point: 0.88885
— S1 – 0.88435
— S2 – 0.87938
— S3 – 0.87488
— R1 – 0.89382
— R2 – 0.89832
— R3 – 0.90329


By CountingPips.com – Forex Trading Apps & Currency Trade Tools


Disclaimer: Foreign Currency trading and trading on margin carries a high level of risk and volatility and can result in loss of part or all of your investment. All information and opinions contained do not constitute investment advice and accuracy of prices, charts, calculations cannot be guaranteed.


EURUSD Forex Trading Pivot Point Levels for 2013.12.19

2013.12.19 13:30 6:30AM ET | EURUSD Currency Pair

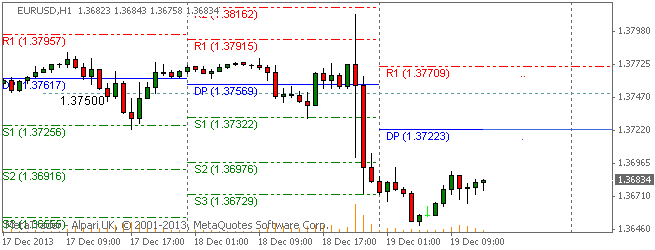
Here are the Pivot Points Levels with Support (S) and Resistance (R) for the EURUSD currency pair today. Price action is currently trading under the daily pivot point at the 1.36834 price level, according to data at 6:30 AM ET. The EURUSD high for the day has been 1.36935 while the low of day reached to 1.36487. The pair earlier today opened the Asian trading session below the daily pivot and has traded sideways over the course of the day.

SC EURUSD 2013.12.19

Daily Pivot Point: 1.37223
— S1 – 1.36339
— S2 – 1.35852
— S3 – 1.34968
— R1 – 1.37710
— R2 – 1.38594
— R3 – 1.39081


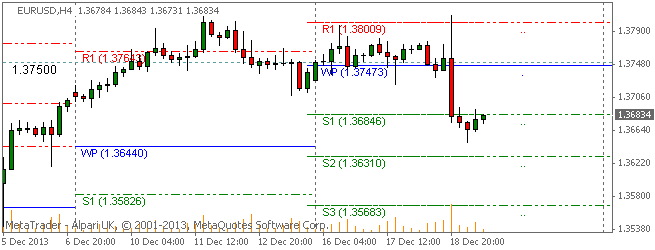
Weekly Pivot Points: EURUSD

Prices are currently trading under the weekly pivot point at time of writing. The EURUSD is on an overall bearish trend this week after yesterday’s US Federal Reserve tapering decision with prices at the S1 level.

SC EURUSD 2013.12.19

Weekly Pivot Point: 1.37473
— S1 – 1.36846
— S2 – 1.36310
— S3 – 1.35683
— R1 – 1.38009
— R2 – 1.38636
— R3 – 1.39172


By CountingPips.com – Forex Trading Apps & Currency Trade Tools


Disclaimer: Foreign Currency trading and trading on margin carries a high level of risk and volatility and can result in loss of part or all of your investment. All information and opinions contained do not constitute investment advice and accuracy of prices, charts, calculations cannot be guaranteed.