If you’re investing in the hopes to get rich quick, it’s time to reconsider.
The truth is, 9.9 times out of 10, real wealth – the kind that allows generations of families to live like kings and queens – is built slowly over time.
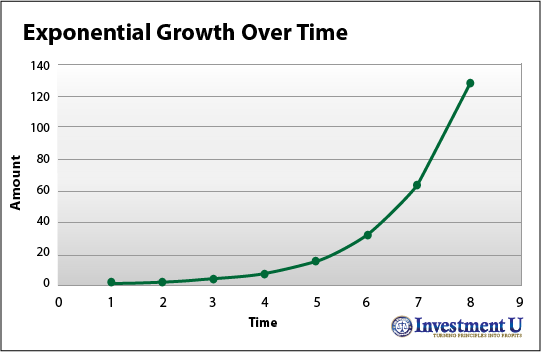
One chart can easily show how it pays to invest for the long term. It’s called an exponential growth chart, or “hockey stick” chart:
And understanding this chart should completely change the way you think about investing for the future.
Investing for the Long Haul
According to Dr. Chris Martenson, a former Fortune 300 executive, “Anything that steadily increases in size as a proportion of its current size” will give you “a chart that looks like… a hockey stick.”
In other words, as long as you can average more growth than not in your investment portfolio, you will experience exponential growth over time.
For investors, it’s easy to see why this kind of growth is a great thing.
Turning $10,000 into $1 Million
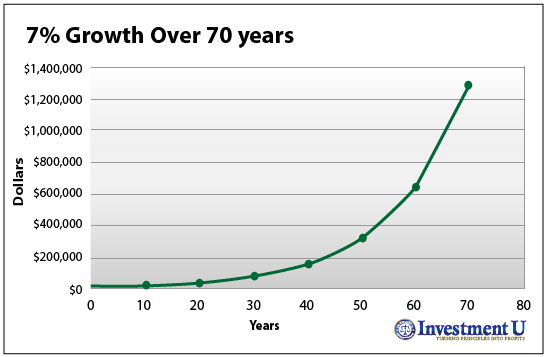
Let’s say you’re 25 years old and you only have $10,000 to invest with. You average just around 7% growth annually in your investment portfolio.
Thanks to compounding growth, at 7% growth, you’d double your portfolio every 10 years.
That means, after 10 years, your portfolio would total $20,000. After 30 years, it would be $40,000. After 40 years, it would be $80,000. And so on.
Over the course of your investment career, here’s what your portfolio would look like simply averaging 7% growth per year:

It’s important to realize what happens after 40 years of growing $10,000 at 7% per year. Although it takes 40 years to grow your portfolio to just $180,000, it takes just little more than 25 years to earn the remaining $820,000.
This compounding effect is why it’s so important to invest for the long haul. And it should help you make better investment decisions for the rest of your life.
Good Investing,
Mike Kapsch
Article by Investment U
