If the truth be known, all retail forex traders are speculators, and speculating is all about effectively picking your entry and exit points in a volatile and fast-paced market. Larger, more capitalized competitors are geared to squeeze every last “pip” out of a pricing move, creating an environment where what appears to be an excellent arbitrage opportunity at one point can vanish in an instant. Using the best tools available, coupled with a decisive and disciplined decision making demeanor, becomes paramount for any individual attempting to survive and thrive in this complex profession.
One of the earliest concepts taught to aspiring traders is that prices can create various support and resistance levels as they seek the balanced view of market forces. At some point a breakout or reversal will occur from this pattern when one of the opposing forces in the scenario gains the upper hand and dictates the direction of future movements. It is the trader’s primary objective to anticipate the timing and direction of these changes, and the tools designated best for this process form a class called oscillators.
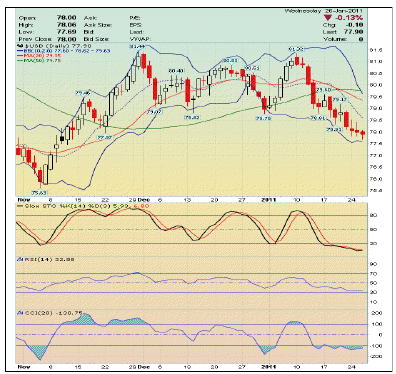
Oscillators were designed with one purpose in mind, to signal the presence of overbought and oversold conditions in a market. The chart below depicts AUD USD with three of the most popular oscillators in use today in the forex and other trading markets:
The concept of Stochastics (“STO”), the first of the three indicators above and the “Slow” version, was developed by George Lane who observed that, as markets get overbought, the closing prices tend towards the daily highs, and vice-versa for oversold conditions. The indicator consists of two lines, “%K” and “%D”, that “oscillate” between an upper and lower limit, as do the other indicators shown here, to produce their various trading signals. These signals may occur before a price actually demonstrates a peak or valley, necessitating some interpretation by the trader. Line intersections may aid in this process, as does the use of another indicator. There are “slow” and “fast” versions of this oscillator, but traders favor the “slow” version as being more accurate.
The Relative Strength Index (“RSI”) is also a popular oscillator that is generally presented on most common forex commentary charts and in trading tutorials presented by forex brokers. It was developed by Welles Wilder, and is based on measuring the relative differences between lower and higher closing prices. Its developer believed that the strength of the RSI rested in its ability to diverge in direction from the price of the underlying currency or security.
The Commodity Channel Index (“CCI”) owes its origination and design to Donald Lambert. The mathematical foundation of this oscillator deals with the mean price of the currency and the difference of that figure from the average of mean prices over a pre-set period of time. Once again, overbought and oversold conditions are generated when the indicator crosses over upper and lower boundary limits.
By visually comparing each oscillator in the chart, each one produces its own “flavor” of signal for the trader to interpret at varying degrees of strength and velocity. Typically, a trader would have recognized the “triple-top” formation and related support and resistance levels in the latter half of the above pricing behavior. Anticipating the actual downward reversal that ensued would have come from his experience with the oscillator of his choice and his ability to interpret the messages presented.
Traders need every edge that they can find to win in the risky forex market. Gauging pricing momentum with an appropriate oscillator is one way to achieve this objective.
Article courtesy of forextraders.com
