Looks like heavy promotional activity like big discounts spurred shopping traffic last year and many people have been using credit cards. I’m most likely sure you’re one of them my friend! The more credit cards being used, the more profits credit card companies make. Consumer spending increased during the holidays to buy gifts or whatever is needed for Christmas. More shopping means more chances of using credit cards. Given the fact that unemployment claims have been settling since mid of 2009, credit card companies have a better reason to offer credit cards to consumers because if more people have jobs, more people make money. Thus, people have better spending ability and if they use credit cards, they can most likely pay it off with their salary. Since American Express Company (AXP) is one of the biggest credit/charge card company out there, it sure gets a big piece of the “credit card spending” pie. As a result, traders are speculating on an outstanding 2010 4th quarter net earnings for American Express this coming January 24 which has been causing its stocks to move higher for the past two weeks.
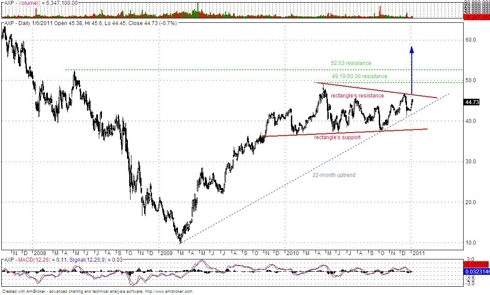
On my last post on American Express (kindly check here), it seemed there was a head and shoulders formation and the stocks were bound to drop. What looked like a bearish formation could actually be a consolidation process of an area pattern which is the rectangle (could be a triangle for others). Since I’m biased with the uptrend, this rectangle is more likely bullish. In case the stocks breakout above the rectangle’s resistance, I see an upside target of 58.00 USD which is almost a 30% gain from the current value of 44.73 USD. I got my target price by measuring the size of the base of the rectangle then added it to the possible breakout point. This could end the 1-year sideway consolidation of the stocks. However, along its possible rise, AXP could encounter some selling pressure at 49.19-50.00 and 52.63 resistances. On the flip side, the immediate support could be the 22-month uptrend. If that gets broken, the next level could be the rectangle’s support.
More on LaidTrades.com …