Early in the year, Democrats in the House and Senate tapped their donors for a fast fundraising start for the elections in November. However, as Jerry Seib explains, the party still faces significant election challenges in dealing with the president’s sinking poll numbers. Photo: Associated Press
GBPUSD slightly higher in Forex Trading today after starting week lower
2014.02.04 13:30 6:30AM ET | GBPUSD Currency Pair
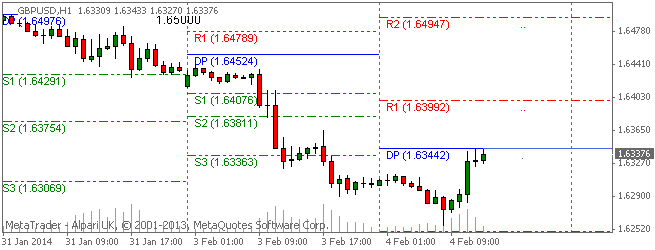
Here are the Pivot Points Levels with Support (S) and Resistance (R) for the GBPUSD currency pair today. Price action is currently trading at the 1.63376 price level and just under the daily pivot point, according to data at 6:30 AM ET. The GBPUSD high for the day has been 1.63433 while the low of day has reached to 1.62559. The pair earlier today opened the Asian trading session below the daily pivot and has trended higher with the daily pivot acting as the main barrier of resistance so far.
Daily Pivot Point: 1.63442
— S1 – 1.62487
— S2 – 1.61937
— S3 – 1.60982
— R1 – 1.63992
— R2 – 1.64947
— R3 – 1.65497
Weekly Pivot Points: GBPUSD
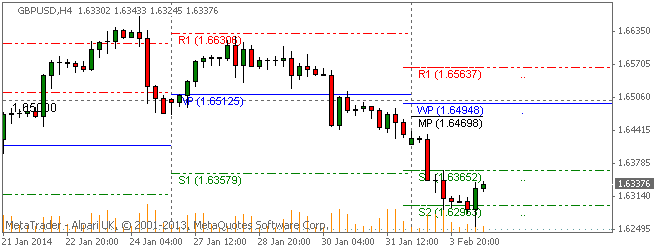
Prices are currently trading under the weekly pivot point and below the S1 support level at time of writing. The GBPUSD has been on an overall bearish trend this week after opening the trading week below the weekly pivot.
Weekly Pivot Point: 1.64948
— S1 – 1.63652
— S2 – 1.62963
— S3 – 1.61667
— R1 – 1.65637
— R2 – 1.66933
— R3 – 1.67622
By CountingPips.com – Forex Trading Apps & Currency Trade Tools
Disclaimer: Foreign Currency trading and trading on margin carries a high level of risk and volatility and can result in loss of part or all of your investment. All information and opinions contained do not constitute investment advice and accuracy of prices, charts, calculations cannot be guaranteed.
USDJPY finds some support and trades over 101 in Forex Trading
2014.02.04 13:30 6:30AM ET | USDJPY Currency Pair
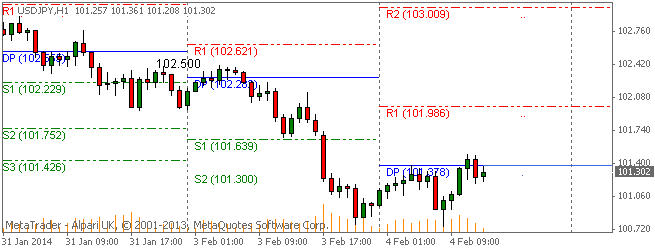
Here are the Pivot Points Levels with Support (S) and Resistance (R) for the USDJPY currency pair today. Price action is currently trading at the 101.302 price level and just under the daily pivot point, according to data at 6:30 AM ET. The USDJPY high for the day has been 101.491 while the low of day has reached to 100.747. The pair earlier today opened the Asian trading session below the daily pivot and has trended higher although with resistance being found at the daily pivot.
Daily Pivot Point: 101.378
— S1 – 100.354
— S2 – 99.747
— S3 – 98.723
— R1 – 101.985
— R2 – 103.009
— R3 – 103.616
Weekly Pivot Points: USDJPY
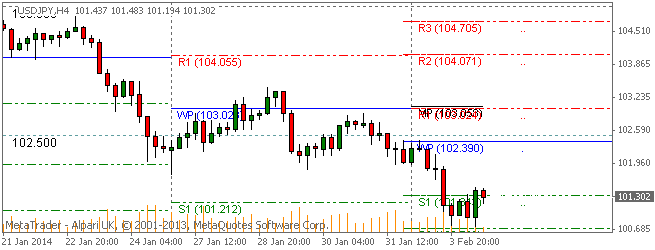
Prices are currently trading under the weekly and monthly pivot points at time of writing. The USDJPY has been on an overall bearish trend this week after opening the trading week slightly below the weekly pivot.
Weekly Pivot Point: 102.390
— S1 – 101.344
— S2 – 100.709
— S3 – 99.663
— R1 – 103.025
— R2 – 104.071
— R3 – 104.706
By CountingPips.com – Forex Trading Apps & Currency Trade Tools
Disclaimer: Foreign Currency trading and trading on margin carries a high level of risk and volatility and can result in loss of part or all of your investment. All information and opinions contained do not constitute investment advice and accuracy of prices, charts, calculations cannot be guaranteed.
USDCHF bounces higher off of the 0.9000 level in Forex Trading
2014.02.04 13:30 6:30AM ET | USDCHF Currency Pair
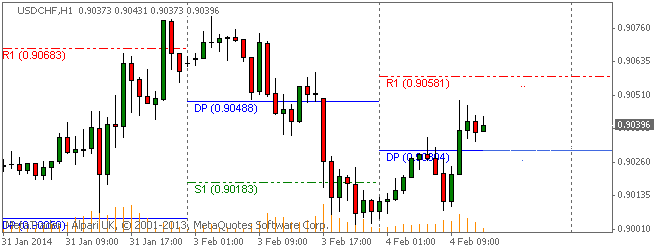
Here are the Pivot Points Levels with Support (S) and Resistance (R) for the USDCHF currency pair today. Price action is currently trading over the daily pivot point at the 0.90396 price level, according to data at 6:30 AM ET. The USDCHF high for the day has been 0.90492 while the low of day has reached to 0.90051. The pair earlier today opened the Asian trading session below the daily pivot and has trended higher over the course of the day with buying support being found just above the major 0.9000 level.
Daily Pivot Point: 0.90304
— S1 – 0.89800
— S2 – 0.89524
— S3 – 0.89020
— R1 – 0.90580
— R2 – 0.91084
— R3 – 0.91360
Weekly Pivot Points: USDCHF
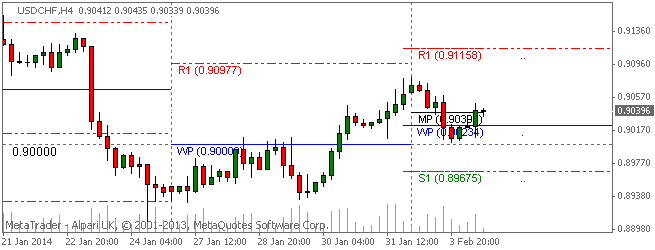
Prices are currently trading over the weekly pivot point and basically on top of the monthly pivot at time of writing. The USDCHF has been on an overall bearish trend so far this week after opening the trading week above the weekly pivot.
Weekly Pivot Point: 0.90234
— S1 – 0.89674
— S2 – 0.88751
— S3 – 0.88191
— R1 – 0.91157
— R2 – 0.91717
— R3 – 0.92640
By CountingPips.com – Forex Trading Apps & Currency Trade Tools
Disclaimer: Foreign Currency trading and trading on margin carries a high level of risk and volatility and can result in loss of part or all of your investment. All information and opinions contained do not constitute investment advice and accuracy of prices, charts, calculations cannot be guaranteed.
EURUSD continues to tread above 1.3500 in Forex Market Trading
2014.02.04 13:30 6:30AM ET | EURUSD Currency Pair
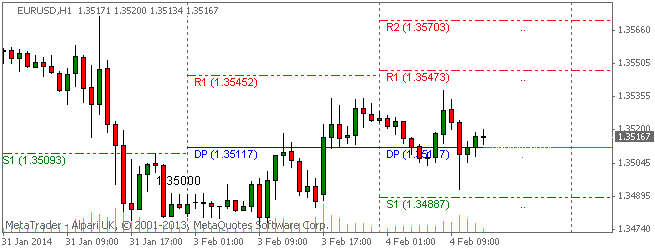
Here are the Pivot Points Levels with Support (S) and Resistance (R) for the EURUSD currency pair today. Price action is currently trading at the 1.35167 price level and slightly over the daily pivot point, according to data at 6:30 AM ET. The EURUSD high for the day has been 1.35382 while the low of day has reached to 1.34926. The pair earlier today opened the Asian trading session below the daily pivot and has trended a bit lower to the main pivot point.
Daily Pivot Point: 1.35117
— S1 – 1.34886
— S2 – 1.34531
— S3 – 1.34300
— R1 – 1.35472
— R2 – 1.35703
— R3 – 1.36058
Weekly Pivot Points: EURUSD
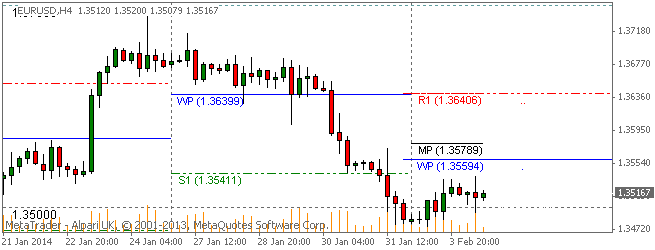
Prices are currently trading under the weekly and monthly pivot points at time of writing. The EURUSD has been on a slightly bullish trend this week after opening the trading week below the weekly pivot.
Weekly Pivot Point: 1.35594
— S1 – 1.34029
— S2 – 1.33217
— S3 – 1.31652
— R1 – 1.36406
— R2 – 1.37971
— R3 – 1.38783
By CountingPips.com – Forex Trading Apps & Currency Trade Tools
Disclaimer: Foreign Currency trading and trading on margin carries a high level of risk and volatility and can result in loss of part or all of your investment. All information and opinions contained do not constitute investment advice and accuracy of prices, charts, calculations cannot be guaranteed.
VIDEO: Concern Over Bitcoin Vulnerability Spreads Worldwide
Regulators and banks are escalating warnings against bitcoin and other digital currencies amid concern such software lends itself to financial crime. Bitcoin enthusiasts suffered a blow last week when it emerged Charlie Shrem, head of a New York bitcoin exchange, was charged with attempting to sell bitcoins to narcotics traffickers. The central bank of Estonia, where Swedish banks dominate the lending market, urged consumers to steer clear of bitcoin and similar virtual currencies, warning such software could prove to be little more than a Ponzi scheme. Mihkel Nommela, head of the Estonian central bank’s payment and settlement systems department, said that Bitcoin “is a problematic scheme.”
VIDEO: Aruna Roy Urges Sonia To Give Social Schemes A Push
Noted social activist Aruna Roy urged Congress president Sonia Gandhi Friday to intervene personally to give a “strong political push” to the UPA’s flagship programs like the Mahatma Gandhi National Rural Employment Guarantee Program and Social Security Pensions. In her letter to Gandhi, who heads the National Advisory Council, the former NAC member said as the term of the 15th Lok Sabha draws to a close “four important promises” of the United Progressive Alliance government are “still to be implemented, despite being supported by a national political consensus.”
Forex Speculators decreased US Dollar bullish bets for 1st time in 4 weeks
By CountingPips.com
Large Speculator bullish bets fell to $17.18 billion on January 28th
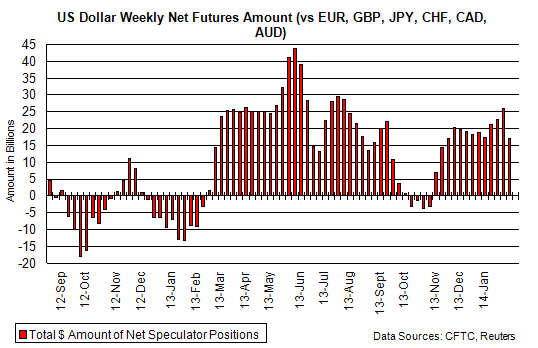
The latest data for the weekly Commitments of Traders (COT) report, released by the Commodity Futures Trading Commission (CFTC) on Friday, showed that large traders and futures speculators decreased their overall bullish position of the US dollar for the first time in four weeks and to the lowest level since November.
Non-commercial large futures traders, including hedge funds and large International Monetary Market speculators, had an overall US dollar long position totaling $17.18 billion as of Tuesday January 28th, according to data from Reuters. This was a weekly change of -$8.71 billion from the $25.89 billion total bullish position that was registered on January 21st, according to the calculations by Reuters that totals the US dollar contracts against the combined contracts of the euro, British pound, Japanese yen, Australian dollar, Canadian dollar and the Swiss franc.
The US dollar aggregate positions on January 28th marked the lowest level since November 19th when net US dollar bullish bets equaled $17.1 billion.
Net Contract Standings for the week:
Individual Currencies – Large Speculator Weekly changes:
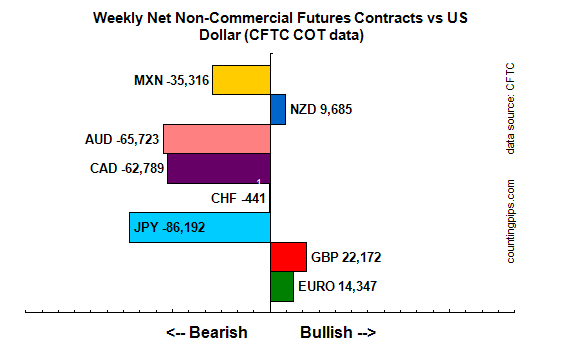
The non-commercial net positions for each of the individual currencies directly against the US dollar showed weekly gains for the euro, British pound sterling, Japanese yen, Canadian dollar, New Zealand dollar and the Swiss franc while there were weekly declines for the Australian dollar and the Mexican peso. See charts & data below.
Individual Currency Charts: Large & Small Speculator Positions vs Spot Price
EuroFX:
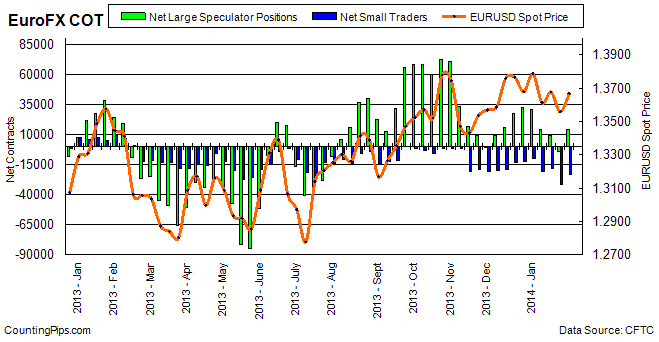
Last Six Weeks data for EuroFX futures
Date | Open Interest | Large Specs Net | Lg Specs Weekly Change | Small Specs Net |
12/24/2013 | 240206 | 32172 | 4249 | -12463 |
12/31/2013 | 242071 | 30589 | -1583 | -10160 |
01/07/2014 | 238570 | 14498 | -16091 | -20777 |
01/14/2014 | 243434 | 9246 | -5252 | -18238 |
01/21/2014 | 255300 | -3772 | -13018 | -31289 |
01/28/2014 | 260799 | 14347 | 18119 | -22823 |
British Pound Sterling:
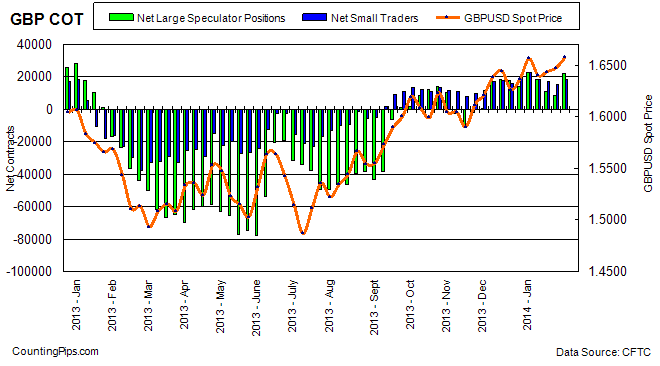
Last Six Weeks data for Pound Sterling futures
Date | Open Interest | Large Specs Net Positions | Lg Specs Weekly Change | Small Specs Net |
12/24/2013 | 198063 | 14420 | -3405 | 19912 |
12/31/2013 | 206886 | 22781 | 8361 | 22800 |
01/07/2014 | 194668 | 18178 | -4603 | 18591 |
01/14/2014 | 201372 | 11160 | -7018 | 16988 |
01/21/2014 | 208112 | 8720 | -2440 | 15099 |
01/28/2014 | 218738 | 22172 | 13452 | 18606 |
Japanese Yen:
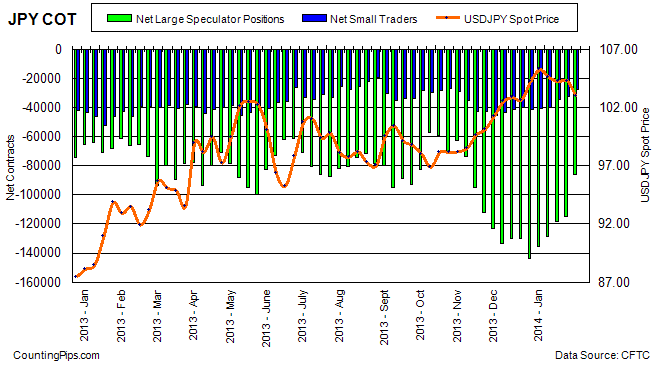
Last Six Weeks data for Yen Futures
Date | Open Interest | Large Specs Net Positions | Lg Specs Weekly Change | Small Specs Net |
12/24/2013 | 239160 | -143822 | -13599 | -41364 |
12/31/2013 | 232225 | -135228 | 8594 | -40970 |
01/07/2014 | 230156 | -128868 | 6360 | -40260 |
01/14/2014 | 218324 | -118066 | 10802 | -34238 |
01/21/2014 | 217548 | -114961 | 3105 | -32811 |
01/28/2014 | 203014 | -86192 | 28769 | -27497 |
Swiss Franc:
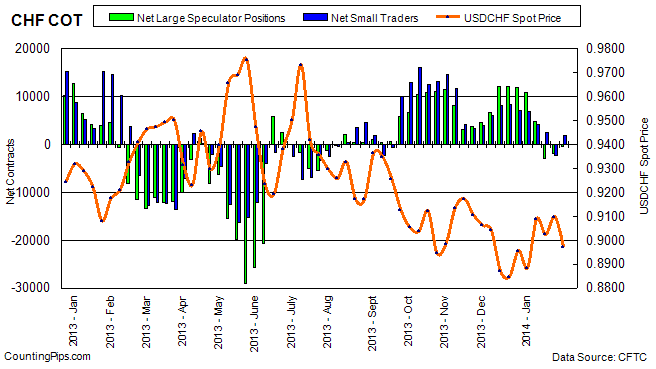
Last Six Weeks data for Franc futures
Date | Open Interest | Large Specs Net Positions | Lg Specs Weekly Change | Small Specs Net |
12/24/2013 | 51131 | 11920 | -35 | 7118 |
12/31/2013 | 51139 | 10889 | -1031 | 6818 |
01/07/2014 | 42087 | 4727 | -6162 | 4102 |
01/14/2014 | 42791 | -2941 | -7668 | 2549 |
01/21/2014 | 42110 | -1921 | 1020 | -2263 |
01/28/2014 | 40869 | -441 | 1480 | 1757 |
Canadian Dollar:
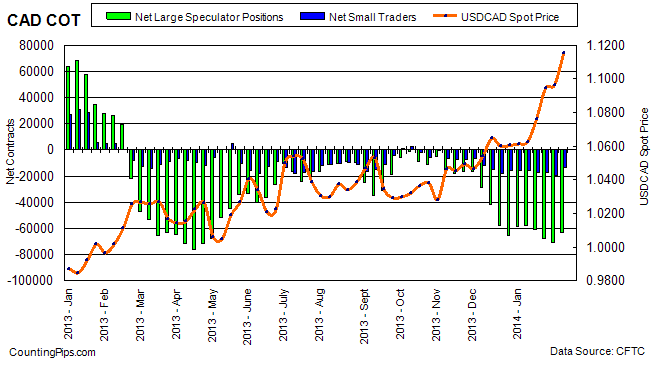
Last Six Weeks data for Canadian dollar futures
Date | Open Interest | Large Specs Net Positions | Lg Specs Weekly Change | Small Specs Net |
12/24/2013 | 149359 | -58432 | 7068 | -15677 |
12/31/2013 | 149037 | -57956 | 476 | -15983 |
01/07/2014 | 156950 | -60542 | -2586 | -17128 |
01/14/2014 | 171370 | -67345 | -6803 | -16966 |
01/21/2014 | 169456 | -70327 | -2982 | -19477 |
01/28/2014 | 157214 | -62789 | 7538 | -13380 |
Australian Dollar:
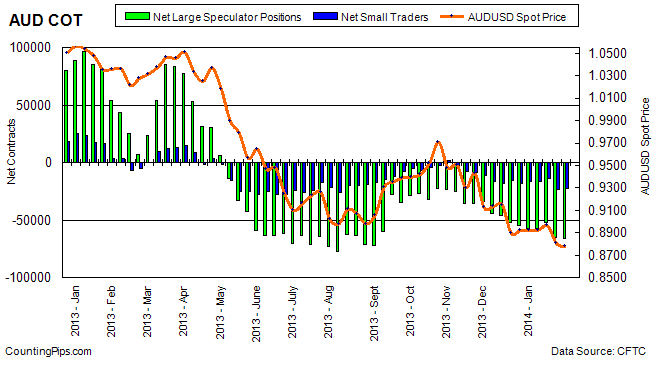
Last Six Weeks data for Australian dollar futures
Date | Open Interest | Large Specs Net Positions | Lg Specs Weekly Change | Small Specs Net |
12/24/2013 | 117884 | -54239 | -2586 | -17882 |
12/31/2013 | 120071 | -57414 | -3175 | -16660 |
01/07/2014 | 122121 | -56852 | 562 | -16350 |
01/14/2014 | 112341 | -51988 | 4864 | -14003 |
01/21/2014 | 137503 | -64654 | -12666 | -23115 |
01/28/2014 | 136426 | -65723 | -1069 | -22762 |
New Zealand Dollar:
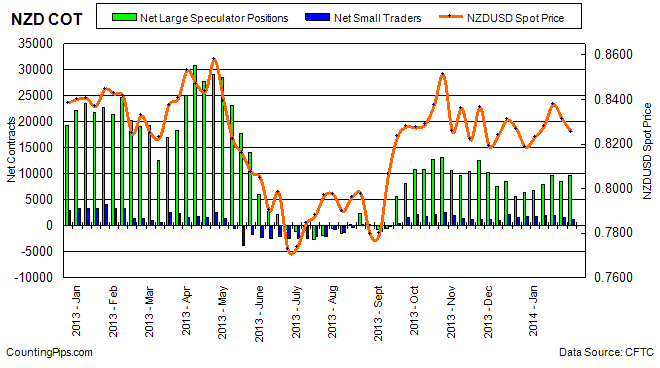
Last Six Weeks data for New Zealand dollar futures
Date | Open Interest | Large Specs Net Positions | Lg Specs Weekly Change | Small Specs Net |
12/24/2013 | 18668 | 6456 | 783 | 1724 |
12/31/2013 | 18748 | 6707 | 251 | 1770 |
01/07/2014 | 20039 | 7866 | 1159 | 1966 |
01/14/2014 | 22870 | 9614 | 1748 | 1898 |
01/21/2014 | 22817 | 8556 | -1058 | 1532 |
01/28/2014 | 21796 | 9685 | 1129 | 1240 |
Mexican Peso:
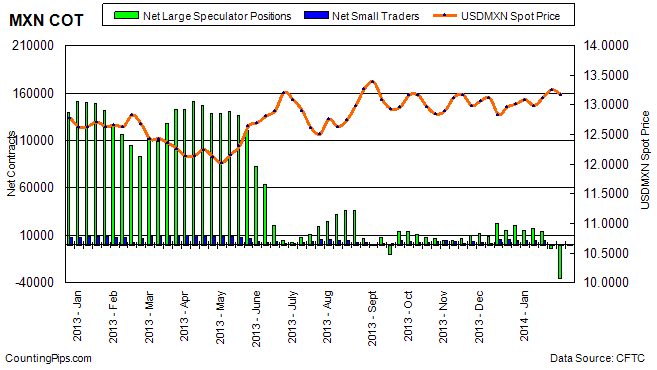
Last Six Weeks data for Mexican Peso futures
Date | Open Interest | Large Specs Net Positions | Lg Specs Weekly Change | Small Specs Net |
12/24/2013 | 123733 | 20178 | 4528 | 5022 |
12/31/2013 | 116803 | 15605 | -4573 | 5162 |
01/07/2014 | 117008 | 17607 | 2002 | 4577 |
01/14/2014 | 112998 | 13717 | -3890 | 4766 |
01/21/2014 | 121142 | -3628 | -17345 | 626 |
01/28/2014 | 133035 | -35316 | -31688 | -974 |
*COT Report: The weekly commitment of traders report summarizes the total trader positions for open contracts in the futures trading markets. The CFTC categorizes trader positions according to commercial hedgers (traders who use futures contracts for hedging as part of the business), non-commercials (large traders who speculate to realize trading profits) and nonreportable traders (usually small traders/speculators).
The Commitment of Traders report is published every Friday by the Commodity Futures Trading Commission (CFTC) and shows futures positions data that was reported as of the previous Tuesday (3 days behind).
Each currency contract is a quote for that currency directly against the U.S. dollar, a net short amount of contracts means that more speculators are betting that currency to fall against the dollar and a net long position expect that currency to rise versus the dollar.
(The graphs overlay the forex spot closing price of each Tuesday when COT trader positions are reported for each corresponding spot currency pair.)
See more information and explanation on the weekly COT report from the CFTC website.
Article by CountingPips.com – Forex Apps & News
US 10-Year Treasury Note Speculators sharply increased bearish bets last week
By CountingPips.com
Weekly CFTC Net Speculator Report
Large Speculators are at most bearish level since January 7th as Yields decline
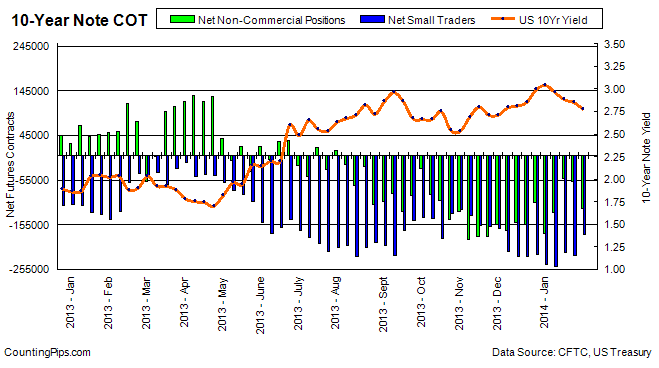
10 Year Treasuries: Large futures market traders sharply added to their overall bearish positions in the 10-year treasury note futures last week, according to the latest Commitment of Traders (COT) data released by the Commodity Futures Trading Commission (CFTC) on Friday.
The non-commercial futures contracts of the 10-year treasury notes, primarily traded by large speculators and hedge funds, totaled a net position of -117,759 contracts in the data reported for January 28th. This was a change of -59,368 contracts from the previous week’s total of -58,391 net contracts that was recorded on January 21st. The latest data is the most bearish participants have been since January 7th when net positions equaled -128,045 contracts.
Over the same reporting time-frame, from Tuesday January 21st to Tuesday January 28th, the yield on the 10-Year treasury note fell from 2.85 to a yield of 2.77, according to data from the United States Treasury Department.
Last 6 Weeks of Large Trader Non-Commercial Positions
Date | Open Interest | Net Large Specs | Weekly Change | 10 Year Yield |
12/24/2013 | 2163928 | -105768 | 49441 | 2.99 |
12/31/2013 | 2211389 | -173674 | -67906 | 3.04 |
01/07/2014 | 2214170 | -128045 | 45629 | 2.96 |
01/14/2014 | 2197399 | -50790 | 77255 | 2.88 |
01/21/2014 | 2232869 | -58391 | -7601 | 2.85 |
01/28/2014 | 2334109 | -117759 | -59368 | 2.77 |
*COT Report: The weekly commitment of traders report summarizes the total trader positions for open contracts in the futures trading markets. The CFTC categorizes trader positions according to commercial hedgers (traders who use futures contracts for hedging as part of the business), non-commercials (large traders who speculate to realize trading profits) and nonreportable traders (usually small traders/speculators). Find CFTC criteria here: (http://www.cftc.gov/MarketReports/CommitmentsofTraders/ExplanatoryNotes/index.htm).
Article by CountingPips.com – Forex Trading Apps
VIX Futures Speculators bearish positions virtually unchanged last week as VIX Index rose
By CountingPips.com
Weekly CFTC Net Speculator Report
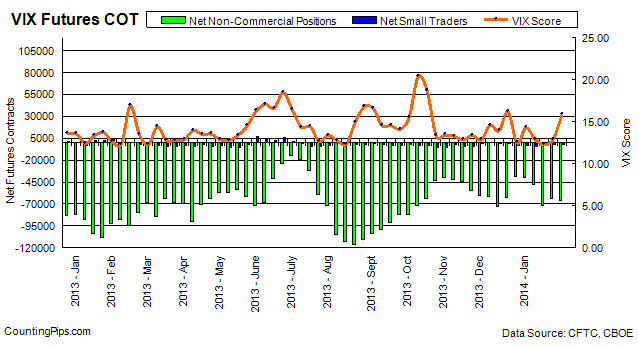
VIX Futures Contracts: Large trader and speculator positions were virtually unchanged from the previous week in the VIX futures market last week, according to the latest data from the Commodity Futures Trading Commission (CFTC) released on Friday.
The VIX non-commercial contracts, traded by large speculators and hedge funds, totaled a net position of -65,504 contracts in the data reported for January 28th. This was a change of -1,198 contracts from the previous week’s total of -64,306 net contracts that was recorded on January 21st.
The VIX index, meanwhile, rose to its highest levels in six weeks through January 28th as unease from emerging-market economies and the uncertain effects of the US Fed tapering led to volatility in the markets. The VIX increased from 12.87 on Tuesday January 21st to 15.80 on Tuesday January 28th, according to the Chicago Board Options Exchange (CBOE) Volatility Index.
Last 6 Weeks of Large Trader Positions
Date | Open Interest | Net Non-Commercials | Weekly Change | VIX Score |
12/24/2013 | 354273 | -38125 | 24512 | 12.48 |
12/31/2013 | 349696 | -39992 | -1867 | 14.28 |
01/07/2014 | 359668 | -47472 | -7480 | 12.92 |
01/14/2014 | 397328 | -71496 | -24024 | 12.28 |
01/21/2014 | 416956 | -64306 | 7190 | 12.87 |
01/28/2014 | 376043 | -65504 | -1198 | 15.8 |
*COT Report: The weekly commitment of traders report summarizes the total trader positions for open contracts in the futures trading markets. The CFTC categorizes trader positions according to commercial hedgers (traders who use futures contracts for hedging as part of the business), non-commercials (large traders who speculate to realize trading profits) and nonreportable traders (usually small traders/speculators). Find CFTC criteria here: (http://www.cftc.gov/MarketReports/CommitmentsofTraders/ExplanatoryNotes/index.htm).
Article by CountingPips.com – Forex Apps & Analysis