USDCHF Forex Trading Pivot Points: US Dollar falling to Swiss Franc

2013.11.27 13:30 6:30AM ET | USDCHF Currency Pair

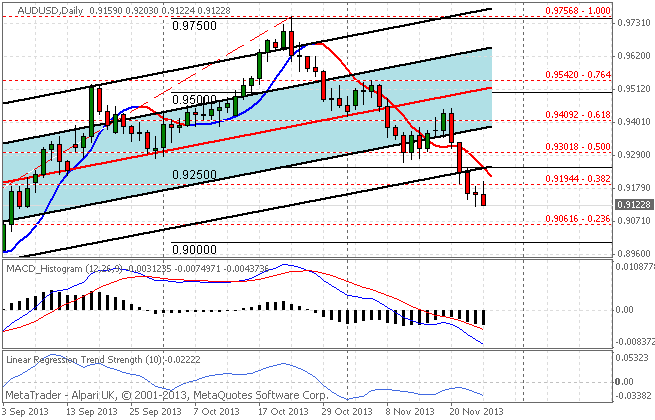
Here are the current Pivot Points Levels with Support (S) and Resistance (R) for the USDCHF currency pair today. Price action is currently trading under the daily pivot point at the 0.90480 price level, according to data at 6:30 AM ET. The USDCHF high for the day has been 0.90786 while the low of day reached 0.90397. The pair opened the Asian trading session earlier today below the daily pivot and has trended lower throughout the day with prices currently landing at the S1 support level.

SC USDCHF 2013.11.27

Daily Pivot Point: 0.90810
— S1 – 0.90433
— S2 – 0.90227
— S3 – 0.89850
— R1 – 0.91016
— R2 – 0.91393
— R3 – 0.91599


Weekly Pivot Points: USDCHF

Prices are currently trading under the weekly pivot point at time of writing while prices reside on top of the monthly pivot point (black line). The USDCHF has been on an overall bearish pace this week after opening the trading week below the weekly pivot.

SC USDCHF 2013.11.27

Weekly Pivot Point: 0.91056
— S1 – 0.90208
— S2 – 0.89784
— S3 – 0.88936
— R1 – 0.91480
— R2 – 0.92328
— R3 – 0.92752


By CountingPips.com – Forex Trading Apps & Currency Trading Tools


Disclaimer: Foreign Currency trading and trading on margin carries a high level of risk and volatility and can result in loss of part or all of your investment. All information and opinions contained do not constitute investment advice and accuracy of prices, charts, calculations cannot be guaranteed.



USDCAD Daily Forex Fibonacci Levels & Trends Data 2013.11.27

2013.11.27 | USDCAD Market Analysis

USDCAD Trends & Fibonacci Retracement Levels

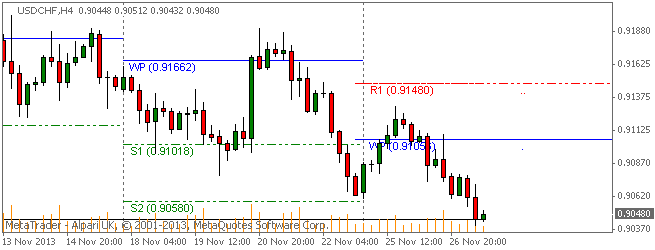
The USDCAD currency pair has been virtually unchanged in forex market trading today with the USDCAD registering a high of 1.05599 and a low of 1.05299 on the day. Trends data shows the pair is currently in a short-term uptrend as prices are trading over the short-term 21 period linear moving average. Over the longer term trend, as seen on the chart by the 90 day Linear Regression Channels, the pair is in an uptrend with prices between the newly formed fibonacci retracement top (0.00%) and the 1st pullback retracement level (23.6%).

SC USDCAD 2013.11.27


USDCAD Trends Data: Linear Regression Indicator

10-day current trend is BULLISH / Trend strength of 128.9 pips
30-day current trend is BULLISH / Trend strength of 205.7 pips
60-day current trend is BULLISH / Trend strength of 191.5 pips
90-day current trend is BULLISH / Trend strength of 115.9 pips
180-day current trend is BULLISH / Trend strength of 290.6 pips

Fibonacci Retracement Levels: Past 100 Days

— 0.000 – 1.05816
— 0.236 – 1.04870
— 0.382 – 1.04285
— 0.500 – 1.03812
— 0.618 – 1.03339
— 0.764 – 1.02754
— 1.000 – 1.01808


By CountingPips.comForex Trading Apps & Currency Trade Tools


Disclaimer: Foreign Currency trading and trading on margin carries a high level of risk and volatility and can result in loss of part or all of your investment. All information and opinions contained do not constitute investment advice and accuracy of prices, charts, calculations cannot be guaranteed.
 

NZDUSD Daily Forex Fibonacci Levels & Trends Data 2013.11.27

2013.11.27 | NZDUSD Market Analysis

NZDUSD Trends & Fibonacci Retracement Levels

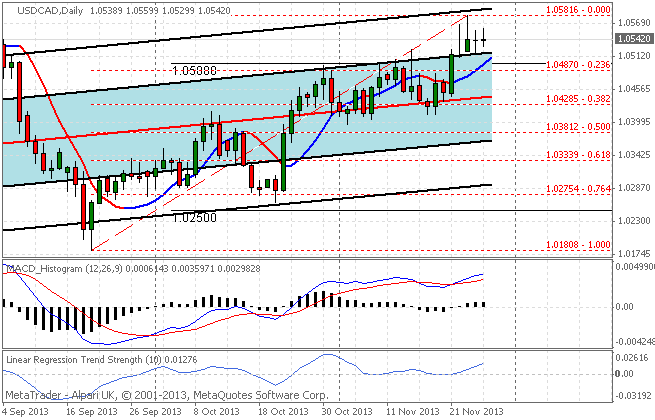
The NZDUSD currency pair has been slightly rising in forex market trading today with prices consolidating right below the 0.8200 level. NZDUSD has registered a high of 0.82086 and a low of 0.81661 on the day. Trends data shows the pair is currently in a short-term downtrend with price trading under the short-term 21 period moving average. Over the longer term trend, as seen on the chart by the 90 day Linear Regression Channels indicator, the pair continues to be in an uptrend.

SC NZDUSD 2013.11.27


NZDUSD Trends Data: Linear Regression Indicator

10-day current trend is BEARISH / Trend strength of -158.7 pips
30-day current trend is BEARISH / Trend strength of -229.9 pips
60-day current trend is BULLISH / Trend strength of 151.6 pips
90-day current trend is BULLISH / Trend strength of 502.4 pips
180-day current trend is BEARISH / Trend strength of -74.6 pips

Fibonacci Retracement Levels: Past 100 Days

— 0.000 – 0.85410
— 0.236 – 0.83464
— 0.382 – 0.82260
— 0.500 – 0.81286
— 0.618 – 0.80313
— 0.764 – 0.79109
— 1.000 – 0.77163


By CountingPips.comForex Trading Apps & Currency Trade Tools

Disclaimer: Foreign Currency trading and trading on margin carries a high level of risk and volatility and can result in loss of part or all of your investment. All information and opinions contained do not constitute investment advice and accuracy of prices, charts, calculations cannot be guaranteed.


VIDEO: Regional Fed Banks Still Split On Discount Rate Cut/hike Need

One regional U.S. Federal Reserve bank continued to seek a quarter point cut in the discount rate last month while three other branches pushed for a matching hike, but the Fed Board in Washington decided to leave rates unchanged at 0.75 percent. Minneapolis Fed directors sought a cut to 0.50 percent in the discount rate, which is the level at which banks may borrow from the central bank if they are unable to raise funds in the private market. Dallas, Philadelphia and Kansas City requested a hike to 1.0 percent.

VIDEO: RBS Reports ‘deeply Troubling’: Bank Of England’s Carney

Bank of England Governor Mark Carney said he was concerned by reports that Royal Bank of Scotland mistreated small businesses and said the bank needed to be fully investigated. Carney said Britain’s Financial Conduct Authority, which is not part of the BofE, was investigating the case, which had “to be tracked down to the full extent of the law.” Britain’s Finance Minister, George Osborne, expects better behavior from the bank.

GBPUSD Forex Trading Pivot Point Levels for 2013.11.26

2013.11.26 13:30 6:30AM ET | GBPUSD Currency Pair

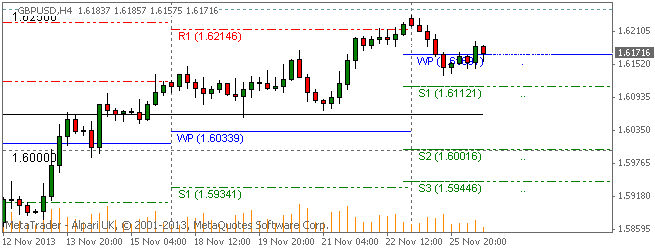
Here are the current Pivot Points Levels with Support (S) and Resistance (R) for the GBPUSD currency pair. Price action is currently trading slightly under the daily pivot point at the 1.61716 price level, according to data at 6:30 AM ET. The pair opened the Asian trading session earlier today below the daily pivot and has traded higher over the course of the day and back to the pivot level.

SC GBPUSD 2013.11.26

Daily Pivot Point: 1.61750
— S1 – 1.61106
— S2 – 1.60677
— S3 – 1.60033
— R1 – 1.62179
— R2 – 1.62823
— R3 – 1.63252


Weekly Pivot Points: GBPUSD

Prices are currently trading on top of the weekly pivot point at time of writing. The GBPUSD has been on a bearish pace this week after opening the trading week above the weekly pivot.

SC GBPUSD 2013.11.26

Weekly Pivot Point: 1.61691
— S1 – 1.61121
— S2 – 1.60016
— S3 – 1.59446
— R1 – 1.62796
— R2 – 1.63366
— R3 – 1.64471


By CountingPips.comForex Trading Apps & Currency Trade Tools

Disclaimer: Foreign Currency trading and trading on margin carries a high level of risk and volatility and can result in loss of part or all of your investment. All information and opinions contained do not constitute investment advice and accuracy of prices, charts, calculations cannot be guaranteed.


USDJPY Forex Trading Pivot Point Levels for 2013.11.26

2013.11.26 13:30 6:30AM ET | USDJPY Currency Pair

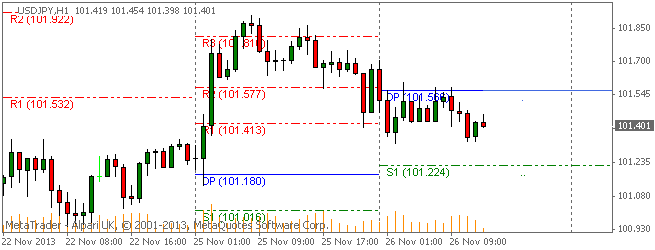
Here are the current Pivot Points Levels with Support (S) and Resistance (R) for the USDJPY currency pair. Price action is currently trading below the daily pivot point at the 101.401 price level, according to data at 6:30 AM ET. The pair opened the Asian trading session earlier today above the daily pivot and has trended lower over the course of the day.

SC USDJPY 2013.11.26

Daily Pivot Point: 101.566
— S1 – 101.224
— S2 – 100.789
— S3 – 100.447
— R1 – 102.001
— R2 – 102.343
— R3 – 102.778


Weekly Pivot Points: USDJPY

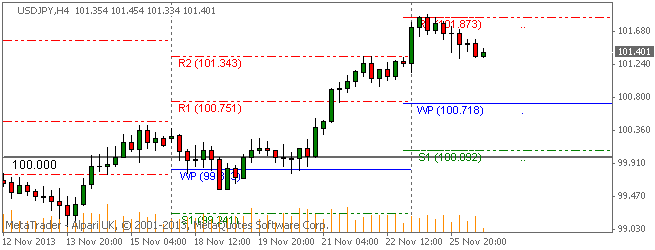
Prices are currently trading over the weekly pivot point finding resistance at the R1 resistance level after opening the trading week above the weekly pivot.

SC USDJPY 2013.11.26

Weekly Pivot Point: 100.718
— S1 – 100.093
— S2 – 98.937
— S3 – 98.312
— R1 – 101.874
— R2 – 102.499
— R3 – 103.655


By CountingPips.comForex Trading Apps & Currency Trade Tools

Disclaimer: Foreign Currency trading and trading on margin carries a high level of risk and volatility and can result in loss of part or all of your investment. All information and opinions contained do not constitute investment advice and accuracy of prices, charts, calculations cannot be guaranteed.


EURUSD Forex Trading Pivot Point Levels for 2013.11.26

2013.11.26 13:30 6:30AM ET | EURUSD Currency Pair

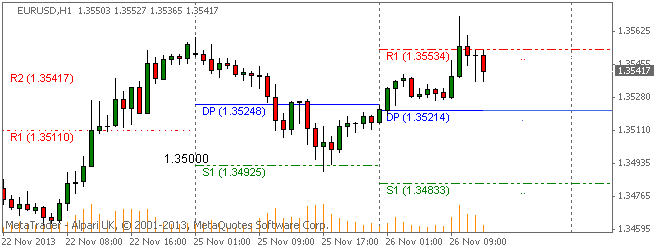
Here are the current Pivot Points Levels with Support (S) and Resistance (R) for the EURUSD currency pair. Price action is currently trading over the daily pivot point at the 1.35417 price level, according to data at 6:30 AM ET. The pair opened the Asian trading session earlier today slightly below the daily pivot and has traded higher over the course of the day, reaching the R1 resistance level.

SC EURUSD 2013.11.26

Daily Pivot Point: 1.35214
— S1 – 1.34833
— S2 – 1.34513
— S3 – 1.34132
— R1 – 1.35534
— R2 – 1.35915
— R3 – 1.36235


Weekly Pivot Points: EURUSD

Prices are currently trading over the weekly pivot point at time of writing. The EURUSD has been on a sideways pace so far this week after opening the trading week above the weekly pivot.

SC EURUSD 2013.11.26

Weekly Pivot Point: 1.35110
— S1 – 1.34434
— S2 – 1.33310
— S3 – 1.32634
— R1 – 1.36234
— R2 – 1.36910
— R3 – 1.38034


By CountingPips.com – Forex Trading Apps & Currency Trade Tools


Disclaimer: Foreign Currency trading and trading on margin carries a high level of risk and volatility and can result in loss of part or all of your investment. All information and opinions contained do not constitute investment advice and accuracy of prices, charts, calculations cannot be guaranteed.


AUDUSD Daily Forex Fibonacci Levels & Trends Data 2013.11.26

2013.11.26 | AUDUSD Market Analysis

AUDUSD Trends & Fibonacci Retracement Levels

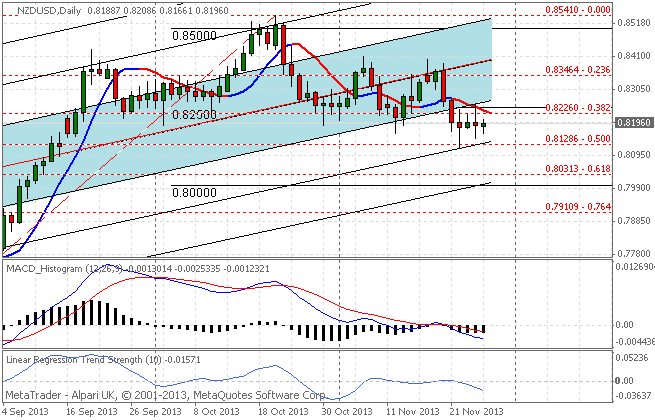
The AUDUSD currency pair has been falling sharply in forex market trading lately with the AUDUSD registering a high of 0.92030 and a low of 0.91224 for today. Trends data shows the pair is currently in a short-term downtrend as prices are trading below the 21 period linear short-term moving average. Over the longer term trend, as seen on the chart by the 90 day Linear Regression Channels indicator, the pair continues to be in an uptrend but prices are deviating sharply from the current trend. Two upcoming lower targets include the 23.6% fibo level at 0.9061 and the major 0.9000 level below.

SC AUDUSD 2013.11.26


AUDUSD Trends Data: Linear Regression Indicator

10-day current trend is BEARISH / Trend strength of -243.5 pips
30-day current trend is BEARISH / Trend strength of -476.9 pips
60-day current trend is BULLISH / Trend strength of 101.4 pips
90-day current trend is BULLISH / Trend strength of 469.7 pips
180-day current trend is BEARISH / Trend strength of -1111.8 pips

Fibonacci Retracement Levels over last 100 Days

— 0.000 – 0.88468
— 0.236 – 0.90616
— 0.382 – 0.91944
— 0.500 – 0.93018
— 0.618 – 0.94092
— 0.764 – 0.95420
— 1.000 – 0.97568

By CountingPips.comForex Trading Apps & Currency Trade Tools


Disclaimer: Foreign Currency trading and trading on margin carries a high level of risk and volatility and can result in loss of part or all of your investment. All information and opinions contained do not constitute investment advice and accuracy of prices, charts, calculations cannot be guaranteed.