GBPUSD Forex Pivot Point Levels & Trading Trends for 2013.11.11

2013.11.11 14:00 7:00AM ET | GBPUSD Currency Pair

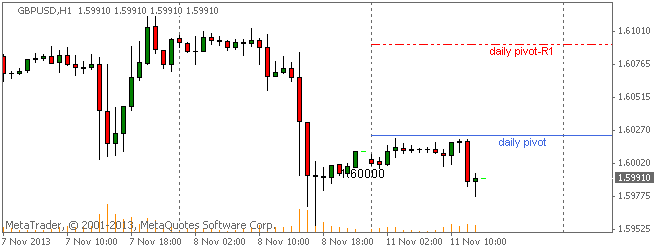
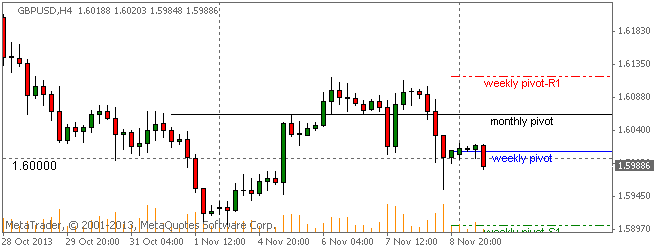
Here are the current Pivot Points Levels with Support (S) and Resistance (R) for the GBPUSD currency pair. Price action is currently trading under the daily pivot point to start the week at the 1.59910 price level, according to data at 7:00 AM ET. The pair opened the Asian trading session earlier today also below the daily pivot and has traded a bit lower over the course of the day.

SC GBPUSD 2013.11.11

Daily Pivot Point: 1.60236
— S1 – 1.59433
— S2 – 1.58754
— S3 – 1.57951
— R1 – 1.60915
— R2 – 1.61718
— R3 – 1.62397


Weekly Pivot Points: GBPUSD

Prices are currently trading under the weekly pivot point at time of writing after opening the trading week below both the weekly and monthly pivots.

SC GBPUSD 2013.11.11

Weekly Pivot Point: 1.60101
— S1 – 1.59035
— S2 – 1.57957
— S3 – 1.56891
— R1 – 1.61179
— R2 – 1.62245
— R3 – 1.63323


GBPUSD Trends & Fibonacci Retracement Levels

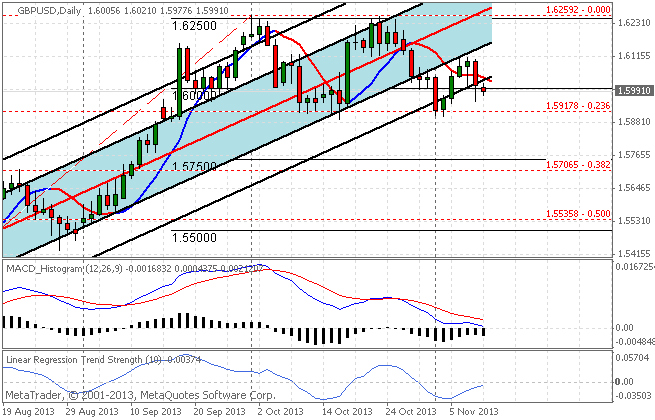
The GBPUSD currency pair has been falling in forex market trading today with the GBPUSD registering a high of 1.60210 and a low of 1.59776 on the day. Trends data shows the pair is currently in a short-term downtrend as prices are trading below our favored short-term moving average. Over the longer term trend, as seen on the chart by the 90 day Linear Regression Channels indicator, the pair continues to be in an uptrend although prices remain on the outskirts of our channels.

SC GBPUSD 2013.11.11


GBPUSD Trends Data: Linear Regression Indicator

10-day current trend is BEARISH / Trend strength of -48.4 pips
30-day current trend is BEARISH / Trend strength of -78.8 pips
60-day current trend is BULLISH / Trend strength of 603.5 pips
90-day current trend is BULLISH / Trend strength of 1158.9 pips
180-day current trend is BULLISH / Trend strength of 1021.1 pips

Fibonacci Retracement Levels over last 100 Days

— 0.000 – 1.62592
— 0.236 – 1.59178
— 0.382 – 1.57065
— 0.500 – 1.55358
— 0.618 – 1.53651
— 0.764 – 1.51538
— 1.000 – 1.48124
By CountingPips.comForex Trading Apps & Currency Trade Tools


Disclaimer: Foreign Currency trading and trading on margin carries a high level of risk and volatility and can result in loss of part or all of your investment. All information and opinions contained do not constitute investment advice and accuracy of prices, charts, calculations cannot be guaranteed.
 

Forex Fundamental Schedule: Janet Yellen’s confirmation on tap this week

By CountingPips.com

The Upcoming Major Events on the Schedule worth watching out for

Yellen-Janet-PD


Shaping up to be the most important economic events on the schedule this week for the Forex markets will include important economic data out of China, the United Kingdom, Japan and the Eurozone. We will also see the beginning of Janet Yellin’s confirmation hearings on Thursday to be the next chairman of the US Federal Reserve.

Here’s a quick rundown of the economic highlights.


  • Sunday we will see new Yuan loans data from China as well as Japan trade balance data and New Zealand retail spending.
  •  Monday has the Australian home loans data on the schedule as well as Japanese data on the economy, tertiary industry index and the 30 year bond auctions.
  •  Tuesday‘s most important release shapes up to be the United Kingdom consumer price index while we will also see business confidence out of Australia, the German CPI and the United States Chicago Fed national activity.
  •  Wednesday we will look out for the United Kingdom Bank of England inflation report, New Zealand retail sales data as well as the Japanese gross domestic product report.
  •  Thursday will have important euro zone data including the euro zone GDP report, the Germany GDP report, the France GDP report while we will also see the start of Janet Yellin’s Federal Reserve Chairman confirmation hearings.
  •  Friday will see the euro zone consumer price index as well as industrial production and manufacturing production data out of the United States.

Please see the week’s highlighted economic events below or our full calendar:


This Week’s Economic Highlights:

Sunday, November 10

China — new loans
China — financing data
New Zealand — retail spending
Japan — trade balance

Monday, November 11

Australia — home loans data
Japan — tertiary industry index
Japan — economy watchers index
United States — FOMC Fisher speaks
Norway — inflation data
United Kingdom — RICS house price balance
Japan — 30 year bond auction

Tuesday, November 12

Australia — NAB business confidence
euro zone — Germany CPI
United Kingdom — consumer price index
United Kingdom — producer price index
United Kingdom — retail price index
United States — Chicago Fed national activity Index
Australia — Westpac consumer confidence
South Korea — unemployment rate

Wednesday, November 13

United Kingdom — jobless claims
euro zone — industrial production
United Kingdom — bank of England inflation report
United States — mortgage applications
United States — monthly budget statement
New Zealand — retail sales data
New Zealand — business manufacturing index
Japan — foreign bonds/stocks buying
Japan — gross domestic product report
Japan — consumer spending

Thursday, November 14

China — foreign direct investment
Australia — consumer inflation
Japan — industrial production
euro zone — Germany GDP report
euro zone — France GDP report
euro zone — GDP report
Switzerland — producer price index
United Kingdom — retail sales
United States — weekly jobless claims
United States — trade balance
United States — confirmation hearing for Janet Yellen
Canada — trade balance

Friday, November 15

Singapore — retail sales
Hong Kong — GDP report
Euro zone — consumer price index
United States — industrial production
United States — manufacturing production

See our full economic calendar here.


VIDEO: Czech Leftist Party Gives Leader Sobotka Mandate To Form Cabinet

Czech center-left Social Democrat leader Bohuslav Sobotka won a strong mandate from his party on Sunday to try to form a government with two centrist parties following an early election two weeks ago. He will also negotiate with the Christian Democrats, a smaller centrist formation that returned to parliament after dropping out in 2010. The three parties together won 111 out of the 200 seats in the lower house of parliament, as the previously ruling center-right parties suffered a crushing defeat. “Social democrats are ready now to negotiate responsibly to create the new government and we will strive to put as much as possible of our winning program into its agenda,” Sobotka, a former finance minister, said.

Large Speculators turn bullish on US Dollar bets in Forex Futures data

By CountingPips.com

USD forex trader values


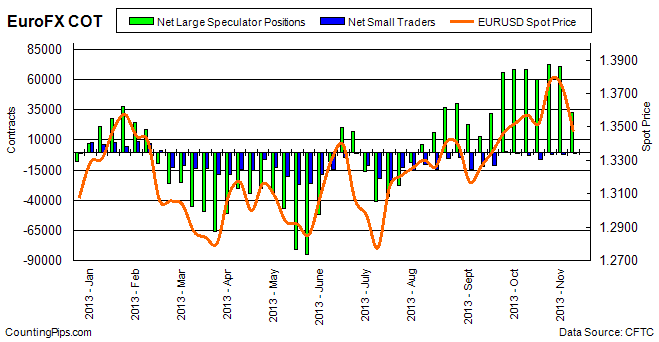
The latest data for the weekly Commitments of Traders (COT) report was released on Friday by the Commodity Futures Trading Commission (CFTC) and showed that large futures speculators turned bullish on the US dollar last week after four straight weeks of bearish positions.

Non-commercial large futures traders, including hedge funds and large International Monetary Market speculators, had an overall US dollar long position totaling $7.02 billion as of Tuesday November 5th. This was a weekly change of $10.17 billion from the total position of $-3.146 billion that was registered on October 29th, according to data from Reuters that calculates this amount by the total of US dollar contracts against the combined contracts of the euro, British pound, Japanese yen, Australian dollar, Canadian dollar and the Swiss franc.

US dollar positions, on November 5th, were at their most bullish level since September 17th when US dollar bets were long at a total of $10.8 billion.


Individual Currencies Large Speculators Positions in Futures:

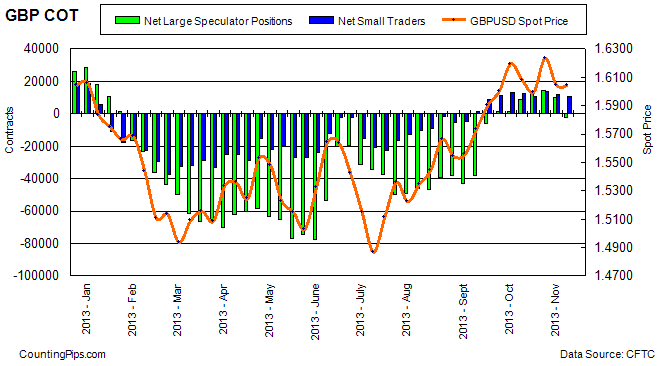
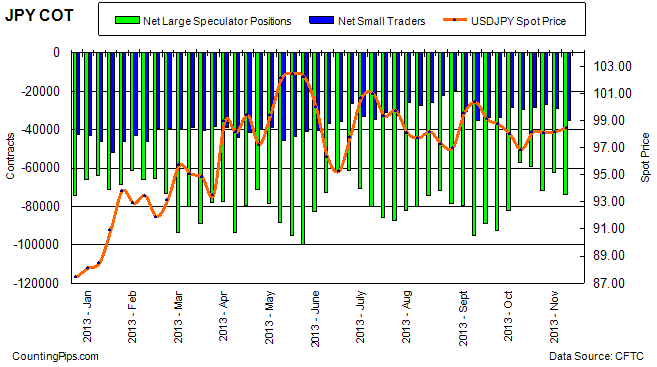
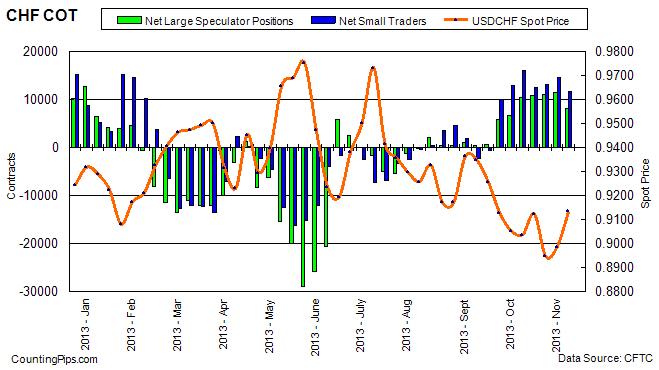
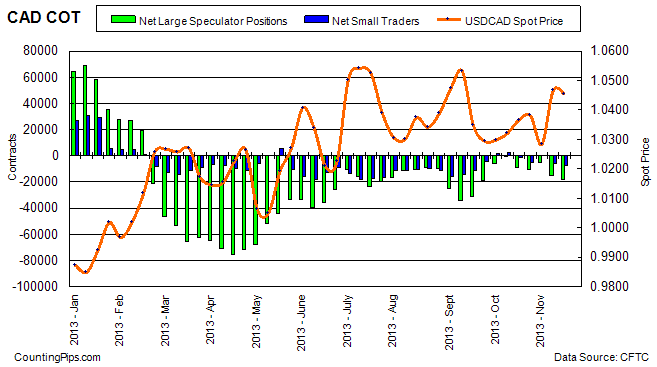
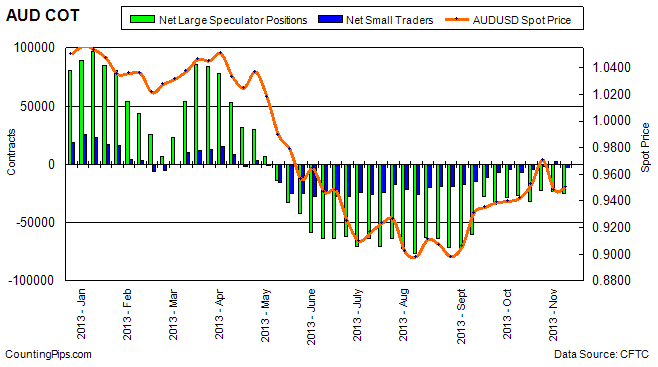
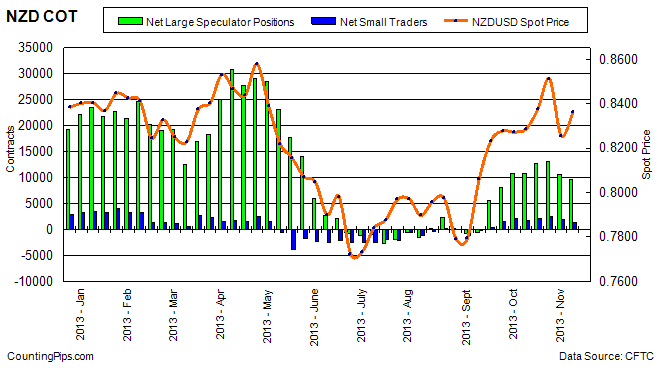
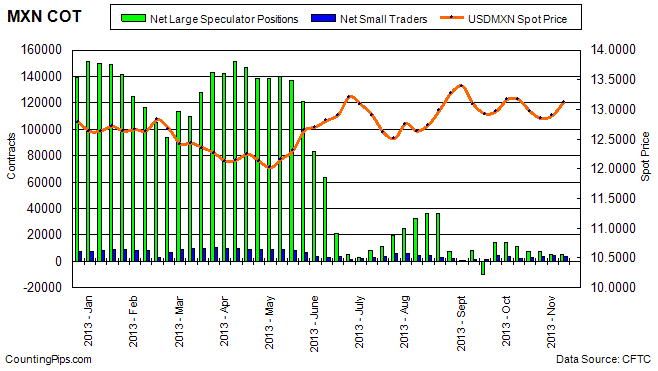
The large non-commercial net positions for each of the individual major currencies directly against the US dollar on November 5th showed weekly increases for just the Mexican peso while there were declines for the euro, British pound sterling, Japanese yen, Swiss franc, Canadian dollar, Australian dollar and the New Zealand dollar.


Individual Currency Charts:


EuroFX:

euro

Last Six Weeks of Large Trader Positions: EuroFX

DateLarge Trader Net PositionsWeekly Change
10/01/2013682762432
10/08/201368683407
10/15/201360374-8309
10/22/20137243412060
10/29/201370617-1817
11/05/201333143-37474


British Pound Sterling:

gbp

Last Six Weeks of Large Trader Positions: Pound Sterling

DateLg Trader NetWeekly Change
10/01/20131496322
10/08/201387717275
10/15/2013122313460
10/22/2013142622031
10/29/201310162-4100
11/05/2013-2392-12554


Japanese Yen:

jpy

Last Six Weeks of Large Trader Positions: Yen

DateLg Trader NetWeekly Change
10/01/2013-8232410494
10/08/2013-5709725227
10/15/2013-59266-2169
10/22/2013-71802-12536
10/29/2013-623959407
11/05/2013-73792-11397


Swiss Franc:

chf

Last Six Weeks of Large Trader Positions: Franc

DateLg Trader NetWeekly Change
10/01/20136636891
10/08/2013104153779
10/15/201310767352
10/22/201310931164
10/29/201311451520
11/05/20138095-3356


Canadian Dollar:

cad

Last Six Weeks of Large Trader Positions: CAD

DateLg Trader NetWeekly Change
10/01/2013-9554720
10/08/2013-8663-7708
10/15/2013-10814-2151
10/22/2013-53645450
10/29/2013-15237-9873
11/05/2013-18002-2765


Australian Dollar:

aud

Last Six Weeks of Large Trader Positions: AUD

DateLg Trader NetWeekly Change
10/01/2013-288046015
10/08/2013-264042400
10/15/2013-32237-5833
10/22/2013-2211110126
10/29/2013-23198-1087
11/05/2013-25067-1869


New Zealand Dollar:

nzd

Last Six Weeks of Large Trader Positions: NZD

DateLg Trader NetWeekly Change
10/01/2013108912836
10/08/201310766-125
10/15/2013126681902
10/22/201313114446
10/29/201310625-2489
11/05/20139708-917


Mexican Peso:

mxn

Last Six Weeks of Large Trader Positions: MXN

DateLg Trader NetWeekly Change
10/01/201314601578
10/08/201310933-3668
10/15/20137761-3172
10/22/20137214-547
10/29/20134896-2318
11/05/20135180284


*COT Report: The weekly commitment of traders report summarizes the total trader positions for open contracts in the futures trading markets. The CFTC categorizes trader positions according to commercial hedgers (traders who use futures contracts for hedging as part of the business), non-commercials (large traders who speculate to realize trading profits) and nonreportable traders (usually small traders/speculators).

The Commitment of Traders report is published every Friday by the Commodity Futures Trading Commission (CFTC) and shows futures positions data that was reported as of the previous Tuesday (3 days behind).

Each currency contract is a quote for that currency directly against the U.S. dollar, a net short amount of contracts means that more speculators are betting that currency to fall against the dollar and a net long position expect that currency to rise versus the dollar.

(The graphs overlay the forex spot closing price of each Tuesday when COT trader positions are reported for each corresponding spot currency pair.)

See more information and explanation on the weekly COT report from the CFTC website.


Article by CountingPips.comCurrency Trading News


US 10-Year Treasury Note Speculators increase bearish positions

By CountingPips.com

Weekly CFTC Net Speculator Report

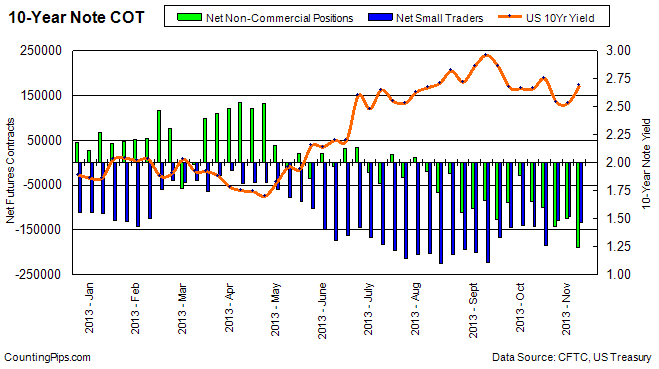
10 Year Treasuries: Large trader and futures market speculators raised their overall bearish positions by the largest amount since late August in the 10-year treasury note futures for November 5th, according to data released by the Commodity Futures Trading Commission (CFTC) on Friday. The non-commercial futures contracts of the 10-year treasury notes, traded by large speculators and hedge funds, totaled a net position of -189,188 contracts in the data reported for November 5th. This was a change of -63,518 contracts from the previous week’s total of -125,670 net contracts that was registered on October 29th. This most recent data represents the highest bearish position in 10-year notes in 2013 and the biggest change in non-commercial positions since August 27th when positions declined by -85,985 contracts.


10-Year Treasury Notes Bonds

Over the same time-frame, the yield on the 10-Year treasury note increased from 2.53 on Tuesday October 29th to 2.69 on Tuesday November 5th, according to US Treasury data.


Last 6 Weeks of Large Trader Positions

DateNet Large SpecsWeekly Change10 Year Yield
10/01/2013-28536605712.66
10/08/2013-87571-590352.66
10/15/2013-99788-122172.75
10/22/2013-142550-427622.54
10/29/2013-125670168802.53
11/05/2013-189188-635182.69


*COT Report: The weekly commitment of traders report summarizes the total trader positions for open contracts in the futures trading markets. The CFTC categorizes trader positions according to commercial hedgers (traders who use futures contracts for hedging as part of the business), non-commercials (large traders who speculate to realize trading profits) and nonreportable traders (usually small traders/speculators). Find CFTC criteria here: (http://www.cftc.gov/MarketReports/CommitmentsofTraders/ExplanatoryNotes/index.htm).


Article by CountingPips.comForex Trading News & Analysis


VIX Futures Speculators added to bearish bets last week – COT Data

By CountingPips.com

Weekly CFTC Net Speculator Report

VIX: Large traders and speculators slightly increased their bearish positions on November 5th in the VIX futures market after decreasing bearish positions the previous four weeks, according to the Commodity Futures Trading Commission (CFTC) data released on Friday. The VIX non-commercial contracts, usually representing large speculators and hedge funds, totaled a net position of -41,908 contracts in the data reported for November 5th. This was a change of -2,235 contracts from the previous week’s total of -39,673 net contracts that was registered on October 29th.


vix futures speculators

Over the same time-frame, the VIX index score edged lower from 13.41 on Tuesday October 29th to 13.27 on Tuesday November 5th, according to the Chicago Board Options Exchange (CBOE) Volatility Index.


Last 6 Weeks of Large Trader Positions

DateNet Non-CommericalsChange
10/01/2013-81942-408
10/08/2013-722509692
10/15/2013-636148636
10/22/2013-4329720317
10/29/2013-396733624
11/05/2013-41908-2235


*COT Report: The weekly commitment of traders report summarizes the total trader positions for open contracts in the futures trading markets. The CFTC categorizes trader positions according to commercial hedgers (traders who use futures contracts for hedging as part of the business), non-commercials (large traders who speculate to realize trading profits) and nonreportable traders (usually small traders/speculators). Find CFTC criteria here: (http://www.cftc.gov/MarketReports/CommitmentsofTraders/ExplanatoryNotes/index.htm).


Article by CountingPips.comForex News & Analysis


USDCHF Daily Forex Fibonacci Levels & Trends Data 2013.11.08

2013.11.08 | USDCHF Market Analysis

USDCHF Trends & Fibonacci Retracement Levels

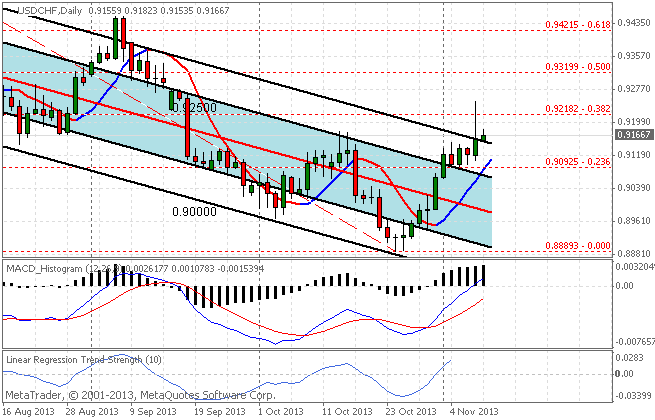
The USDCHF currency pair has been rising in forex market trading the past two days with the USDCHF registering a high of 0.91823 and a low of 0.91535 so far today. Trends data today shows the pair continues to be in a short-term uptrend as prices are trading over our favored short-term moving average. Over the longer term trend, as seen on the chart by the 90 day Linear Regression Channels indicator, the pair continues to be in a downtrend. Prices are currently in overbought or extreme deviation from the mean territory (2 standard deviations above center line) which can signal the start of a new trend change or an impending sharp return to the trend.

SC USDCHF 2013.11.08


USDCHF Trends Data: Linear Regression Indicator

10-day current trend is BULLISH / Trend strength of 272.9 pips
30-day current trend is BULLISH / Trend strength of 33.4 pips
60-day current trend is BEARISH / Trend strength of -308.7 pips
90-day current trend is BEARISH / Trend strength of -480.5 pips
180-day current trend is BEARISH / Trend strength of -449.4 pips

Fibonacci Retracement Levels over last 100 Days

— 0.000 – 0.88893
— 0.236 – 0.90925
— 0.382 – 0.92182
— 0.500 – 0.93199
— 0.618 – 0.94215
— 0.764 – 0.95472
— 1.000 – 0.97504


By CountingPips.com – Forex Trading Apps & Currency Trade News
Disclaimer: Foreign Currency trading and trading on margin carries a high level of risk and volatility and can result in loss of part or all of your investment.  All information and opinions contained do not constitute investment advice and accuracy of prices, charts, calculations cannot be guaranteed.
 

EURUSD Daily Forex Fibonacci Levels & Trends Data

2013.11.08 | EURUSD Market Analysis

EURUSD Trends & Fibonacci Retracement Levels

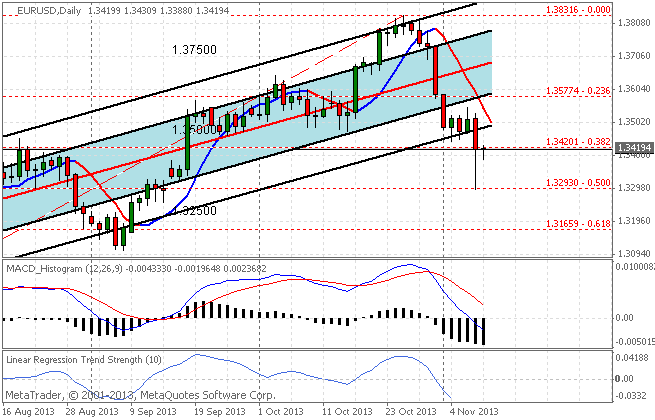
The EURUSD currency pair has been falling in forex market trading over the past couple days with the pair remaining under the major 1.3500 level. Trends data shows the pair is currently in a short-term downtrend as prices are trading under our favored short-term moving average. Over the longer term trend, as seen on the chart by the 90 day Linear Regression Channels, the pair continues to be in an uptrend although the pair trades at the edge of our channels (an extreme deviation or oversold level) and further downward direction from here can indicate a possible trend change.

Forex EURUSD 2013.11.08


EURUSD Trends Data: Linear Regression Indicator

10-day current trend is BEARISH
30-day current trend is BULLISH
60-day current trend is BULLISH
90-day current trend is BULLISH
180-day current trend is BULLISH 

Fibonacci Retracement Target Levels

— 0.000 – 0.88893
— 0.236 – 0.90925
— 0.382 – 0.92182
— 0.500 – 0.93199
— 0.618 – 0.94215
— 0.764 – 0.95472
— 1.000 – 0.97504


By CountingPips.com – Forex Trading Apps & Currency Trade News
Disclaimer: Foreign Currency trading and trading on margin carries a high level of risk and volatility and can result in loss of part or all of your investment.  All information and opinions contained do not constitute investment advice and accuracy of prices, charts, calculations cannot be guaranteed.


VIDEO: Government Shutdown Hit Economy, Wasted Money: White House

The White House budget office on Thursday catalogued the economic damage from the 16-day government shutdown, saying the closure wasted billions of government dollars and hurt individuals and businesses that depend on government functions. Broadly speaking, the shutdown shaved an estimated 0.2 to 0.6 of a percentage point off U.S. gross domestic product in the last three months of the year. Budget Director Sylvia Matthews Burwell said the report was prepared at the request of Democratic Senator Barbara Mikulski and because the White House wanted to document the impact of the shutdown.