People in the market will do anything to gain an upper hand in investing. They will scour past data and events to find a correlation between it and any trends in the market. There’s even a theory out there based on the Super Bowl winner and what the market will do if the champion came from the original NFL or the old AFL. It’s true.
However, there is a theory out there that makes a lot more sense, and it’s based on some real world principles and practices. And being an election year, it becomes a little more prevalent.
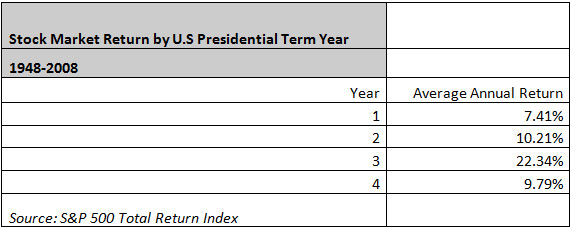
It may shock you to hear that no matter what party you vote for, markets may be predestined to do what they are going to do based on Presidential election cycles. History suggests that the stock market and the four-year presidential election cycle follow strong, predictable patterns.
Here it what the market does over four years:
Year 1: The Post-Election Year
The first year of a presidency is characterized by relatively weak performance in the stock market. Of the four years in a presidential cycle, the first-year performance of the stock market, on average, is the worst.
Year 2: The Midterm Election Year
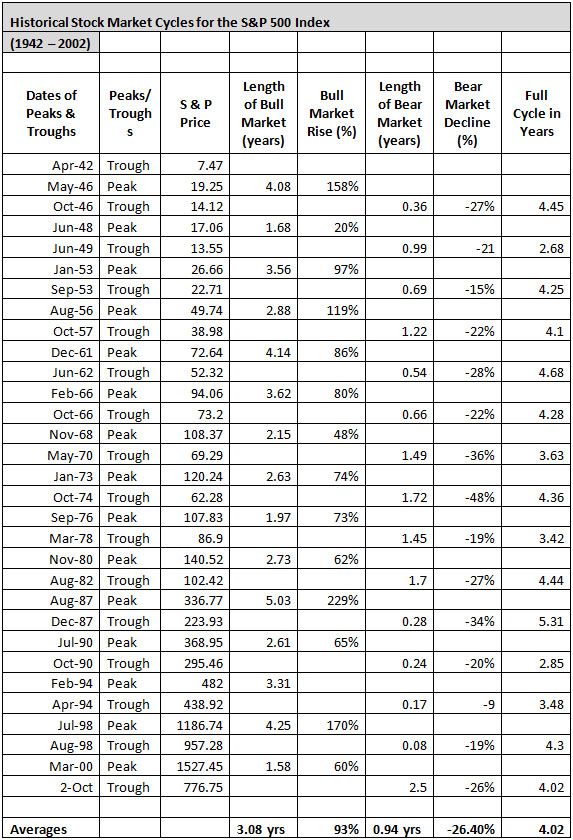
The second year also sees historically below-average performance. Bear market bottoms occur in the second year more often than in any other year.
Year 3: The Pre-Presidential Election Year
The third year is the strongest on average of the four years.
Year 4: The Election Year
In the fourth year of the presidential term and the election year, the stock market’s performance tends to be above average.

The Explanation
And it is. But first, we need a refresher course on macroeconomics and its role in politics over the last 80 years.
Before the Great Depression, we primarily just worried about supply and demand in the micro-view of economics. However, in 1936 the world was introduced to Keynesian macroeconomic theory, which called for governments to prescribe specific fiscal policies so they remodel and ease business cycles. People had become gun shy of another great crash.
A couple of decades later, demand stimulated macroeconomics was seen as gospel and a debate was sparked which has been the subject of many a thesis paper or dissertation over the last 50 years.
I’m not going there…
But what the following graph shows is that this is a pretty consistent phenomenon:

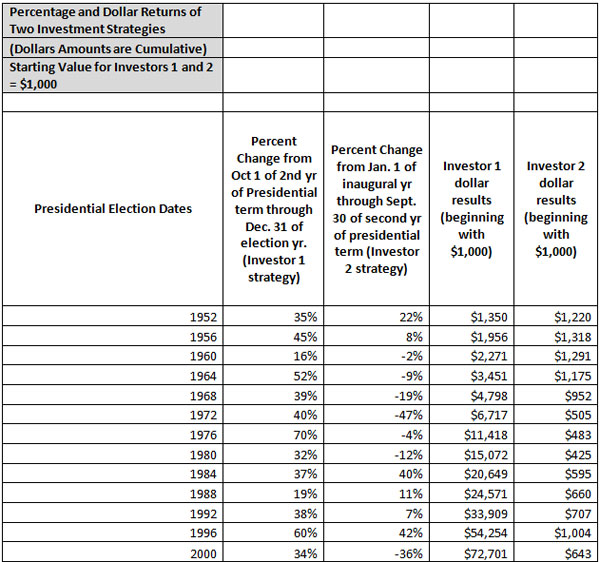
I think we’re all aware that incumbent parties will play around with fiscal policy in a manner designed to inflate the economy just prior to an election and try to create some voter enthusiasm. And the following graph may show just how much euphoria one can create.
Marshall Nickles, EdD, in his paper Presidential Elections and Stock Market Cycles: Can you profit from the relationship? ran the following experiment:
“Imagine that the first investor had consistently purchased the S&P 500 Index 27 months before presidential elections and had sold near election time on December 31 of the election year.
“Because a 27-month period seems to provide better returns than other studied periods before the election, a 27-month period was selected for this test. This strategy kept Investor 1 out of the market from January 1 of the inaugural year through September 30 of the second year during the test period.
“On the other hand, imagine further that Investor 2 bought the S&P 500 on the first trading day of the inaugural year of each presidential election during the test period and liquidated the portfolio on September 30 of the second year of the presidential term.
“Would either or both of these simple procedures have consistently made money for the investors? The Table below reveals the results on both a percentage change basis and dollar return.”

Still All About the Fundamentals
I know that graph above looks tantalizing, but think about this. During the 2008 election cycle, if you invested on October 1 of 2006, until December 31st of 2008, your investments would have been down by 6.8%. We’ve seen a lot of fiscal and monetary policy lately that hasn’t done what it’s suppose to do or hasn’t had its desired effect.
Remember, past performance does not guarantee future results.
Good Investing,
Jason Jenkins
Article by Investment U