Uranium Stocks – The Restricted Aussie Export That Could Make You Money

By MoneyMorning.com.au

“Mr Shorten said managers needed to do more to improve employee engagement to lift performance and productivity rather than just blame Labor’s Fair Work Act and the unions for their troubles.” – Australian Financial Review, 13 February

That’s rich. For a government to accuse the private sector of being unproductive.

It’s the old pot and kettle situation.

Governments are not only unproductive and inefficient, but thanks to their meddling they harm private sector productivity too.

The fact is most (but not all) businesses achieve success despite government meddling. Not because of it. And there are even some businesses that seem to revel in it.

Why? Because the potential reward is so great that even the pen-pushers can’t put them out of business.


In a moment we’ll discuss the devil-may-care industry that time and again has made investors big returns over the past 20 years.

But first…

Keeping Cheese In, And Rubbers Out


You only have to read the list of import and export restrictions to see the hoops Aussie firms have to jump through to stay on the right side of government red tape.

Want to export “cameras or imaging systems for use underwater”? Forget about it. Unless you’ve got a permit from Defence Department and the Department for Foreign Affairs & Trade.

What about butter, cheese or yoghurt? Make sure you’ve got a permit from the Department of Agriculture, Fisheries & Food (DAFF). Think of the turmoil if people started exporting butter without government say-so!

And if you’ve ever wondered why Australia doesn’t have a bigger presence in the “sausage casings” industry, maybe it’s because you need a meat permit from DAFF before you even think about flying the flag for Aussie sausage casings.

But it’s not just export regulations pinning down Aussie businesses. Be careful what you import too. You’ll be pleased to know the Aussie government restricts the import of “Erasers resembling food in scent or appearance”.

Australia is the last bastion in the fight against novelty erasers. (If you think we’re kidding, check out this link.)

No wonder so many Aussie firms are going bust and laying off workers.

Yet why is it some businesses can overcome these restrictions while others can’t?

The resources sector is a perfect example of a red-tape-beating industry. Australia has a bunch of resources in high demand. And there are few other major competitors. In fact, Australia has huge resources of pretty much every bulk and specialty commodity there is.

That’s not the same for other Aussie industries where there’s plenty of global competition.

And that’s what makes it harder for those industries to compete. It’s not because of extreme capitalists earning a fast buck at the expense of workers. But because high costs and red tape makes it hard for Aussie firms to compete.

But as we say, red tape doesn’t stop everyone.
There are entrepreneurs and capitalists willing to invest time and money in one of the world’s most controversial and restricted industries – uranium.

At face value, you’d have to be mad to even bother about looking for and producing uranium…

There’s the cost of finding a resource and proving it’s viable. There’s the cost and red tape to dig the stuff up. The environmental concerns. The limited list of countries you can export uranium to. And of course there are security concerns.

You’d think there would be an easier way to make money. And there is. But few other sectors provide as much bang for your buck as uranium.

Boom or Bust


When the uranium sector booms it booms. Uranium stock gains of 20%, 40% or 50% in just a few days aren’t uncommon. And over the past 20 years we’ve seen uranium stocks make big triple- and even quadruple-digit gains in months.

Put just $500 into a uranium stock before it booms and you could cash-out with $5,000 or more just a few months later. But, there is a flipside. When uranium stocks lose favour with investors, the bust is just as spectacular.

You only have to look at the long-term chart of two Aussie uranium stocks to see what we mean – Energy Resources of Australia [ASX: ERA] and Extract Resources [ASX: EXT]:

Energy Resources of Australia [ASX: ERA] and Extract Resources [ASX: EXT]
Click here to enlarge

Source: Google Finance


Bottom line: uranium stocks are a great way to make a bunch of money (if you get the timing right). And a great way to lose a lot of money if you get the timing wrong.

But at the moment, our old pal, Diggers & Drillers editor, Dr. Alex Cowie says it’s a great time to speculate on uranium stocks. To the extent he has two open tips on his recommended buy list for subscribers.

In a recent update he wrote:

“When things get sticky for oil, uranium starts looking like a better alternative. In the last few weeks, major uranium stocks have started to pick up significantly. Australia’s largest uranium stock, Paladin (ASX: PDN), is now up 30% since the start of the year. One of Canada’s majors, Uranium One (TSE: UUU) is up 29%.”

Is the rally over? Not according to the Doc. He says, “…institutional investors are recognising deep value in the sector, after prices were overly crucified in the wake of the Fukushima disaster last year.”
(There’s more from the Doc below.)

Add Uranium to Your Portfolio


It goes to show you that if the potential profits are good enough, no amount of government meddling and red tape will stop a good idea from making money. The uranium sector is proof of that.

Unfortunately, red tape ties up many other Aussie businesses. But they don’t have the benefit of big profit margins. Simply because in a competitive world where consumers and other businesses can buy a similar product elsewhere, Aussie firms just can’t compete.

So if you’re looking for a big winner, the secret is to punt on stocks where Australia has a competitive advantage. That remains what it has always been: the resources sector… and given current prices, and if the Doc is right, uranium stocks should be at the top of your buy list.

Cheers.
Kris.

P.S. Dr. Cowie says uranium stocks are great value at the moment. And even after some recent gains in the sector, both the Doc’s tips are still in the buy zone. If you’d like to check them out and register for a no obligation trial subscription, click here for details…

Related Articles

The Conference of the Year for Australian Investors

Will These Commodities Help You Claim The Best Investment Gains Of 2012?

Why Tungsten and Other Strategic Metals Could Prove Good Investments


Uranium Stocks – The Restricted Aussie Export That Could Make You Money

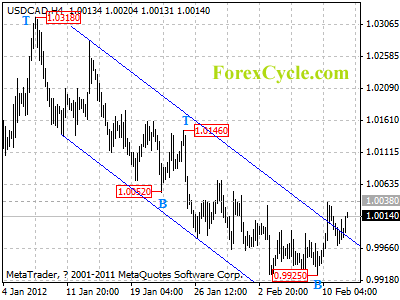
USDCAD pulled back from 1.0038

After breaking above the upper line of the price channel on 4-hour chart, USDCAD pulled back from 1.0038. Range trading between 0.9925 and 1.0038 would likely be seen in a couple of days. As long as 1.0038 level holds, the price action in the range could be treated as consolidation of the downtrend from 1.0318, and one more fall to 0.9800 is still possible. On the other side, a break above 1.0038 will confirm that the fall from 1.0318 had completed at 0.9925 already, then further rally could be seen to 1.0400 area.

usdcad

Forex Signals

Analyst Moves: ESV, WSO

Ensco (ESV) was upgraded today by Goldman Sachs (GS) from neutral to buy, as the firm believes that Ensco should be able to increase prices. Shares are higher by about one percent.

Bernanke Not Fooled by Recent Unemployment Gains

A survey released Friday by the Philadelphia Federal Reserve indicates a majority of the 45 economists invited to participate now believe U.S. unemployment will fall faster this year than previously expected. Those completing the study predict that unemployment will fall to 8.1 percent by the fourth quarter of 2012. A similar survey released this past November was considerably less optimistic with 8.7 percent expected to be the best that could be hoped for this year.

The change in outlook is understandable given the dramatic improvement over the past few months. Just over a year ago, unemployment was at 9.4 percent but as 2011 drew to a close, unemployment had fallen to 8.5 percent. The declining trend continued in January, with unemployment falling to a three-year low of 8.3 percent and it appears that February could bring even more employment gains.

For the first week of February, the U.S. Department of Labor said that the number of people applying for unemployment fell to a seasonally-adjusted 358,000 new applicants. This is the second-lowest level since April 2008 and is a decline of more than 15,000 applicants from the previous week.

Given the string of good news announcements, you would think U.S. Federal Reserve Chair Ben Bernanke would be smiling a bit more these days. But no, the Chairman continues to warn of rising unemployment even when most others believe the job market is improving. Does the Chairman know something the rest of us don’t? Or perhaps he just doesn’t believe the numbers.

In his testimony before the Senate Budget Committee last week, Bernanke said that even with an improving outlook, the U.S. economy will grow at a “sluggish” rate for the remainder of the year. The Fed continues to hold to its earlier outlook that growth will range between 2.2 percent and 2.7 percent for the year with unemployment between 8.2 percent and 8.5 percent by the final quarter of 2012.

Bernanke admonished the Committee saying “it is very important to look not just at the unemployment rate which reflects only people who are actively seeking work”. The term “actively” is key here and Bernanke as much as admits that the current unemployment rate is misleading as it does not include those who are “out of the labor force because they don’t think they can find work”.

Bernanke also cautioned that the ongoing Eurozone debt crisis has the potential to plunge the global economy back into recession. While Bernanke did not go so far as to say that a recession in the Eurozone is inevitable, it is clear that the Fed is erring on the side of caution acknowledging that a recession is a “possibility”.

What’s more, some Eurozone economies are clearly in recession already and should this spread to the entire region, the Fed warns that it anyone’s guess as to how long a recession may last and how much damage it could cause to the American economy.

Bernanke did adopt a more optimistic tone when discussing the efforts U.S. banks have made to reduce European exposure and protect assets. However, Bernanke still cautions that should the Eurozone slide back into recession, the U.S economy and financial system will “still be significantly affected”.

Scott Boyd is a currency analyst and a regular contributor to the OANDA MarketPulse FX blog


Facebook IPO: No Where to Go But Down?


Facebook IPO

Unless you’ve been living under a rock for the last few months, you know that Facebook has filed its initial paperwork with regulators for its initial public offering (IPO). And they’ve hired five underwriters for the job, with Morgan Stanley (NYSE: MS) taking the lead role.

The company is currently looking at a valuation of $75 billion to $100 billion, which would be one of the largest initial public offerings in U.S. history.

These Numbers Make No Sense…

Facebook generated $3.7 billion in revenue in 2011, and a nice $1 billion in net income. For those of us who truly value fundamentals: If Facebook goes public and hits its high end with a $100-billion market cap – that means it would have a P/E of 100 times trailing earnings.

Forbes took a look at what that number means and the rarified air that type of market cap puts you above. Look at the following companies and tell me Facebook should be worth more:

  • Boeing (NYSE: BA) – $57-billion market cap, $69 billion in revenue, $4 billion in profits.
  • Disney (NYSE: DIS) – $7- billion market cap, fiscal year September 2011 revenue of $40.9 billion and $4.8 billion in profits.
  • Hewlett-Packard (NYSE: HPQ) – $58-billion market cap, fiscal year October 2011 revenue of $127.2 billion, non-GAAP net income of $10.4 billion.

How Would You Make Money?

Your Mom is on Facebook. Your spouse is on Facebook. Your kid is on Facebook. To state the obvious, almost everyone is on Facebook. The company’s numbers say they have 845 million users each month and 483 million active each day. However, if you got in early, you should be worried whether the company can grow beyond this activity.

Could you double your money? There are less than 20 companies with a valuation that high. At $200 billion, the company would shoot past AT&T (NYSE: T), Procter & Gamble (NYSE: PG) and Johnson & Johnson (NYSE: JNJ), and roughly be on par with General Electric (NYSE: GE), Google (Nasdaq: GOOG), or Berkshire Hathaway (NYSE: BRK-A).

The Risk Involved

Remember that any slip-up after this IPO valuation will cause a decrease in value. And their S1 actually makes points of what could cause this hiccup.

Here are a few points that they brought to light that could hurt or slow growth in the future:

  • If we fail to retain existing users or add new users, or if our users decrease their level of engagement with Facebook, our revenue, financial results and business may be significantly harmed.
  • We generate a substantial majority of our revenue from advertising. The loss of advertisers, or reduction in spending by advertisers with Facebook, could seriously harm our business.
  • Our business is highly competitive and competition presents an ongoing threat to the success of our business.
  • Improper access to or disclosure of our users’ information could harm our reputation and adversely affect our business.
  • Our business is subject to complex and evolving U.S. and foreign laws and regulations regarding privacy, data protection and other matters. Many of these laws and regulations are subject to change and uncertain interpretation, and could harm our business.

So let’s not look at this initial public offering as the cool new platform that all of our family friends use that will be around forever. View the Facebook IPO by the numbers, and the pros and cons that could happen after this initial market capitalization. It can still grow and evolve and be successful. But if its success isn’t over-the-top, you’re going to lose money if you get in early.

Good Investing,

Jason Jenkins

Article by Investment U

Is the Debt Crisis In Europe Spreading to the U.S.?


This just in: Government dependency is growing…

A CNN article about the expansion of government assistance first clued us in to the fact on February 7. The following day, the Heritage Foundation, a conservative think-tank, published a total of 18 extremely disturbing economic charts on the subject.

And from there, Business Insider, Investor.com and a slew of other websites and commentators picked up the story, broadcasting the fact that government dependency is on the rise.

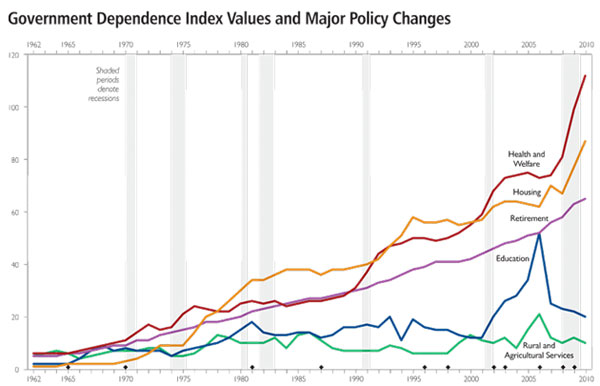
Really, that’s not exactly shocking news considering the exponentially expanding government debt and deficit, not to mention dramatically visible societal shifts in the past few decades. But the problem becomes even more obvious when looking at Chart 11 of the Heritage Foundation’s list:

eurozone debt crisis

Source:
http://www.heritage.org/research/reports/2012/02/2012-index-of-dependence-on-government

Since the Great Society – which included the creation and implementation of Medicare, Medicaid, the Higher Education Act, and the Department of Housing and Urban Development – was first formed under President Lyndon B. Johnson in 1965, people have grown more and more attached to what many call the “nanny state.”

A nanny state assumes responsibility for its citizens’ well-being right down to their food, clothing and income if it deems necessary. Essentially, it’s one of those nice ideas that just doesn’t pan out in the long run, as evidenced by the ongoing turmoil in Europe.

Europe: The Definition of “Unsustainable”

Ironically enough, it was allegedly a European, British Parliament member Iain Macleod, who first coined the term “nanny state” back in 1965.

In 1965, that form of government had already long since taken root in England and mainland Europe. But since then, it has grown enormously.

According to Visual Economics, Germany spends 17.9% of its GDP on public healthcare and another 10.5% on education services, adding up to well over a quarter of its financial intake. France spends 16.7% and 11.4% respectively (28.1%), the U.K. spends 16.3% and 11.5% (27.8%), Spain spends 15.5% and 11.3% (26.8%), and Italy spends 13.2% and 10.3% (23.5%).

Add in unemployment benefits, housing, cash benefits, personal social services and various grants depending on the country, and that tally hikes up a lot higher. And that’s all on top of more traditional government spending on infrastructure, the military, public protection in the form of police and firemen, and government employee pay, as well as international aid and global organizations such as the United Nations.

Put it all together and you get the Eurozone debt crisis, complete with financial headaches, very real threats of default and rioting in the streets, as the world repeatedly saw in Greece, Italy, Spain and the U.K. last year… and will undoubtedly see again in 2012.

Nice idea though it is, nanny statism is flat-out unsustainable. And Europe proves it.

The United States of Dependency

The United States is no lightweight when it comes to spending, either, of course. It just happens to be in a slightly more advantageous position at this point for a few different reasons, including:

  • The dollar is still the world’s official reserve currency.
  • The U.S. didn’t turn to nanny state policies quite as quickly or drastically as Europe and therefore has – or used to have – a larger percentage of workers to draw revenue (i.e. taxes) from.
  • The U.S. government only has to fight with itself in order to get anything done whereas, in the Eurozone’s case, there are multiple governments involved, complete with multiple interests and agendas.

All the same, those factors can only go so far when the United States is set on spending $13.2 trillion per year, as it budgeted for in 2008, but bringing in less than $5 trillion. And that difference has only gotten worse since.

As the Heritage Foundation explained before introducing its 18 charts, “Annual deficits far greater than the government’s revenue are fueling explosive levels of debt. One such significant area of rapid growth is those programs that create economic and social dependence on government.”

Every new American added to the list of government dependence (around 45% in some form or another), brings the United States that much closer to becoming the next Europe… and that isn’t something we want to see.

Good Investing,

Jeannette Di Louie

Article by Investment U

Traders cautious ahead of meeting of European leaders tomorrow


By TraderVox.com

The euphoria over the Greek deal was short lived today with limited reaction from the market. The Euro has given up all the gains of the day due to cautious approach of the traders. The cautious approach is due to many aspects need clarification. It is still trading above the 1.3200 levels at 1.3218, marginally in the green for the day. The support may be seen at 1.3200 and below at 1.3150. The resistance may be seen at 1.3250 and 1.3325.

The sterling pound is also marginally trading in green and given up the gains of the day. It has retracted from the high of 1.5826 and is currently trading below 1.5800 levels at 1.5780 just 5 pips above its opening price of the day. The support may be seen at 1.5750 and below at 1.5700. The resistance may be seen at 1.5800 and 1.5825 levels.

After trading mostly in red during the day, USD/CHF is going towards its opening price and towards the high for the day of 0.9159. The support may be seen at 0.9000 and below at 0.9070. The resistance may be seen at 0.9150 and above at 0.9200. The pair is currently trading at 0.9150, almost flat for the day.

The USD/JPY pair has turned into the red and is currently trading at 77.49, 5 pips down the opening price of 77.54. The support may be seen at 77.30 which is a strong support and the resistance may be seen at 78.

The Australian dollar gained levels during the European session to the high of 1.0777. But it failed to hold on to these gains and is currently trading below 1.0750 at 1.0736, still up almost half a percent. The resistance may be seen at 1.0775 and 1.0800. The support may be seen at 1.0700 and below at 1.0650/60. The 1 hour chart is making the lower lows since the late European session. The bias remains bearish.

The US dollar index is gaining the levels and is approaching the 79 levels. It is currently trading just shy of 79 at 78.98. Tomorrow is an important day for the single currency as European leaders will meet to decide the Greek deal. 

Article provided TraderVox.com
Tradervox.com is a Forex News Portal that provides real-time news and analysis relating to the Currency Markets.
News and analysis are produced throughout the day by our in-house staff.
Follow us on twitter: www.twitter.com/tradervox