Why Investors Need to Know About Neodymium

Why Investors Need to Know About Neodymium

by David Fessler, Investment U Senior Analyst
Monday, January 02, 2011

Financial markets seem to hang on every meeting, every statement and protest coming out of Europe these days. The PIIGS (Portugal, Ireland, Italy, Greece and Spain) are wallowing in too much debt. Germany and France are reluctant to throw good money down a rat hole to bail them out.

The world’s economies and financial markets are in a constant state of limbo. They’re all on hold, waiting to see how it’s all going to play out. Here in the United States, we’re consumed with who’s going to get elected next November.

But there’s an even bigger problem looming that seems to get very little press these days. It’s beginning to affect nearly every sector. And it will have far-reaching impacts on global consumers and manufacturers alike.

I’m talking about the growing shortage of rare earth elements (REEs). These 17 special materials have properties that make them essential for today’s consumer, military and medical sectors.

China has announced that it’s cutting production to 70 percent of today’s current output by 2015. This is after previously announced cuts in production and numerous price increases. Currently, China produces over 90 percent of all REEs in the world.

In a recent report, Roskill, an international metals and minerals research firm, said most of China’s future production would go to Chinese manufacturing companies.

That leaves scant REEs for the rest of the world. There are a few companies outside of China that are scrambling to makeup the looming shortfall in demand. Even with their 2015 production projections of 56,000 tons, these precious elements will still be in short supply.

Reaction has been quietly swift: U.S. Representative Michael Coffman, (R-Colorado), calls China “an unreliable trading partner.” He thinks companies and governments around the globe should begin to stockpile REEs.

The logic is sound, but the problem is the REEs he’s talking about have to come from China, which is already not producing enough to satisfy global demand.

To make matters worse, China will be announcing its 2012 production quantities, and more importantly, how much it plans to export. Many experts believe both numbers will be cut yet again.

Golden Opportunity for Investors

One of the main drivers for rare earths is neodymium. It’s used primarily to produce magnets used in electric motors for EVs and for powerful electric generators in wind turbines. Those applications will continue to be the top use for this REE in 2015, according to the Roskill study.

The convergence of seemingly endless demand, with a supply chain that still won’t be caught up to demand three years from now, spells opportunity with a capital “O” for investors willing to jump in now.

It won’t be a long wait either, especially if China cuts exports again. But not every company is worthy of your investment dollars.

Australia’s Lynas Corporation Ltd. (PINK: LYSDY) is one of a few companies that’s slated to come online next year with REE production.

Investors who want to be onboard the REE gravy train could consider an early investment in Lynas shares. But with the markets on a rollercoaster ride, be prepared for wild swings in share prices.

A few years from now, your patience will likely be rewarded in spades.

Good Investing,

David Fessler

Article by Investment U
The Best Buy Signal of 2012

The Best Buy Signal of 2012

by Alexander Green, Investment U Chief Investment Strategist
Monday, January 02, 2012: Issue #1677

Investors are scared right now and it’s not hard to see why.

Economic growth is anemic. Unemployment is high. Banks are saddled with toxic assets. Problems in the Eurozone continue to fester. Residential real estate is sinking in a mire of short sales and foreclosures. And both federal and state governments – not to mention consumers themselves – are drowning in a sea of red ink.

We have all heard these negatives repeated daily and cycled endlessly in the national media.

However, these reports often leave out or play down the good news: Inflation is low. Short-term rates are near zero. Energy and food prices are declining. Emerging market economies – which are end markets for the developed world – are still booming. Corporate profits are at an all-time record – and have been for seven quarters now. And stock valuations are low. (The S&P 500 has historically traded at an average of 16 times earnings. Today it’s less than 14 times earnings.)

Last year I shared another key insight with you. It has always been a positive indicator for stocks when the Dow yields more than Treasury bonds.

This makes sense when you think about it. Shares are riskier than bonds. Investors should demand a higher yield. Yet almost never since 1958 have stocks yielded more than Treasuries. Today they do, however. The 10-year bond yields just two percent. The Dow yields 30 percent more.

If you’re still not convinced that equities are a good place to be in 2012, let me draw your attention to one of the strongest indicators of all…

Contrarian Investing Works

It’s a truism that no one consistently predicts the stock market. (That’s why money manager and Forbes 400 member Ken Fisher calls it “The Great Humiliator.”) However, there’s a straightforward system that offers a reasonable prospect of timing the market reasonably well in the future.

A 25-year study published last year in The Journal of Financial Economics found that if you had simply invested in the S&P 500 when equity fund flows were negative (redemptions exceeded new investments) and into 90-day Treasury bills when fund flows were positive (new investments exceeded redemptions) you would have substantially outperformed the market while spending nearly half the time in riskless T-bills.

In other words, contrarian investing works. This system would have you do the very inverse of what the great mass of investors is doing. (It turns out they have god-awful instincts, so it pays to buck the consensus.)

Bear in mind, if you’d followed this system, you wouldn’t just have earned higher returns than being fully invested. You would have done it with far less risk, spending nearly half the time in riskless T-bills.

I mention this because the Investment Company Institute recently reported that investors are yanking billions out of equity funds virtually every week and pouring the money into ultra-low-paying money market accounts. The Wall Street Journal further reports that “investors have continued to consistently pull money from U.S. equity funds since August.”

I’m trying to contain my glee. Who says no one rings a bell in the stock market?

The fear and pessimism about both the economy and the stock market are way overdone and fully discounted in current stock prices. If you can’t be stirred by low interest rates, low inflation, low valuations and record profits, you really should ask yourself two important questions:

1. Is logic or emotion governing my decision making about my portfolio?

2. If I don’t invest in stocks – the greatest wealth creator of all time – how am I going to meet my long-term financial goals?

We’ll talk more about these issues in the weeks ahead. But, for the record, I think 2012 will be a good year for the stock market and – although virtually no one expects or believes it – perhaps even a barnburner.

Good Investing,

Alexander Green

Article by Investment U

Currencies: Forex Futures Speculators push Euro shorts to new record level

By CountingPips.com

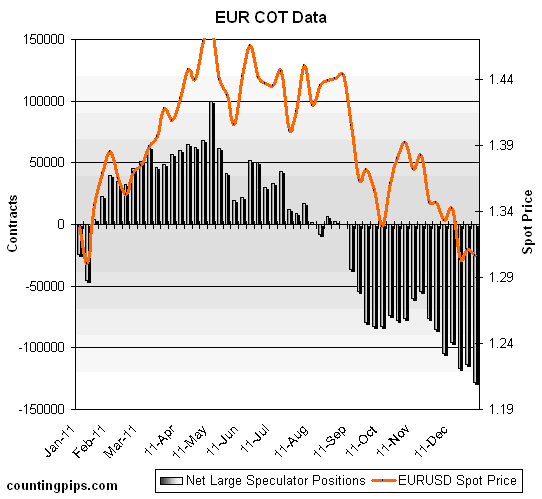
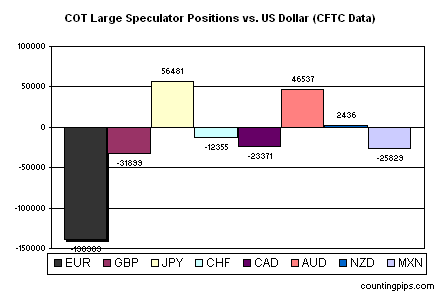
The latest Commitments of Traders (COT) report, released on Friday by the Commodity Futures Trading Commission (CFTC), showed that large futures speculators added to their overall long bets for the US dollar last week against the other major currencies while Euro short positions rose and ascended to a new record level as sentiment for the European common currency continues to deteriorate.

Non-commercial futures traders, usually hedge funds and large speculators, increased their total US dollar long positions to $20.35 billion on December 27th from a total long position of $17.63 billion on December 20th, according to the CFTC COT data and calculations by Reuters which calculates the dollar positions against the euro, British pound, Japanese yen, Australian dollar, Canadian dollar and the Swiss franc.

EuroFX: Currency speculators added to their Euro short positions as of December 27th and pushed their short bets to a new record high surpassing the previous one registered on December 13th. Euro short positions decreased to a total of 127,879 net contracts from the previous week’s total of 113,697 net short contracts.

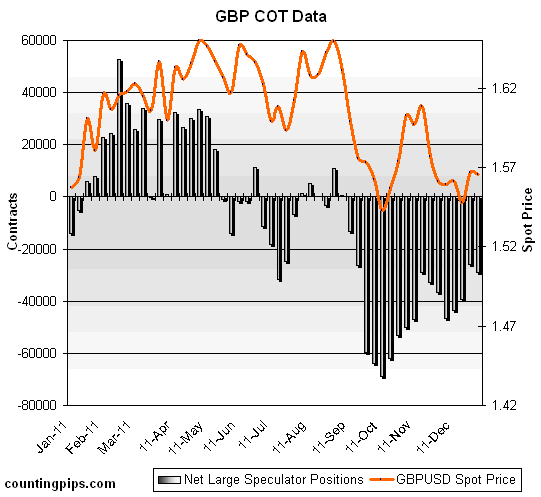
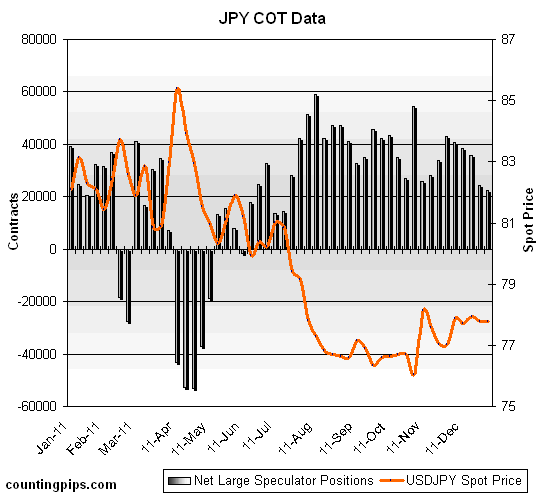
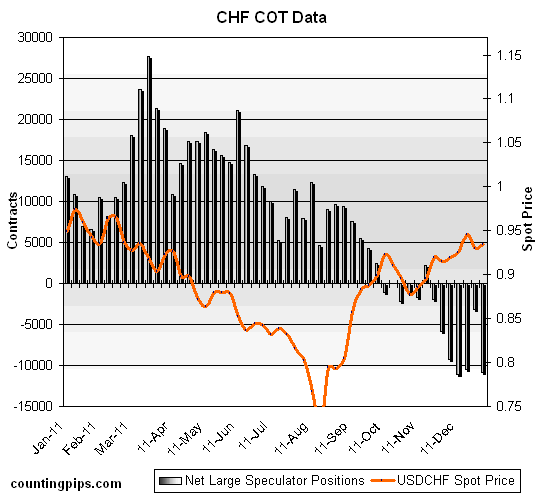
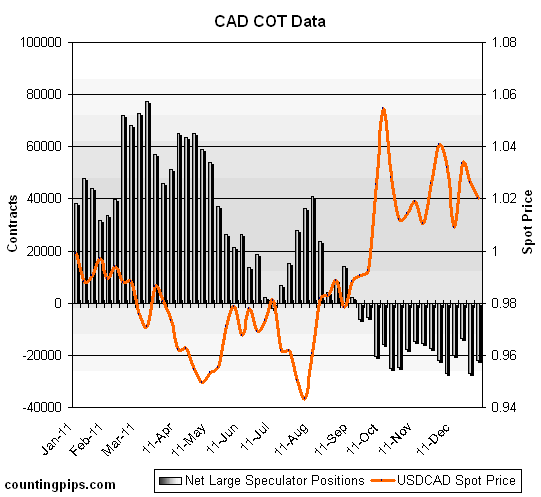
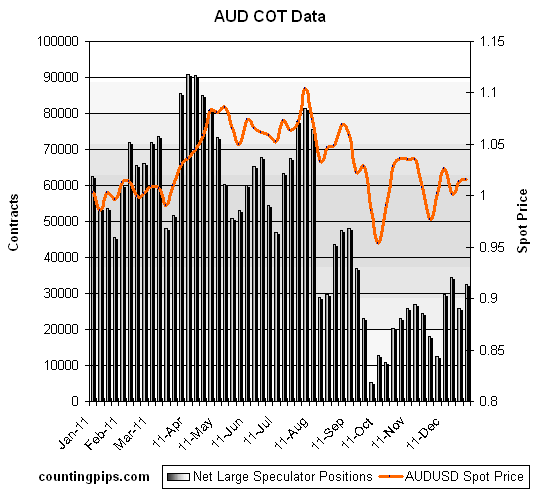
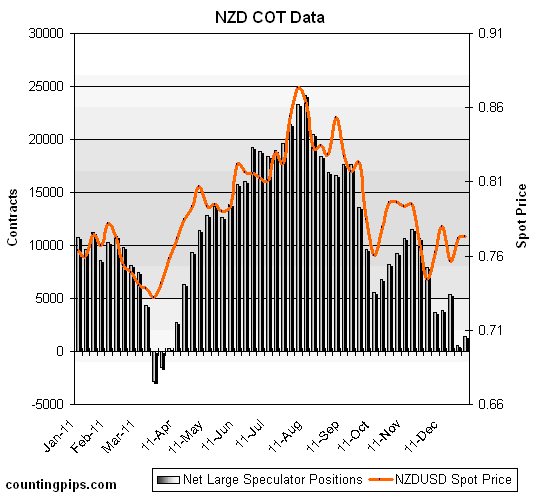
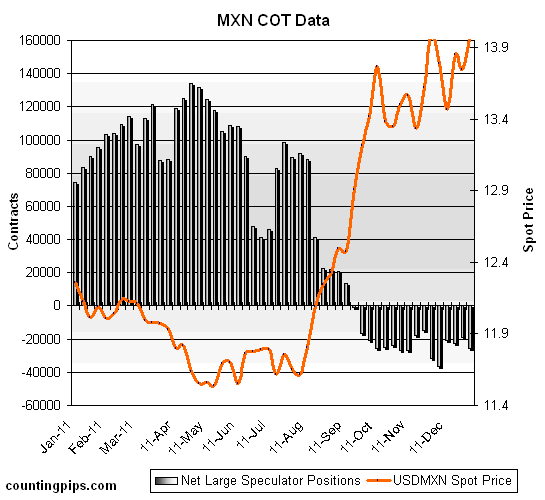
The COT report is published every Friday by the Commodity Futures Trading Commission (CFTC) and shows futures positions as of the previous Tuesday. It can be a useful tool for traders to gauge investor sentiment and to look for potential changes in the direction of a currency or commodity. Each currency contract is a quote for that currency directly against the U.S. dollar, where as a net short amount of contracts means that more speculators are betting that currency to fall against the dollar and net long position expect that currency to rise versus the dollar. The graphs overlay the forex spot closing price of each Tuesday when COT trader positions are reported for each corresponding spot currency pair.

GBP: Bearish bets of the British pound sterling increased as of December 27th after declines for three consecutive weeks through December 20th. British pound positions saw a total of 29,172 short positions on December 27th following a total of 25,939 net short positions registered on December 20th.

JPY: The Japanese yen net long speculative contracts edged lower in fell for a fifth consecutive week as of December 27th. Yen long positions declined to a total of 20,585 net long contracts reported on December 27th following a total of 24,476 net long contracts that were reported on December 20th. Yen speculative positions are at their lowest level since July 5th when long positions registered 14,327 contracts.

CHF: Bets in favor of the Swiss franc decreased as of December 27th after seeing improvement for two consecutive weeks. Speculator positions for the Swiss currency futures fell to a total of 10,798 net short contracts on December 27th following a total of 3,136 net short contracts as of December 20th.

CAD: Canadian dollar positions improved to a total of 20,812 net short contracts as of December 27th following a total of 26,868 short contracts reported on December 20th. CAD speculators have continued to have a bearish position against the US dollar since September 6th when contracts were last bullish with a total of 2,081 long contracts.

AUD: The Australian dollar long positions rose as of December 27th after declining the previous week. Australian dollar positions increased to a total net amount of 32,637 long contracts on December 27th following a total of 25,742 net long contracts reported as of December 20th. The AUD speculative positions on December 13th had reached their highest level since September 13th when Australian dollar long positions totaled 36,934.

NZD: New Zealand dollar futures speculator positions edged slightly higher after last week’s fall to just about a neutral position against the US dollar. NZD contracts increased to a total of 1,405 net long contracts as of December 27th following a total of 612 net long contracts registered the previous week. NZD contract’s show a slightly bullish position against the USD and are up from the previous week’s standing which was the lowest position since March 29th when positions equaled 239 long contracts.

MXN: Mexican peso contracts declined against the US dollar as more speculative traders chose to short the Mexican currency. Peso short positions rose to a total of 25,685 net short speculative positions as of December 27th following a total of 18,802 short contracts that were reported on December 20th.

COT Currency Data Summary as of December 27, 2011
Large Speculators Net Positions vs. the US Dollar

EUR -127879
GBP -29172
JPY +22585
CHF -10798
CAD -21812
AUD +32637
NZD +1405
MXN -25685

Other COT Trading Resources:

Trading Forex Using the COT Report


What to Expect in 2012: Trading the News

Before developing a trading strategy, traders should be familiar with event risks that heavily impact the Forex trading market. During normal market conditions, shifts in government policy along with economic developments tend to drive market action, and being able to identify the key event risks can help avoid being on the wrong side of the market.

Have a Plan

There are a few strategies that you should think of us when trading news events. There is a caveat, finding the style that fits one’s trading personality and then tailoring it to meet different needs can help curb the risk for loss and at the same help to possibly profit from market volatility. Some strategies involve setting up entry orders ahead of the event risk, while others are based on mathematical calculations. All require prudence and flexibility given the inconsistency in market reaction. One must recognize that at times, the best move can be to stand aside when traders show a muted reaction to the news or when the market turns choppy.

Trading News Events

Trading major US news events has been in 2011. This has been given due to the strong correlation between the US dollar and risk, but these dynamics may break down in the following year as the fundamental outlook for the world’s largest economy improves. Indeed, the Fed’s zero interest rate policy has been one of the culprits behind the risk driven market this year. We expect to see fundamentals playing an increased role next year as the central bank eases its dovish tone for monetary policy. As the economy speeds it recover up, this limits the Fed’s scope for another large scale asset purchase program. This means we should see the FOMC carry out ‘Operation Twist’ in 2012, and the central bank may end its easing cycle in the following year as economic activity gradually strengthens. As the risk of seeing QE3 wanes, fundamental developments might have a greater impact on the dollar’s exchange rate. The market reaction should be even more straight forward in the following year as the Fed begins to put an end to the speculation for additional monetary support.

The economic docket for the week of 2012 is expected to include the all important US Non-Farm Payrolls. We are expecting this to be increasing another 150K in December. The ongoing improvement in the labor market should support the Buck. However, if the FOMC minutes due on Tuesday might shake up the currency market. These minutes could cause investors to weigh the prospects for monetary policy. We might see the Fed raise its fundamental assessment for the region and the central bank may endorse a wait and see attitude throughout the first-half of 2012 as the sovereign debt crisis dampens the outlook for the world economy. This could mean that Bernanke may preserve a cautious outlook for the US, but we may see him curb expectations for another round of QE as the economy revolves around a double-dip recession.

for more information on stock trading you can visit Avafx.com – for information on forex broker you can visit zforex.co.uk

you can also learn forex trading or use exchange rate calculator

DISCLOSURE & DISCLAIMER: THE ABOVE IS FOR INFORMATIONAL PURPOSES ONLY AND NOT TO BE CONSTRUED AS SPECIFIC TRADING ADVICE. RESPONSIBILITY FOR TRADE DECISIONS IS SOLELY WITH THE READER.  FOR MORE INFORMATION AS WELL AS UP TO DATE FOREX ANALYSIS VISIT US AT FX-INSIGHTS.COM – FOREX NEWS


AUD/CAD Weekly outlook – 02 January

AUD/CAD Weekly outlook – 02 Jan 06 Jan

With the last week of the year historically favoring ‘quieter’ trading conditions with lower volume & volatility it was surprising to see the last day of the trading year providing some movement and direction. The Aussie gained ground over the Cad in late trading, eventually closing up 130pips from its week lows.

The weekly and monthly charts both suggest the bullish bias to continue with both closing as strong inside bullish pin bars.

In the weekly chart below we can see the market closed the week with yet another inside bar (the 4th in a row). With 3 of the 4 bars being bullish pin bars the bulls look to be in charge of this market. Upper resistance comes in at 1.0530 which coincides with the outside bars highs. Should we see a break, close and hold above this area we could expect the market to continue to highs at 1.0664 and possibly beyond.

Something to take note of is the gap which has yet to be filled from late November. It’s uncommon for the market to leave a gap open for an extended period of time which may hold back any bullish movement (at least for the short term).

audcaddailyoutlook02jan2012

The monthly chart below further strengthens out bullish bias for the pair. The market has been in a bullish trend for a long period of time and has formed a ‘stepping’ pattern with a series of: L, H, HL, HH, HL, and HH. The last two months have also closed as bullish pin bars with December closing inside Novembers range.

audcaddailyoutlook02jan2012monthly

We will be waiting for a 50% retracement of the weekly pin bar and looking to enter on limit using the Daily and 4hr charts to define our entry. Stops could be placed at last weeks lows, or a more conservative approach could be to place a stop at the bottom on November’s gap. Initially we will look to target the markets highs at 1.0664 with further gains in sight.

Article by vantage-fx.com

2012 Preview (Continued) – Examining the Major Issues

Source: ForexYard

As we approach New Years we’ll attempt to address the major issues for 2012.

Economic News

CAD – Loose BoC Monetary Policy to Weigh on CAD

A worsening global economic background does not bode well for the CAD. Economists have begun to downgrade their 2012 Canadian outlook and GDP forecasts as the gloom from Europe spills over into Canada. This hints that the BoC will loosen monetary policy in Q2 as events outside of Canada begin to influence the local macroeconomic outlook. Continued declines in commodity prices may also have a negative effect on the CAD. Since its peak in April the Thomson Reuters/Jefferies CRB Commodity Index has declined 17.8%. Crude oil prices have risen to close out the year near the $100 level, though any drop in prices will likely limit CAD gains. Perhaps in H2 the CAD will perform well should global growth and risk sentiment bounce back.

GBP – AAA Rating Won’t Save Sterling

Sterling is caught between a rock and a hard place. On one had the GBP continues to receive strong inflows due to the European debt crisis. The rejection of the new euro zone pact by Prime Minister David Cameron and the UK AAA rating support continued real money flows. The safe haven status of the GBP is highlighted by the yield on the 10-year gilt falling to a record low under the 2% level.

However, the UK economy continues to struggle. 2012 growth forecasts have been revised lower by both the Bank of England and the government. The BoE expects inflation to fall sharply over the course of the year with the risk of deflation creeping into the UK economy. The reversal of price pressures looks to have begun as headline inflation may have topped out in September at 5.2%. Thus the BoE is set to begin another round of quantitative easing (QE) in Q1 which will likely weigh on the GBP.

AUD – Interest Rate Differentials to Drive AUD

Investors continue to prefer commodity currencies despite the decline in commodity prices. Since its peak in April the Thomson Reuters/Jefferies CRB Commodity Index has declined 17.8%, while the AUD/USD has declined by only 7%. The tepid decline in the value of the AUD/USD also comes in the face of the European debt crisis and a slowing Chinese economy. Thus we may assume that investors continue to buy the AUD based on interest rate differentials and perhaps the country’s AAA credit rating.

The RBA has cut interest rates in their previous two consecutive meetings though rates currently stand at 4.25%, more than 175 bp above the next G-10 currency the NZD at 2.50%. The interest rate differential is still remarkable. While a continuation of the European debt crisis may weigh on the higher yielding AUD, should positive market sentiment return there may be a return of the carry trade, fueling further support for the AUD.

Gold – Gold is Not a Safe Haven Asset

If there are two things that investors have learned this year it is the Middle East is a hotbed for instability and gold is not a safe haven asset. Since reaching its high in September spot gold prices have fallen 18%. The outlook for gold can be tied into expectations for the euro zone. Should investors begin take a more desperate position for the fate of the EUR, spot gold prices are likely to suffer as well. It should also be noted that the price of spot gold has broken its long term uptrend from October 2008.

Technical News

EUR/USD

Technical indicators are showing that the pair may see an upward correction this week. The Relative Strength Index on the weekly chart has entered the oversold region, while the Stochastic Slow on the same chart has formed a bullish trend. Taking a bullish long term trend may be a wise choice.

GBP/USD

Most long term indicators show this pair trading in neutral territory, meaning that major market movements are not expected this week. That being said, the Williams Percent Range on the weekly chart is creeping toward the oversold region. Should the indicator fall below the -90 level, it may be a sign for traders to go long in their positions.

USD/JPY

Following the bearish trend late last week, technical indicators are showing that the USD/JPY may be due for an upward correction this week. Daily chart indicators, like the Relative Strength Index and Stochastic Slow, are showing the pair in the oversold region. Going long this week may be a wise strategy for the pair.

USD/CHF

Following the slight upward movement the USD/CHF experienced last week, technical indicators are showing that the pair may turn bearish in the coming days. The Williams Percent Range on the daily chart is creeping toward the -20 level. Should it go above this level, it may be a sign that the pair will stage a downward correction. Traders will want to keep an eye on the daily and weekly chart for further signs of bearish movement.

The Wild Card

GBP/AUD

Technical indicators are showing that this pair may see a bullish correction in trading today. The Relative Strength Index on the 8-hour chart has dropped into the oversold region while the Williams Percent Range on the daily chart is currently right around the -90 level. Forex traders may want to go long in their positions today before the upward breach takes place.

Forex Market Analysis provided by ForexYard.

© 2006 by FxYard Ltd

Disclaimer: Trading Foreign Exchange carries a high level of risk and may not be suitable for all investors. There is a possibility that you could sustain a loss of all of your investment and therefore you should not invest money that you cannot afford to lose. You should be aware of all the risks associated with Foreign Exchange trading.


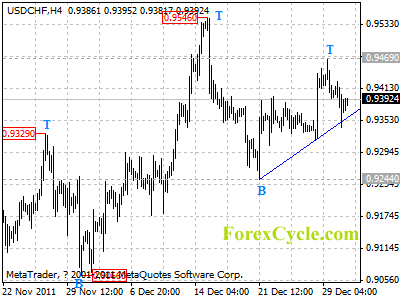
USDCHF stays above a upward trend line

USDCHF stays above a upward trend line on 4-hour chart, and remains in uptrend from 0.9244, the fall from 0.9469 would possibly be consolidation of uptrend. Another rise to test 0.9546 is expected, a break above this level could signal resumption of the longer term uptrend from 0.8569 (Oct 27 low). Support remains at the uptrend line, only a clear break below the trend line could indicate that lengthier consolidation of uptrend is underway, then the pair will find support around 0.8850.

usdchf

Daily Forex Analysis

Chinese Leaders Comment on 2012 Monetary Policy

Top Chinese officials have recently made public comments on the direction of monetary policy in China for 2012.  China’s President, Hu Jintao, said in his New Year speech: “We will continue to properly deal with the relationship among maintaining a stable and relatively fast economic growth, adjusting economic structure and managing inflation expectations.”  Meanwhile, People’s Bank of China Governor, Zhou Xiaochuan said the PBOC “will continue the prudent monetary policy and maintain the continuity and stability of its policies.”

The People’s Bank of China raised interest rates a total 75 basis points last year, and the required reserve ratio (RRR) by 300 basis points in the first half of the year, with one 50 basis point reduction in the RRR in December.  At the PBOC’s fourth quarterly monetary policy committee meeting, the committee emphasized recent domestic and international economic developments and their impact on continued implementation of prudent monetary policy, and the use of counter-cyclical monetary policy and macro-prudential tools.

Also, in acknowledgement to signs of stress in the domestic economy, such as social finance, local government debt, and falling house prices, Zhou Xiaochuan said: “Systematic financial risks will be effectively prevented to promote the healthy and fast development of the national economy,”.  The PBOC governor also noted “while keeping a reasonable social financing growth, the bank will also optimize the lending structure, deepen financial reforms and improve foreign exchange management.”
On the numbers, China has seen annual CPI inflation fall from a high of 6.5% in July 2011, to as low as 4.2% in November.  Meanwhile GDP growth slowed to 9.1% in the September quarter, from 9.7% in the March quarter; most commentators expect the Chinese economy to grow about 8% in 2012.  The Chinese Yuan (CNY) has appreciated by about 4.5% in 2011 against the US dollar, with the USDCNY exchange rate now trading around 6.30.