Silver Technical Analysis 7/1/12

Silver Technical Analysis Update

Guest post from www.forex-fx-4x.com; free trading analysis

  • The price action on Silver has yet again formed support around the 26.00 area on an attempt to move lower.
  • The monthly gain to date is 3.16%.
  • 61.8% Fib ret of 8.48 – 49.77 is located at the 24.35 and may come into focus on a sustained break of the key 26.00 support level.
  • Upside targets include the previous price pivot around 30.80 and the pronounced 32.30 swing low from 8/5/11.
  • The highlighted series of lower highs is someyimes indicative of lack of sustained selling interest on each bounce from support and could potentially be hinting towards a break of key support.  A sustained move above the 25.66 (23/10/11) daily high would invalidate this lower high analysis.

Silver Daily Chart

silvertechnicalanalysis20120107 1128 thumb Silver Analysis Update – Jan 2012

Any information or views found in this post are provided for educational reasons and do not in any way represent investment advice. The article author doesn’t guarantee the accuracy or completeness of this or any other information provided. Forex-FX-4X or the post authors will not accept liability for any losses arising directly, indirectly or because of reliance on any of the trading setups or associated analysis in any way.


Chart: 2012’s Fastest Growing Nations Will Be…

Chart: 2012′s Fastest Growing Nations Will Be…

by Mike Kapsch, Investment U Research
Sunday, January 8, 2011

If you were to ask me to predict the two fastest-growing economies in 2012, two nations I probably wouldn’t mention are Libya and Mongolia.

Yet that’s exactly what The Economist’s Intelligence Unit forecasts will happen…

gdp forecast by country

Libya is set to be the world’s fastest-rising economy in 2012 with a GDP growth rate of 22%. And Mongolia is set to place second with a growth rate of 15%.

Have The Economist experts gone crazy?

It was just October of last year that Colonel Muammar Qaddafi was killed. And I haven’t seen many headlines about Mongolia’s booming economic growth outside of Investment U.

A Closer Look At Libya and Mongolia’s Rapid Growth

The Economist claims, “Libya’s economy will grow faster than any other in 2012 boosted by reconstruction following the fall of Muammar Qaddafi’s regime. The surge is a bounce-back from an even more precipitous slump while war raged.”

Last year, Libya’s civil war cost the country tens of billions of dollars and thousands of lives. Yet Qaddafi’s falling out signifies a new chapter. Libya has $60 billion in sovereign funds to invest in infrastructure, housing and other constructive avenues starting this year. Not to mention, high oil revenue and a population of just 6.3 million give Libya one of the highest GDPs per capita in Africa.

Mongolia, on the other hand, is benefiting from a massive coal and copper mining boom. According to the International Monetary Fund, the country’s economy could expand at almost 23% in 2013. But the IMF also warns investors need to be weary of Mongolia’s inflation rate, currently up around 12.6 percent.

Good Investing,

Mike Kapsch

Article by Investment U

Global Interest Rate Movements in 2011

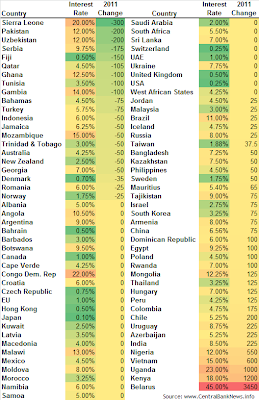
This article reviews the monetary policy interest rate activity of the world’s central banks during 2011.  The major theme of the year was monetary policy tightening, but the second half of the year featured many banks opting to reverse course or switch to outright net loosening.  Indeed of the 87 central banks that Central Bank News monitors, 34 made net increases to their interest rates, while 32 held their rates net unchanged, and 21 made net reductions to their policy interest rates, many of these in the second half of the year (see: Global Interest Rate Movements: Half-Year Review).


Of the central banks that net increased their interest rates, the average increase was 281 basis points (skewed up by Belarus; the average would be 185 excluding Belarus).  There were 18 central banks tightening by 100 or more basis points.  The outliers were Belarus 3450bps, Kenya 1200bps, and Uganda 1000bps.  Of those tightening rates, it was largely emerging and frontier markets, with inflation pressures running high on the back of rising food commodity prices and relatively buoyant economic conditions, particularly in the early part of the year.

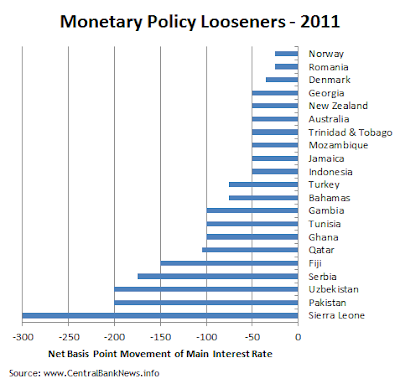
There were relatively few central banks cutting interest rates, but of those that did, most made the move in the second half of the year as signs of slowing global growth started to show.  However the European sovereign debt crisis was perhaps the most poignant reason for loosening policy settings; with a few central banks opting to take a precautionary or preemptive move e.g. Australia.  The average interest rate cut among those to net-loosen monetary policy was 96 basis points.

So while the second half of the year saw increasing loosening of monetary policy, the major theme of the year in monetary policy was tightening.  Much of the policy tightening went on in emerging markets where inflation has been pushed above inflation targets due to rising global commodity prices and strong economic growth and activity levels (i.e. both demand pull and cost push).  The year also saw some non-conventional monetary policy moves (as noted in: Top 10 Most Extreme Monetary Policy Moves of 2011).

The course of monetary policy in 2012 will be highly dependent on the course of global growth, but especially the resolution or otherwise of the European sovereign debt crisis.  Though with signs that inflation is peaking in some of the key emerging markets, and slowing global trade, it is likely that the first half of 2012 will be dominated by monetary policy loosening.  At the same time, this could well turn to tightening in the second half; particularly as economies begin stabilize, policy stimulus flows through, and inflationary pressures begin to re-emerge.

Whatever the course of interest rates in 2012, keep checking the website for regular and comprehensive global monetary policy updates.

Source: www.CentralBankNews.info

Article source: http://www.centralbanknews.info/2012/01/global-interest-rate-movements-in-2011.html

National Bank of Ethiopia Cut Reserve Requirement 500bps

The National Bank of Ethiopia cut the minimum deposit reserve ratio by 500 basis points to 10% from 15% previously, the Bank also cut the liquid assets to deposits ratio by the same margin to 20 percent from 25 percent previously.  The move is aimed to encourage banks to lend money, particularly to the export sector.  Ethiopia reported annual consumer price inflation of 39.2% in November. According to IMF statistics Ethiopia saw inflation of 10.5% in 2010, and economic growth of 6.96%, the IMF forecasts growth to average about 8% out to 2015, and inflation 6%.  Ethiopia’s currency, the Ethiopian Birr (ETB), weakened about 2% against the US dollar last year, while the USDETB exchange rate last traded around 17.29.

2012 Tech Preview: Connected Cars

2012 Tech Preview: Connected Cars

by Mike Kapsch, Investment U Research
Saturday, January 7, 2011

It all starts January 10…

That’s when over 140,000 tech industry professionals will swarm the Hilton in Las Vegas, NV showing off their latest innovations at the 2012 International Consumer Electronics Show (CES).

Although closed to the general public, for four full days, tech companies from all over the world will gather to talk about the hottest trends in the smartphone, tablet, laptop, PC, netbook, TV and video game markets.

But this year these tech firms will also hear from a surprising guest… the automotive industry. And 2012 is set to create some good opportunities to profit for switched-on investors…

The Next Era of the Standard Automobile Has Arrived

According to MIT’s Technology Review, “The automotive and transportation industries are entering a phase of the most significant innovation since the popularization of personal automobiles a hundred years ago.”

At this year’s CES conference, Ford and Mercedes will each take the floor to talk about their latest advancements. And they’ll certainly have a lot to say about introducing “connected cars” into the marketplace.

What is a connected car? Take a look here:

But this is just the beginning… Pretty soon, many of the cars we drive will also have the ability to read our vital signs and report emergencies to 9-1-1 when we can’t.

Looking Ahead Through 2016

By the end of 2011, 45 million connected cars were introduced to the public. By 2016, ABI Research claims, this market will grow 366% to 210 million.

With over one billion cars currently on the road around the globe, it’s safe to say the connected car market will have plenty of room to grow for the foreseeable future. And companies like Gartner (NYSE: IT) and Freescale Semiconductor Holdings (NYSE: FSL) are set to take advantage of this technological boost…

Good Investing,

Mike Kapsch

Article by Investment U

A Story of Sell-Offs & Super Spikes by a Stock Market Trader

By MoneyMorning.com.au

[Ed note: the following article first appeared in the December 2011 issue of Australian Small-Cap Investigator. You can check out Murray’s latest free stock market update video and the archives of previous updates on YouTube.]

Kris asked me to write a quick note to you about my predictions for the stock market for next year. That’s a problem. Because as a stock market trader, my job is to focus on the forces in the market that are affecting the price right now.

I look to take advantage of my understanding of those forces to find good risk/reward opportunities for entering stocks.

In fact, my ability to predict where the stock market will be in a years’ time is next to zero when using charts. That means anything I told you about the future direction of the stock market would be meaningless twaddle… that wouldn’t be worth the paper it’s written on (even though it’s not written on paper!).

So, if Kris doesn’t mind, I’d prefer to discuss where the pressure points are in the market, and the impact it will have on investors and traders. But first I’ll cover my long term macro-economic view…

You’d have to be living under a log not to know there are some serious headwinds facing the world economy right now. Europe is in recession. America is plodding along at very slow speed, in danger of being sucked back into the “debt vortex” by Europe. And China’s economy is fast losing steam on the back of a weak Europe and a slow America.

The European debt monster is slowly consuming all in its path and the central bankers and politicians are throwing as much of our money at the problem as possible. Money printing can never be far away under these circumstances. Next year will be a story of to-ing and fro-ing. On side will be the forces of deflation. And on the other, central banks printing money to avoid it.

Great Opportunities for Traders

Therefore the road forward for stocks will be gut-wrenching sell-offs followed by super spikes on the back of money printing. But each episode of money printing will have less effect on the market than the previous one. The outcome from money printing will be higher commodity and food prices… and little else.

This scenario involves periods of very high market volatility that will provide great opportunities for traders who are nimble. But for buy-and-hold investors, this scenario won’t look good for the next year. If you’re an investor (not a trader) looking to time the market I’d say that the first half of next year is a no-go zone until you get confirmation of the next round of money printing from Bernanke.

Even then I would only hold for three to six months at most while the market rallies under the false hope that money printing solves everything.

ASX 200 daily chart

ASX 200 daily chart
Click here to enlarge

Source: Slipstream Trader

Technically the ASX 200 is currently oscillating around a very important low. Decision time on which way the stock market will break is fast approaching.

Have a look at the thick blue lines in the chart. They outline the long sideways distribution that our market has been tracing out for the last two years. What is very interesting about the way prices behave is that when it’s obvious to market players that a price level is technically important, a distribution often forms around that price level.

This leads to the “whipping out” of the inexperienced traders who thought they could trade the market around that important level.

Have another look at the chart. The low of the long-term distribution is very close to the point of control (POC 2) of a smaller distribution.

This smaller distribution has formed over the past three months. The way the market breaks out of this distribution is very important.

If the index falls through this smaller distribution, that will confirm the failure of the large two-year distribution. And if that happens, this will lead to huge selling pressure. Think of it like dominoes…

The Unknown Could Send Stocks 30% Lower

The very short-term failure will set off a chain reaction that could see two years of buying looking for an exit at the same time. This is when the stock market could fall many hundreds of points back to the lows in 2008-09.

Therefore watching the evolution of this smaller distribution is very important.

As I write, the market is selling off below the smaller point of control near 4200 [Ed note: Murray wrote this article on 15 December, 2011 when the S&P/ASX 200 was trading at 4,137]. When the market sells off below its point of control that’s when the momentum shift occurs. People who are “long and wrong” (buyers who bought at high prices) from the top half of the distribution will start to dump positions, giving the bears the upper hand to begin selling aggressively.

The market could fall sharply and quickly to the bottom of the distribution once this occurs.

Therefore I would get out of the way of the stock market for the immediate future. The current set up points to a retest of 3800-3900. If that level gives way then that is where you will see the long-term liquidation of the positions I was talking about.

After that, who knows where it could fall? The market could even retest 3,100 points next year – 30% below today’s level.

Of course, the big unknown is central bank money printing. This has the potential to throw a spanner in the works. So you’ll have to keep on your toes.

Murray Dawes
Slipstream Trader

[Ed note: Each week Murray Dawes produces a free weekly video. You can access Murray’s latest video and access the archive of previous updates by clicking this stock market update link]


A Story of Sell-Offs & Super Spikes by a Stock Market Trader

Monetary Policy Week in Review – 7 Jan 2012

The past week in central banking and monetary policy was relatively quiet, with just 5 central banks announcing interest rate decisions.  Those changing interest rate settings were: Romania -25bps to 5.75%, Bangladesh +50bps to 7.75%, and Cape Verde +150bps to 5.75%.  Those that held rates unchanged were Uganda at 23.00%, and Trinidad & Tobago at 3.00%.  Also making news was the signing into law of sanctions against Iran’s central bank by the US, Chinese leaders commenting on the direction of monetary policy in 2012, and the ECB appointing Belgian, Peter Praet, as Chief Economist; replacing the outgoing Jurgen Stark.


Following are some of the key quotes from the central bankers that announced decisions last week:

  • Romania (cut 25bps to 5.75%): “The recovery of the Romanian economy has continued – underpinned by favourable dynamics of exports, as well as of industrial and farming output – whereas the growing uncertainties regarding global and European growth amid a worsened global risk appetite and heightened sovereign debt crisis in the euro zone are hindering the short-term outlook for the overall economic activity in Romania.”
  • Uganda (held at 23.00%): “I acknowledge the fact that the long-term solution to controlling inflation rests on addressing the structural constraints and improving productivity, but controlling inflation in the short to medium term is extremely crucial in stimulating this long-term economic growth.”
  • Trinidad & Tobago (held at 3.00%): While there are signs that credit demand may be increasing, the basis for a sustained economic recovery is still to be established.”  The Bank also noted “The increase in the headline inflation rate was mainly attributable to higher food prices. Core inflation, which excludes the impact of food prices, has been relatively well contained for most of 2011, indicative of the overall sluggish demand conditions in the economy.”
  • Cape Verde (increased 150bps to 5.75%): “The unfavorable balance of payments, the persistence of serious financial problems at the international level – in particular in the euro area – which could have impact on the evolution of the economy and domestic economic developments, require the making of monetary policy measures consistent with ensuring exchange rate stability and financial system.”

Looking at the central bank calendar, there’s a few key central bank meetings scheduled in the week ahead.  The market will be closely watching the decisions from the Bank of England and ECB; while neither are expected to change policy settings just yet, the statement from the ECB will merit close study.  Also due in the week ahead is China’s quarterly data dump, many are picking the PBOC will cut the RRR before Chinese Lunar New Year (23 Jan), and the data may (or may not) provide an additional excuse to move.  The Fed is also scheduled to release its Beige Book economic report on Wednesday.

  • PLN – Poland (National Bank of Poland) expected to hold at 4.50% on the 11th of Jan
  • GBP – UK (Bank of England) expected to hold at 0.50% on the 12th of Jan
  • EUR – EU (European Central Bank) expected to hold at 1.00% on the 12th of Jan
  • IDR – Indonesia (Bank Indonesia) expected to hold at 6.00% on the 12th of Jan

Bank of Cape Verde Raises Rate 150bps to 5.75%

The Banco de Cabo Verde (Bank of Cape Verde) increased its minimum cash availability ratio (DMC) by 200 basis points to 18.00% from 16.00%, and its base interest rate by 150 basis points to 5.75% from 4.25% previously. The Standard Lending Facility rate will be 8.75% and the Absorption Standing Facility Rate will be 3.25%. The Bank said [translated]: "The unfavorable balance of payments, the persistence of serious financial problems at the international level – in particular in the euro area – which could have impact on the evolution of the economy and domestic economic developments, require the making of monetary policy measures consistent with ensuring exchange rate stability and financial system."

Gold Up 5% on Week in Euros as “Recession Data” Hit Europe, US “Can’t Decouple” from Eurozone Crisis Despite Positive Jobs News

London Gold Market Report
from Ben Traynor
BullionVault
Friday 6 January 2012, 09:00 EST

THE DOLLAR cost of buying gold hovered around $1620 an ounce Friday morning London time – becoming a bit more volatile following the release of US employment data but failing to establish a definite direction – while stocks and commodities edged higher.

Silver prices meantime eased around lunchtime, hitting $29.15 per ounce.

On currency markets the Dollar rallied – pushing the Euro down further – after the nonfarm payrolls release showed the US economy added 200,000 private sector non-agricultural jobs in December.

The US unemployment rate fell from 8.7% in November (revised up today from 8.6%) to 8.5%.

From its high above $1.30 on Tuesday, the Euro meantime has since fallen 2.5% against the Dollar.

By Friday lunchtime the price of buying gold in Euros – which touched a 4-week high of €40994 per kilo (€1275 per ounce) looked set for a weekly gain of over 5%.

The Dollar cost of buying gold meantime was headed for a weekly gain of around 3.6%.

“A close above the 200 day moving average at $1632 is needed to shift the market [for buying gold] to Neutral from Bearish,” reckons Russell Browne, technical analyst at bullion bank Scotia Mocatta.

“While gold is pushing towards its 200 day moving average at $1633, we are not convinced that it can sustain a break above this level yet,” adds Standard Bank commodities strategist Walter de Wet.

“Liquidity remains locked up as the European interbank market continues to malfunction…in the physical market, we continue to see steady buying of gold. But this demand is more likely to provide support for gold on dips below $1600 rather than push it substantially higher.”

Friday’s Asian trade saw demand for buying gold in physical form, according to one Shanghai trader.

“Liquidity is back in the market,” said the trader.

“With the Europe outlook still grim, investors would prefer to put their dollars in some safety assets, such as gold.”

In the US, however, the volume of gold to held to back shares in the world’s largest gold ETF, the SPDR Gold Trust (GLD), has not changed since before Christmas.

This contrasts with the world’s biggest silver ETF, the iShares Silver Trust (SLV), where steady outflows since the middle of last month has seen the volume of silver bullion held fall to its lowest level since September 2010.

“We expect silver demand to slow during [2012],” says the latest precious metals note from French bank Natixis, citing “reduced investment demand alongside the current weakness in global industrial demand.”

“There have been good data out of the US,” said Jeremy Friesen, Hon Kong-based commodity strategist at Societe Generale, speaking ahead of today’s nonfarm payrolls release.

“But ultimately the US can’t decouple from the European crisis…there are going to be enough reasons to be worried about global growth and the financial system in the next quarter or two, and gold should benefit from that.”

German factory orders fell 4.8% between October and November last year, Bundesbank figures published this morning show.

Retail sales for the 17-nation Eurozone as a whole meantime fell 2.5% in the year to November – compared to a 0.7% y-o-y drop to October – according to official European Union data, while the European Commission’s economic confidence indicator hit its lowest level in over two years last month.

“This data has recession written all over it,” says Martin van Vliet, Eurozone economist at Dutch bank ING.

A report in French newspaper Les Echos suggests the governments of France, Belgium and Luxembourg are considering fully nationalizing Dexia. The three governments pledged last October to guarantee for a decade €90 billion of the bank’s loans, nationalizing its Belgian division.

In Switzerland meantime Phillip Hildebrand, head of the Swiss National Bank – which last year pegged the Swiss Franc to the Euro – has refused to resign after it emerged that his wife bought US Dollars three weeks before the peg was announced.

Here in the UK – where the Pound this morning hit a 15-month high against the Euro – oil company Shell has announced it will close its final salary pension scheme, the last FTSE 100-listed company to do so.

The Sterling price of buying gold hit £1052 per ounce Friday lunchtime in London – 4.6% up on the start of the week.

Hungary’s leader Viktor Orban has expressed support for central bank governor Andras Simor as the government prepares to renew negotiations with the International Monetary Fund and the European Union over a possible bailout. The IMF and EU last month walked away from negotiations after Orban’s government refused to repeal new legislation seen as threatening the central bank’s independence.

Ben Traynor
BullionVault

Gold value calculator   |   Buy gold online at live prices

Editor of Gold News, the analysis and investment research site from world-leading gold ownership service BullionVault, Ben Traynor was formerly editor of the Fleet Street Letter, the UK’s longest-running investment letter. A Cambridge economics graduate, he is a professional writer and editor with a specialist interest in monetary economics.

(c) BullionVault 2011

Please Note: This article is to inform your thinking, not lead it. Only you can decide the best place for your money, and any decision you make will put your money at risk. Information or data included here may have already been overtaken by events – and must be verified elsewhere – should you choose to act on it.