Why the Gold Slump is Not Over

Why the Gold Slump is Not Over

by Alexander Green, Investment U Chief Investment Strategist
Monday, January 09, 2012: Issue #1682

Not long ago, my colleague Mark Skousen asked a roomful of attendees at an investment conference how many of them owned gold. Virtually every hand in the room went up.

“And how many of you have ever sold any of your gold?”

Virtually every hand in the room came down.

For many investors, gold is their “forever investment,” the one asset they never plan to sell. That could be a mistake, a big one.

I can assure you that the institutional investors who have bid gold up the last few years consider the metal a “hot date,” not a long-term marriage. And that bodes ill for prices in the short to medium term.

Yes, I was bearish on gold a year ago. But I’m more bearish on it today. After all, the trend is your friend.

True, gold went up in the first half of 2011 and didn’t peak until August. But take a look at a five-month chart.

5 month gold chart

It’s not a pretty picture.

Of course, gold is hard to value under the best of circumstances. It has very few industrial uses. It generates no earnings, pays no dividends, accrues no interest and provides no rental income. That means the best any of us can do is guess where it’s headed next.

So why am I guessing it will be lower? Let me count the ways:

1. Gold is a wonderful inflation hedge. But the metal is up more than five-fold over the last 12 years and inflation is still not a problem. Is it not conceivable that inflation could tick up and gold – having already discounted this – moves lower?

2. Gold is a great performer in an economic crisis. But we already had the crisis. It ended in 2008. Things are getting slowly better, not worse.

3. With gold prices still in the stratosphere and the value of the rupee falling, India – the world’s biggest consumer of gold – is likely to experience a pronounced drop-off in demand this year. Not good.

4. Gold is now well above the marginal cost of production. New mines are opening and old mines are re-opening. It’s Economics 101. Greater supply depresses prices.

5. If you believe the gargantuan debt load that Washington has run up will cause gold to rally from here, you may want to think again. Japan’s debt load as a percentage of GDP is more than twice ours and the end result has been disinflation, not inflation. Why will it be different this time? Indeed, George Soros and several other major speculators are openly forecasting outright deflation. That would not be good for gold.

6. Note that while gold ended the year up in 2011, gold shares dropped 16%. Already, equity investors are taking a dim view of the sustainability of gold’s advance. I think they’re right.

7. Investment demand for gold has soared in recent years. Seven years ago, it made up just 16% of total demand. Today it’s more than 40%. But hedge fund managers who piled into gold, unlike Mom and Pop, have no emotional commitment to the metal. These are hair-trigger traders. When the primary trend turns unequivocally south, you can bet these guys will dump gold faster than a freshman girlfriend.

I’m not suggesting that anyone bail out of gold. You should hold at least 5% of your liquid assets in gold and gold stocks, and perhaps more. But if you’re one of those folks I meet who has 30%, 50% … even 80% in the barbarous relic, you’re really sitting at the roulette table at 3 AM.

No one can say unequivocally that the bet won’t pay off. But there could be a steep price to pay if it doesn’t. The last time gold was a bubble, investors were down more than 60% two decades later.

As Mark Twain said, “History may not repeat itself. But it rhymes.”

Good Investing,

Alexander Green

Article by Investment U

Paulson After Worst Year Takes Cue From Griffin

Jan. 9 (Bloomberg) — John Paulson, the billionaire money manager who’s vowed to restore his hedge fund to profitability after the worst year of his career, may have to take a cue from rival Ken Griffin. Paulson’s $28 billion firm, Paulson & Co., will need to generate a 104 percent return to recoup a 51 percent drop in one of his largest funds after wagers on a U.S. recovery went awry. Until he hits that mark, Paulson will have to forgo his 20 percent performance fee, and will collect only his 1.5 percent management fee. It has taken Griffin, the billionaire founder of Citadel LLC, three years to recover most of the 55 percent he lost for investors in 2008. Erik Schatzker reports on Bloomberg Television’s “InsideTrack.” (Source: Bloomberg)

Could Oil Prices Intensify a Pending S&P500 Selloff?

By JW Jones: www.OptionsTradingSignals.com

Last week we received reports that the unemployment rate in the United States was improving markedly. In addition, sentiment numbers were released that confirmed my previous speculation that market participants were becoming more and more bullish as prices in the S&P 500 edged higher. The exact numbers that came in demonstrated that bullish sentiment had not reached current lofty levels since February 11, 2011. The table below illustrates the most recent sentiment survey:


Chart Courtesy of the American Association of Individual Investors

Clearly investors are growing considerably more bullish at the present time.  The bullishness being exhibited by market participants is rather interesting considering the notable headwinds that exist in the European sovereign debt markets, the geopolitical risk seen in light sweet crude oil futures, and the potential for a recession to play out in Europe.

To further illustrate the complacency in the S&P 500, the daily chart of the Volatility Index is shown below:


The VIX has been falling for several weeks and is on the verge of making new lows this week. If prices work down into the 16 – 18 price range a low risk entry to get long volatility may present itself. For option traders, when the VIX is at present levels or lower there are potentially significant risks associated with increases in volatility.

My expectations have not changed considerably since my article was posted last week. However, I continue to believe that the bulls will push prices higher yet in what I believe could be the mother of all bull traps. Let me explain. As shown above, we have strong bullish sentiment among market participants paired with general complacency regarding risk assets.

As I pointed out last week, my expectation if for the S&P 500 to top somewhere between 1,292 and 1,325. A lot of capital is sitting on the sidelines presently and if prices continue to work higher I suspect that a move above the 1,292 price level will trigger a lot of long entries back into stocks or other risk assets.

We could see prices extend higher while the “smart” money sells into the rally. Retail investors and traders will point to the inverse head and shoulders pattern on the daily chart of the S&P 500 and the breakout above the key 1,292 price level. The pervasive fear of missing a strong move higher will help fuel long entries from retail investors.

At the same time retail investors begin buying, a lot of committed shorts will be stopped out if prices push significantly above the 1,292 area or higher toward the more the obvious 1,300 price level. Thus, there will be few shorts to help support prices should a failed breakout transpire. A perfect storm could essentially be born from the lack of shorts to hold prices higher paired with the trapping of late coming bulls.

The daily chart of the S&P 500 Index below illustrates what I expect to take place in the next few weeks:


I want to reiterate to readers that it is not totally out of the question that the 1,292 price level could hold as resistance or that we could roll over early this coming week. Additionally a breakout over 1,330 will certainly lead to a test of the 2011 highs around the 1,370 area.

If the S&P 500 pushes above the 1,370 area we could witness a strong bull market play out. Ask yourself this question, what reasons could produce such a rally and what are the probabilities of that outcome transpiring in the next few weeks?

Obviously earnings season is going to be upon us shortly and if earnings come in below expectations a potential sell off could intensify. Furthermore, economic data in Europe continues to weaken and slower growth appears to be manifesting within the core Eurozone countries like Germany and France. If most of Europe plunges into a recession, deficits will widen beyond economic forecasts and the strain in the sovereign debt market of the Eurozone will increase dramatically.

One key element that many analysts are not even discussing is the potential for higher oil prices to present additional economic headwinds for developed western economies.

Clearly the situation in the Middle East is unstable, specifically what we are seeing taking place in the Strait of Hormuz involving Iran. If a “black swan” event occurs such as a military conflict between the United States and Iran or Israel and Iran the prices of oil will surge.

In a recent research piece put out by SocGen, nearly every scenario that is referenced involves significantly higher oil prices. According to the report, the Eurozone is considering the banning of imported Iranian oil which could cause Brent crude oil prices to surge to a range of $120 – $150 / barrel according to SocGen.

The other scenario involves the complete shut down of the Strait of Hormuz by Iran. If this shutdown were to persist for several days the expectation at SocGen for Brent crude oil prices is in the $150 – $200 / barrel price range.

Clearly if either of these two scenarios play out in real time, the impact that higher oil prices will have on European and U.S. economies could be catastrophic.

The daily chart of light sweet crude oil futures is shown below:


I want readers to note that I am not suggesting that oil prices are going to rise or fall, just outlining the report from SocGen about where they expect oil prices to go should either of the two scenarios presented above play out. If oil prices were to work to the $125 / barrel level and remain there for a period of time, I would anticipate a very sharp decline in the S&P 500.

Currently there are a lot of headwinds for bulls, some of which could persist for quite some time. I intend to remain objective and focus on collecting time premium as a primary profit engine for my service at OptionsTradingSignals.com.

Once I see a confirmed move in either direction I will get involved. For now, I intend to let others do the heavy lifting until a low risk, high probability trade setup presents itself. Risk is increasingly high.

Get these weekly reports and trade ideas free here: www.Optionnacci.com

JW Jones

This material should not be considered investment advice. J.W. Jones is not a registered investment advisor. Under no circumstances should any content from this article or the OptionsTradingSignals.com website be used or interpreted as a recommendation to buy or sell any type of security or commodity contract. This material is not a solicitation for a trading approach to financial markets. Any investment decisions must in all cases be made by the reader or by his or her registered investment advisor. This information is for educational purposes only.


Positive US Data Fails to Boost EUR

Source: ForexYard

Despite a positive US jobs report on Friday, which would have normally boosted riskier assets like the euro, the common currency maintained its bearish trend to close out the week. The EUR/USD dropped to its lowest level in 15-months, while the EUR/JPY fell to a fresh 11-year low. This week, traders will want to pay attention to several important indicators, notably Thursday’s statements from both the European Central Bank and the British Monetary Policy Committee.

Economic News

USD – US Non-Farm Data Sends USD to 15-Month High vs. Euro

The US Non-Farm Payrolls data came in well above expectations on Friday, and managed to boost the US dollar against most of its main currency rivals to close out the week. The EUR/USD ended Friday’s session at 1.2718, down well over 300 pips from its peak earlier in the week. In addition, the GBP/USD was down well over 200 pips from highs reached earlier in the week to close out Friday at 1.5428.

The fact that the safe-haven US dollar maintained its bullish trend despite the positive jobs figure is largely because of the ongoing euro-zone debt crisis which continues to drive investors away from the common currency. Typically, positive US data sends investors to riskier assets like the euro. It appears that until positive European data is released, it will be difficult for the euro to rebound.

Turning to this week, euro-zone data is likely to dictate the direction the USD will take. In particular, Thursday’s ECB Press Conference may prove to create significant market volatility. With regards to today, Canadian data is forecasted to influence the USD/CAD. The pair has been largely bullish as of late. With today’s Canadian Building Permits figure forecasted to come in well below last month’s, the upward trend may continue.

EUR – Euro Tumbles despite Positive Global Economic Data

Riskier assets like the euro failed to rebound last week, despite positive global data like the latest monthly US jobs report. The euro remains bearish against virtually all of its currency rivals, in particular the Japanese yen. The EUR/JPY hit a fresh 11-year low and closed out last week at 97.88. Italian debt worries were largely to blame for the bearish euro. Additionally, Greece’s future in the euro-zone has caused many investors to divert their funds away from the EUR.

This week, traders will want to pay attention to any news out of the euro-zone. In particular, Thursday’s ECB Press Conference is likely to generate heavy market volatility. Investors will be looking for a concrete plan from the EU to combat its ongoing debt problems. Positive signs that a plan exists for the euro-zones current economic troubles are likely to boost the euro, at least in the short term.

CHF – Swiss Data May Help CHF Extend Bullish Trend Today

The Swiss franc had mixed trading throughout last week. While it was able to maintain a bullish trend against the euro, the currency slipped against both the dollar and yen. Analysts attribute the trends to the current euro-zone debt crisis and positive US jobs data released last Friday. The EUR/CHF closed last week at 1.2147 while the USD/CHF finished at 0.9551.

Today, the Swiss retail sales figure may help the franc against the dollar and yen. Forecasts are calling for the indicator to come in at around 0.6%, a considerable increase over last month. If the predictions turn out to be true, the franc may be able to recoup some its losses last week, while extending its current trend against the euro.

Crude Oil – Crude Oil Closes Week on a Bearish Note

Positive US jobs data combined with a weak euro caused crude oil to close last week on a slight bearish note. While oil is still trading above the psychologically significant $100 a barrel level, the strong dollar weighed down on the commodity. Typically, a strong US dollar makes oil more expensive for international consumers and brings prices down. In addition, the euro-zone debt crisis has brought equities markets down, resulting in bearish momentum for oil.

This week, traders will want to pay attention to any news out of the euro-zone. Further bearish movement by the euro will likely cause crude oil to move down as well. At the same time, Middle East tensions may cause oil to go bullish again. Any news out of Iran which may cause investors to fear oil supplies may drive the commodity higher throughout the week.

Technical News

EUR/USD

Technical indicators on the daily chart place this currency pair in the oversold zone, indicating that an upward correction may take place in the near future. A bullish cross is forming on the Stochastic Slow, while the Williams Percent Range is right around the -90 level. Going long in your positions may be a wise choice.

GBP/USD

Indicators on the weekly chart are showing a possible upward correction for this pair may take place. The Relative Strength Index is drifting toward the oversold zone, while the Williams Percent Range is already below the -90 level. Traders may want to go long in their positions.

USD/JPY

Most long-term technical indicators are showing this pair trading in neutral territory, meaning that a clear trend has yet to present itself. Traders are advised to take a wait-and-see approach with their trades until a clearer picture develops.

USD/CHF

After spiking in trading last week, technical indicators are showing possible bearish movement for this pair in the near future. The daily chart’s Stochastic Slow has formed a bearish cross, while the Relative Strength Index is hovering in the overbought zone. Traders may want to go short in their positions.

The Wild Card

EUR/JPY

Following a steady decline in prices last week, technical indicators are showing that this pair is trading in the oversold region and may see an upward correction in the near future. The Stochastic Slow on the daily chart has formed a bullish cross, and the Relative Strength Index is trading well below the 30 level. traders may want to go long in their positions. Forex traders may want to go long in their positions.

Forex Market Analysis provided by ForexYard.

© 2006 by FxYard Ltd

Disclaimer: Trading Foreign Exchange carries a high level of risk and may not be suitable for all investors. There is a possibility that you could sustain a loss of all of your investment and therefore you should not invest money that you cannot afford to lose. You should be aware of all the risks associated with Foreign Exchange trading.


GBP-USD-daily review by Real-Forex

GBP-USD
Date: 08.01.2012 Time: 16:40 Rate: 1.5428
Strategy: Short/Long
4 Hour Chart
The price is very close now to the lower ranging level on the 1.5410 price level that is used as a strong support level as well. It is possible that from this level the price will climb again with the purpose to correct a third to two thirds of the last downtrend (black broken line) meaning between the 1.5488 and the 1.5557 price levels. on the other hand, a breaking of the 1.5360 last low will sign the confirmation for the breaking of the lower ranging level, the target of the price in this case will be the size of the range thrown downwards to the 1.5045 price level.
You can see he chart below:
http://www.real-forex.com/charts-daily/r/01/09.01.2012/7.jpg

Will the Gold Bull Keep Running in 2012?

By MoneyMorning.com.au

2011 was a long, painful year for nearly everyone in the market – with perhaps the exception of gold bulls.

Even the self-appointed kings of the financial sector, the hedge funds, were put out to dry.

The ‘hedge’ part of their name alludes to their investing methods which let them ‘hedge’ out their risks. It didn’t seem to work for them last year. Nearly all of them lost money.


The Paulson Advantage Plus Fund lost an epic 48%. And despite the name, the Paulson ‘Recovery’ fund wouldn’t have been much use with a loss of 27.7%. The Henderson European fund lost 42.8%. Senvest lost 36.9%.

The list goes on. In fact, out of the 300 hedge funds on HSBC’s score card, just fifteen of the 300 actually gained by more than 10% for the year.

Put another way, just 5% of the world’s hedge funds outperformed gold last year.

Gold put in a gain of 10.1% by the close of the year, despite falling $400 from its September peak of US$1925 / ounce. Aussie gold had a similar result of 10.2%.

You can start to see why the mainstream dislikes gold – when an inert block of metal sitting in a vault outperforms their best ideas.

What can we expect from gold in 2012?

A Good Year For Gold


All the ducks are lined up for another year of good gains.

To kick start gold’s year, the US government has reached the debt ceiling yet again. There hasn’t been much press about it yet, but a few days ago the debt level nuzzled up against the $15.2 trillion mark.

If the US government increases the debt ceiling again, it is a green light to borrow more. It took just 6 months to borrow the last trillion. Like a mortally obese person with the key for the cake cupboard, it’s hard to imagine them discovering self-control any time soon.

As the US debt level rises, the gold price will rise with it.

You can see the two accelerating together in the chart below. News about changes to the debt ceiling is due shortly.

If the limit is pushed up to $16.2 trillion as expected, the gold price should trend towards $1900 if the long-standing relationship holds true.

Where the US debt ceiling goes, the gold price follows

Where the US debt ceiling goes, the gold price follows
Click here to enlarge

Source: zerohedge


The mood around gold at the moment is quite negative after a rough finish last year. It fell as low as US$1525 and has now spent nearly a month under the 200 day moving average. This is the red line in the chart below, which has been a clear support line for years.

Gold price dips below the 200 day moving average for a month (circled)

Gold price dips below the 200 day moving average for a month (circled)
Click here to enlarge

Source: Stockcharts


This fall has got the media calling the end of the bull market-which is frankly ridiculous. Most of them wouldn’t know a gold bar if they found one in their latte. Gold was still up 10% for the year. And there’s been no slowdown in any of the factors fuelling gold’s bull-run. And after forming a double bottom around $1525, the chart looks bullish.

Then consider the timing: in seven years out of this 11-year bull-run, gold has set its lowest price for the year by February the 8th. That’s a pretty amazing pattern. Put another way, 65% of the time gold is at its cheapest during the first five weeks of each year.

I suspect that we have already seen gold’s low point for 2012. The selling during December would have been driven by profit taking at the end of the calendar year. Gold was probably the only thing to rise in many portfolios last year: an easy target to sell to improve end-of-year results. The sell-off left gold looking very cheap and investors are now moving in.

So what are the main drivers of a higher gold price this year?

Firstly, the Chinese can’t get enough of it. They are the biggest producers of gold globally. They are also the biggest importers. The central bank has been buying not to mention the government telling 1.1 billion people to buy it as well. Shipments of gold from Hong Kong into China have gone parabolic in the last few years (see chart below). The Chinese are rapidly trying to diversify their assets away from US dollar denominated holdings, and won’t be stopping any time soon.

China – the biggest importers in the market are loading up on gold

China - the biggest importers in the market are loading up on gold
Click here to enlarge

Source: Reuters

In October alone, 85 tonnes of gold were shipped into China. To put this in context, this is about 40% of what the world’s gold mines produced during that month.

The second big reason I’ve been bullish on gold – and am probably more bullish now – is that central banks, as a whole, are big buyers – and they are buying more gold as time goes on.

The central banks are the biggest players in the market this year. What they do drives the direction of the gold price. A very clear trend has formed since 2005. As you’ll see in the next chart, the central banks buy more gold each year… and this year has been massive. The World Gold Council estimates that central bank buying will take the equivalent of 2 months-worth of the entire world’s gold-mine production this year.

Central banks buying more gold each quarter

Central banks buying more gold each quarter

Source: World Gold Council, BNP Paribas, D&D edits

The third and final big reason why I’m bullish for gold is because of the global debt crisis and the inevitability that the US Fed will print more money. The greater the money supply, the more it dilutes the value of that currency. So the price of real things, like gold, increases as a result.

They might deny money printing is on the cards for now. But the Fed will have no choice but to crank up the presses. There is $2.7 trillion of short-term debt they need to get someone to refinance in 2012 alone.

Maturity Dates of Marketable Debt Held by the Public as of September 30, 2011

Source: FAO

Who in their right mind would, or even could, lend that much to the US? We’re in the middle of a banking crisis! And I’m pretty sure the US has had a credit downgrade. Over the next 4 years, this debt will blow out to $5.6 trillion.

But gold isn’t the only precious metal to watch…

I think silver will have a more explosive year than gold.

After a disappointing 2011 where the metal price closed down 10%, many of the short term speculators have now been flushed out of the market.

Silver poised for a better 2012

Silver poised for a better 2012
Click here to enlarge

Source: Slipstream Trader


The silver price is now in bargain territory, and what is happening in the market is very bullish. The silver price recently had its biggest jump in three years, and went on to jump 12% in three days. Tomorrow we’ll explain why something similar could happen again to silver in the next few months.

Dr. Alex Cowie
Editor, Diggers & Drillers


Will the Gold Bull Keep Running in 2012?

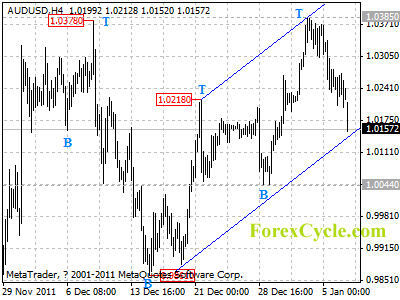
AUDUSD pulled back from 1.0385

After touching 1.0378 resistance, AUDUSD pulled back from 1.0385, however, the fall from 1.0385 would possibly be consolidation of uptrend from 0.9861. Key support is now located at the lower line of the price channel on 4-hour chart, as long as the channel support holds, we’d expect uptrend to resume, and one more rise towards 1.0600 is still possible. One the downside, a clear break below the channel support will indicate that the rise from 0.9861 has completed at 1.0385 already, then the following downward movement could bring price back to 0.9500 area.

audusd

Daily Forex Analysis

Slovakia’s Nuclear Schizophrenia – Shut Down, Continue As Usual, or Boldly Go – Where?

The implosion of the USSR in December 1991 produced massive economic “collateral damage” in its East European allies, as they simultaneously sought both to assert their new-found independence and draw closer to their potential European allies on the western side of 1946’s “Iron Curtain.”

Following the euphoria amity quickly devolved down to practical issues, one of which was that the European Union was leery of welcoming new members after the collapse of Communism that relied on power from Soviet-era nuclear power facilities, especially in the wake of the April 1986 nuclear disaster at Chernobyl in Ukraine.

Accordingly, the last two decades have devolved into a series of unseemly squabbles between Brussels and new Eastern European members, with the EU demanding the prompt shutdown of Soviet-era nuclear power plants, while governments east of Berlin plead understanding and extended timelines to shut down the facilities that provide major electrical input as they search for alternatives.

The latest post Cold War post-Soviet space energy front line is Slovakia.

What to do in Bratislava on the way to becoming good, clean, green members of the European Union?

Shut down all the country’s nuclear power plants and win plaudits in Brussels while inflicting brownouts or blackouts on the locals?

Beg for more time?

Adopt a matrix of energy change which includes some nuclear power while appealing to Brussels?

Right now, the answer is about as clear as the river flowing through Bratislava, “the beautiful Blue Danube,” to quote Richard Strauss.

Slovakia currently has four operational nuclear reactors at complexes in Jaslovske Bohunice and Mochovce, commissioned between 1984 and 1999. The facilities’ three oldest reactors have been shut down in accordance with EU mandates. The Jaslovske Bohunice two online 505 reactors alongside Mochovces’ twin 505 megawatt currently produce a net output of 1,711 megawatt hours of electricity, with nuclear energy currently producing overall approximately 50 percent of Slovakia’s electricity.

Prior to its accession to the European Union in 2004 Slovakia had to shut down two of its older reactors because they did not meet European safety standards. Slovakia made significant efforts to achieve World Association of Nuclear Operators (WANO) standards, but the EU nevertheless insisted on the shutdowns. The first Bohunice reactor closed on 31 December 2006 and the second Bohunice facility two years later. The closure of these units, prior to the completion of two new reactors left Slovakia short on power, with the country briefly becoming an energy importer after the first plant was shut down.

The Slovak government nevertheless seemingly remains committed to nuclear power. Two more reactors have been under construction at Mochovce since 1985 and which should be finished in 2012-2013.

Further complicating the picture beyond the Slovak Republic’s EU membership, Slovenske Elektrarne, a unit of Italy’s Enel, is the operator of the two nuclear power plants (NPPs).

But amidst the country’s nuclear quandary, one state agency seems poised for growth.

Jadrova a vyradovacia spolocnost, a.s., Slovakia’s nuclear decommissioning company, better known by the acronym JAVYS, intends to increase its investments this year by $19.5 million, a $4.4 million increase over 2010 funding levels. JAVYS spokesman Dobroslav Dobak said,”Of the planned investments in 2012, we will continue with preparation and implementation of projects related to decommissioning of (Bohunice) nuclear power plants A1 and V1, and projects aimed at reconstruction and construction of technologies used for handling spent nuclear fuel and radioactive waste.”

But the downside for Slovak environmentalists is that the global recession has impacted JAVYS funding as well, as last year JAVYS shed nearly 12 percent of its workforce, which now numbers 885 people. Dobak commented, “The decline is mainly related to the change of the status of V1 NPP which is no longer operating but is being decommissioned. Thus it is not necessary to operate several technological systems. At the same time, we optimize and improve effectiveness of our activities.”

So, where does Slovakia go from here? EU-friendly green or transitional post-Soviet nuclear?

The answer is anything but clear.

Source: http://oilprice.com/Alternative-Energy/Nuclear-Power/Slovakia-s-Nuclear-Schizophrenia-Shut-Down-Continue-As-Usual-or-Boldly-Go-Where.html

By. John C.K. Daly of Oilprice.com