The Markets Rally Like It’s 2008

By MoneyMorning.com.au

Global equity markets rallied and have started the year on a positive note.

It’s as if the markets have completely ignored the global problems that should drive them down. You’ve got the ongoing Eurozone troubles. The potentially massive write down of Greek debt. An Italian banking sector about to implode… and the economic slowdown in China.

Funny enough, the one bright spot – if you can call it that – is the US economy.

The US is growing faster than most other developed nations. However, it’s a result of a US$1 trillion Federal Government deficit.

While the markets take US growth at face value, bad news in other parts of the world is, apparently, good news for stock prices.

Any bad news in Europe means further ‘liquidity’ gifts from the European Central Bank (ECB).

And China’s poor trade surplus data – the lowest in years, which suggests weaker imports, gives the authorities reason to ‘stimulate’ the economy.

We know the story. We’ve been here before.

But it appears markets don’t remember history. Even very recent history.

We are on the edge of repeating history that occurred less than four years ago.

Back in early 2008 the S&P500 rallied after declining for months. Everyone thought the ‘worst was over’, especially considering the Federal Reserve had lowered interest rates aggressively in the preceding months.

Stock prices started climbing around March 2008 and peaked in May, two months later. The charts below show the period for both the S&P500 and Australia’s All Ord’s index.

At the time, the market rally felt like a recovery. There were few market commentators expecting further falls. They weren’t looking at the big picture, which was telling the story of a burst credit bubble.

Déjà Vu – Beware the Bear Market Rally

$SPX chart
Click here to enlarge

$AORD chart
Click here to enlarge

Again, the market is not looking at the big picture.

At this point, it’s impossible for the markets to keep rallying without MASSIVE central bank money printing. We’ll get to that point eventually, but not before things get much worse.

For now, central banks have done enough to maintain confidence.

The ECB’s long-term liquidity program has bought time for the region’s embattled banks. But this has increased speculation and money flows around the world.

Given the ECB’s willingness to hold doubtful assets on its balance sheet for a long time (which is what the liquidity program achieves), speculators are now selling the euro. A recent story in the Australian Financial Review had a story about how the euro is now the favourite ‘carry trade’ currency.

Meaning banks and other speculators are now betting on a weaker euro by selling the currency and buying higher-yielding currencies, like the Aussie dollar, with the proceeds.

After China experienced one of the biggest credit booms in history, it remains to be seen how central bankers can increase stimulus.

And the ECB simply bought another round of speculation and risk taking.

The point I’m trying to make, is to not be fooled into thinking it’s a sustainable recovery. The global problems are still here and will be for a long time… how long this market rally will last thought is anyone’s guess.

The market might rally like its March 2008, however, it could also be the last leg up before the next downturn.

Greg Canavan
Editor, Sound Money. Sound Investments

[Ed Note: Standard & Poor’s recently downgraded the credit rating of several crucial Eurozone countries. Read this article on Europe’s credit rating downgrades to find out the key impact this may have.]

From the Archives…

Why Fallen Commodity Prices Mean This Sector is Worth a Punt
2012-01-13 – Kris Sayce

Why Australian Banks Are a “Suckers” Investment You Should Avoid
2012-01-12 – Greg Canavan

The Fed’s Funny Money Merry Go Round
2012-01-11 – Kris Sayce

Silver Price Ready to Explode
2012-01-10 – Dr. Alex Cowie

Will the Gold Bull Keep Running in 2012?
2012-01-09 – Dr. Alex Cowie

For editorial enquiries and feedback, email [email protected]


The Markets Rally Like It’s 2008

How Global Oil Supplies Could Fall 40% Overnight

By MoneyMorning.com.au

You’d never know it from the oil price, but the global seaborne oil supply might face a 40% cut. In the last few days the Brent Crude price has dropped from $115 to $110 a barrel, where it has spent much of the last three months.

So why could the global oil supply fall by 40% overnight?


Iran has threatened to block the Strait of Hormuz in response to US sanctions.

The Strait of Hormuz is the narrowest part of the Persian Gulf. Oil from producing countries like Saudi Arabia, Qatar, and the United Arab Emirates also ship their oil through the strait. All up, 40% of the oil produced around the world each day goes through this narrow channel.

The Strait of Hormuz – a weak point in global oil shipping

The Strait of Hormuz - a weak point in global oil shipping

Source: Googlemaps


So what sanctions would trigger Iran to block the Strait?

The US has asked the world to stop buying Iranian oil.

The US has lobbied China and Europe to buy their oil elsewhere. The US stopped buying Iranian oil years ago. China, Spain, Italy and Greece are still big buyers. Iran still makes up 5% of global production.

The US has put the pressure on Iran in this way to get Iran to give up its nuclear ambitions.

This reeks of hypocrisy. How can the US, which has the world’s largest store of nuclear weapons, tell other countries not to develop them? It is also inconsistent. The US let Israel develop its nuclear capacity with minimal interruption.

Iran is not happy being told what to do by a financially and morally bankrupt foreign power. And in response it threatens to close off the Strait, which would cause the oil price to soar.

The World’s Most Valuable Commodity

Oil has a long history of triggering conflicts. There is a great quote in the movie Blood Diamond that puts it well. A villager stands in front of his burning village, with dead bodies scattered everywhere, and says “…let’s hope they don’t find oil. Then we will have REAL problems.”

Because the Strait is an obvious flash point, the US has a strong military presence in the region. The US Navy has a fleet moored off the coast of Dubai. Right now, the US has positioned two aircraft carriers in the Strait, and a third is on its way. Of course, Iran has a powerful military of its own. And while Iraq had few friends, Iran has powerful allies in Russia and China. Conflict needn’t be naval either. Soldiers can launch powerful anti-ship missiles just as easily from small trucks hidden in nearby desert.

Is the US drawing the world back into war?

If you look to the calmly trading oil market for answers, it doesn’t seem likely. Oil prices have been falling, not rising.

And there are a few good reasons for this.

For one thing, the US can’t afford a conflict. Its last two conflicts have cost $1 trillion each. Obama has asked Congress to raise the US debt ceiling (again) by $1.2 trillion to $16.4 trillion. And that’s just to pay for the yawning gap between tax revenues and government expenses.

More importantly, the US knows conflict would lead to oil prices high enough to freeze economic growth in its tracks.

But Iran has rephrased its threat slightly over the weekend. Ahmad Valid, Iran’s defence minister, has back-pedaled and said Iran did not actually say “it will close the strait”.

Making sure everyone understands each other would be a good start.

The US has lobbied China and Europe to drop Iranian oil, but has not made much progress. China doesn’t seem interested. Europe has asked for six months to consider its options. Japan, South Korea and India have said they would only reduce their use. Sanctions are only partly in place.

So far it seems the US has stirred up Iran, without achieving anything.

Quite rightly, the countries that buy oil from Iran would like to know where they could get oil from instead. 5% of global supply is not easy to replace. Saudi Arabia, the world’s largest oil exporter, is confident it can bridge the shortfall. Ali Naomi, Saudi Arabia’s oil minister said, “Whatever customers want, we will give it to them.”

But it is widely believed that Saudi Arabia is already at peak production, and doesn’t have anywhere near the reserves it claims to have. So whether it can bridge the shortfall is to be seen.

Needless to say, this kind of talk has drawn Saudi Arabia into the fray. Iran has said, “Such moves are not considered friendly, and that the consequences…could not be predicted.”

The US would prefer to avoid conflict. But Iran could be unpredictable when backed into a corner. How this will pan out is impossible to say.

The Strategy Ahead

It does point to the increasing importance of sourcing energy from less volatile regions, preferably from your own doorstep. For example, the shale gas revolution in the US has given it an entirely new home-grown energy source. Shale gas projects in Australia are having some success as well.

Being self-sufficient will become more important as global tensions build over energy supplies. But it’s not just the Strait of Hormuz that we should focus on.

The South China Sea is a bit closer to home. And it could be a more important flash point. About 30% of the world’s seaborne oil is shipped through the 2 km wide Straits of Malacca (between Singapore and Sumatra), into the South China Sea.

China has been throwing its weight around much more in the last few years, claiming disputed territories and islands.

The US has recently stepped up its footprint in the area. It has promised to divert its military resources to police the region in the 21st century.

This military build-up in our backyard could have big implications for energy stocks in the future. And there will be some highly profitable investing opportunities on the back of it.

Dr. Alex Cowie
Editor, Diggers & Drillers

Related Articles

Special Report: Six Extraordinary Resource Investment Opportunities for 2012

The End of the Debt Supercycle

The Only Gold and Silver Stocks to Buy


How Global Oil Supplies Could Fall 40% Overnight

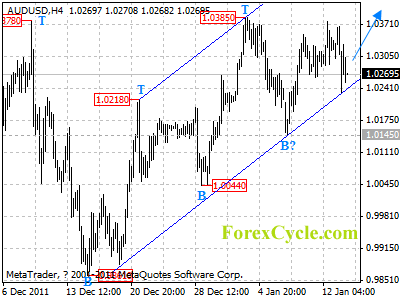
AUDUSD moved sideways in a range

AUDUSD moved sideways in a range between 1.0145 and 1.0385. Initial support is at the lower line of the price channel on 4-hour chart, and the key support is at 1.0145, as long as 1.0145 support holds, the price action in the trading range is treated as consolidation of uptrend from 0.9861, and another rise towards 1.0600 is still possible, only a breakdown below 1.0145 will indicate the the rise from 0.9861 has completed at 1.0385 already, then the following downward movement could bring price back to 0.9500 area.

audusd

Daily Forex Forecast

JP Morgan Cuts Sohu.com Target To $68 From $91

JP Morgan (NYSE:JPM) cut its price target on shares of Sohu.com (NASDAQ:SOHU) from $91 to $68, but shares of the company are still trading 2% higher premarket.The company’s shares are being buoyed by the fact that JPM’s new target price still shows 28% of upside from its current price as analysts maintained their Overweight rating.Sohu.com (NASDAQ:SOHU) has potential upside of 51.1% based on a current price of $53.79 and an average consensus analyst price target of $81.27.Sohu.com is currently above its 50-day moving average (MA) of $52.43 and should find resistance at its 200-day MA of $70.79.

Currencies: Forex Futures Speculators raise Dollar, Yen, Aussie bets as Euro sinks lower

By CountingPips.com

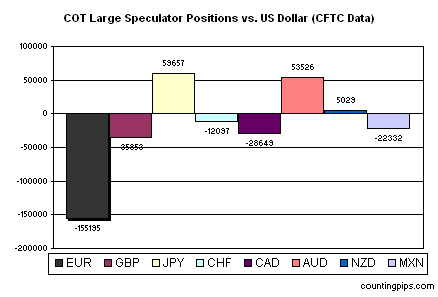
The latest Commitments of Traders (COT) report, released on Friday by the Commodity Futures Trading Commission (CFTC), showed that large futures speculators raised their overall long bets for the US dollar last week against the other major currencies while Euro short positions continued to increase and rose to a new record level for a third consecutive week.

Non-commercial futures traders, usually hedge funds and large speculators, added to their total US dollar long positions to $17.43 billion on January 10th from a total long position of $15.71 billion on January 3rd, according to the CFTC COT data and calculations by Reuters which calculates the dollar positions against the euro, British pound, Japanese yen, Australian dollar, Canadian dollar and the Swiss franc.

Individual Currencies:

EuroFX: Currency speculators once again added to their Euro short positions as of January 10th and raised their short bets to a new record high. Euro short positions numbered a total of 155,195 net short contracts from the previous week’s total of 138,909 net short contracts as sentiment for the common European currency erodes.


The COT report is published every Friday by the Commodity Futures Trading Commission (CFTC) and shows futures positions as of the previous Tuesday. It can be a useful tool for traders to gauge investor sentiment and to look for potential changes in the direction of a currency or commodity. Each currency contract is a quote for that currency directly against the U.S. dollar, where as a net short amount of contracts means that more speculators are betting that currency to fall against the dollar and net long position expect that currency to rise versus the dollar. The graphs overlay the forex spot closing price of each Tuesday when COT trader positions are reported for each corresponding spot currency pair.

GBP: Bearish bets of the British pound sterling rose for a third consecutive week as of January 10th to the lowest level since November 22nd. British pound positions saw a total of 35,853 short positions on January 10th following a total of 31,899 net short positions registered on January 3rd.

JPY: The Japanese yen net long speculative contracts increased higher for a second consecutive week, according to the latest data on January 10th. Yen long positions rose to a total of 59,657 net long contracts reported on January 10th following a total of 56,481 net long contracts that were reported on January 3rd. Yen speculative positions are now at their highest level in over a year surpassing the August 2nd level when long positions registered 58,833 contracts.

CHF: Swiss franc speculators slightly decreased their short bets against the Swiss currency as of January 10th. Speculator positions for the Swiss currency futures numbered a total of 12,097 net short contracts on January 10th following a total of 12,355 net short contracts as of January 3rd.

CAD: Canadian dollar positions fell for a second consecutive week to a total of 20,649 net short contracts as of January 10th following a total of 23,371 short contracts reported on January 3rd. CAD positions are now at their lowest level in at least a year after surpassing the previous low registered on November 29th at 26,869 short contracts.

AUD: The Australian dollar long positions advanced higher for a third consecutive week as of January 10th. Australian dollar positions increased to a total net amount of 53,526 long contracts on January 10th after totaling 46,537 net long contracts reported as of January 3rd. The AUD speculative positions are now at their highest level since August 2nd when Australian dollar long positions totaled 75,598.

NZD: New Zealand dollar futures speculator positions increased higher for a third consecutive week through January 10th. NZD contracts increased to a total of 5,029 net long contracts as of January 10th following a total of 2,436  net long contracts registered the previous week. NZD positions have increased for three straight weeks from the December 20th standing (612 long contracts) which was the lowest position since March 29th when positions equaled 239 long contracts.

MXN: Mexican peso speculative contracts improved slightly against the US dollar as traders continue to short the Mexican currency and the positions have made little movement since turning over to the short side. Peso short positions numbered a total of 22,332 net short speculative positions as of January 10th following a total of 25,829 short contracts that were reported on January 3rd.

COT Currency Data Summary as of January 10, 2012
Large Speculators Net Positions vs. the US Dollar

EUR -155195
GBP -35853
JPY +59657
CHF -12097
CAD -28649
AUD +53526
NZD +5029
MXN -22332

Other COT Trading Resources:

Trading Forex Using the COT Report


Five Fatal Flaws of Trading

By Elliott Wave International

Close to ninety percent of all traders lose money. The remaining ten percent somehow manage to either break even or even turn a profit — and more importantly, do it consistently. How do they do that?

That’s an age-old question. While there is no magic formula, EWI Senior Instructor Jeffrey Kennedy has identified five fundamental flaws that, in his opinion, stop most traders from being consistently successful. We don’t claim to have found The Holy Grail of trading here, but sometimes a single idea can change a person’s life. Maybe you’ll find one in Jeffrey’s take on trading. We sincerely hope so.

The following is an excerpt from Jeffrey Kennedy’s Trader’s Classroom Collection, Volume 4. Learn how to get 14 more actionable trading lessons — FREE — below.

Why Do Traders Lose?

If you’ve been trading for a long time, you no doubt have felt that a monstrous, invisible hand sometimes reaches into your trading account and takes out money. It doesn’t seem to matter how many books you buy, how many seminars you attend or how many hours you spend analyzing price charts, you just can’t seem to prevent that invisible hand from depleting your trading account funds.

Which brings us to the question: Why do traders lose? Or maybe we should ask, “How do you stop the Hand?” Whether you are a seasoned professional or just thinking about opening your first trading account, the ability to stop the Hand is proportional to how well you understand and overcome the Five Fatal Flaws of trading. For each fatal flaw represents a finger on the invisible hand that wreaks havoc with your trading account.

Fatal Flaw No. 1 — Lack of Methodology
If you aim to be a consistently successful trader, then you must have a defined trading methodology, which is simply a clear and concise way of looking at markets. Guessing or going by gut instinct won’t work over the long run. If you don’t have a defined trading methodology, then you don’t have a way to know what constitutes a buy or sell signal. Moreover, you can’t even consistently correctly identify the trend.

How to overcome this fatal flaw? Answer: Write down your methodology. Define in writing what your analytical tools are and, more importantly, how you use them. It doesn’t matter whether you use the Wave Principle, Point and Figure charts, Stochastics, RSI or a combination of all of the above. What does matter is that you actually take the effort to define it (i.e., what constitutes a buy, a sell, your trailing stop and instructions on exiting a position). And the best hint I can give you regarding developing a defined trading methodology is this: If you can’t fit it on the back of a business card, it’s probably too complicated.

Fatal Flaw No. 2 — Lack of Discipline
When you have clearly outlined and identified your trading methodology, then you must have the discipline to follow your system. A Lack of Discipline in this regard is the second fatal flaw. If the way you view a price chart or evaluate a potential trade setup is different from how you did it a month ago, then you have either not identified your methodology or you lack the discipline to follow the methodology you have identified. The formula for success is to consistently apply a proven methodology. So the best advice I can give you to overcome a lack of discipline is to define a trading methodology that works best for you and follow it religiously.

Fatal Flaw No. 3 — Unrealistic Expectations
Between you and me, nothing makes me angrier than those commercials that say something like, “…$5,000 properly positioned in Natural Gas can give you returns of over $40,000…” Advertisements like this are a disservice to the financial industry as a whole and end up costing uneducated investors a lot more than $5,000. In addition, they help to create the third fatal flaw: Unrealistic Expectations.

Yes, it is possible to experience above-average returns trading your own account. However, it’s difficult to do it without taking on above-average risk. So what is a realistic return to shoot for in your first year as a trader — 50%, 100%, 200%? Whoa, let’s rein in those unrealistic expectations. In my opinion, the goal for every trader their first year out should be not to lose money. In other words, shoot for a 0% return your first year. If you can manage that, then in year two, try to beat the Dow or the S&P. These goals may not be flashy but they are realistic, and if you can learn to live with them — and achieve them — you will fend off the Hand.

Fatal Flaw No. 4 — Lack of Patience
The fourth finger of the invisible hand that robs your trading account is Lack of Patience. I forget where, but I once read that markets trend only 20% of the time, and, from my experience, I would say that this is an accurate statement. So think about it, the other 80% of the time the markets are not trending in one clear direction.

That may explain why I believe that for any given time frame, there are only two or three really good trading opportunities. For example, if you’re a long-term trader, there are typically only two or three compelling tradable moves in a market during any given year. Similarly, if you are a short-term trader, there are only two or three high-quality trade setups in a given week.

All too often, because trading is inherently exciting (and anything involving money usually is exciting), it’s easy to feel like you’re missing the party if you don’t trade a lot. As a result, you start taking trade setups of lesser and lesser quality and begin to over-trade.

How do you overcome this lack of patience? The advice I have found to be most valuable is to remind yourself that every week, there is another trade-of-the-year. In other words, don’t worry about missing an opportunity today, because there will be another one tomorrow, next week and next month…I promise.

I remember a line from a movie (either Sergeant York with Gary Cooper or The Patriot with Mel Gibson) in which one character gives advice to another on how to shoot a rifle: “Aim small, miss small.” I offer the same advice in this new context. To aim small requires patience. So be patient, and you’ll miss small.

Fatal Flaw No. 5 — Lack of Money Management
The final fatal flaw to overcome as a trader is a Lack of Money Management, and this topic deserves more than just a few paragraphs, because money management encompasses risk/reward analysis, probability of success and failure, protective stops and so much more. Even so, I would like to address the subject of money management with a focus on risk as a function of portfolio size.

Now the big boys (i.e., the professional traders) tend to limit their risk on any given position to 1% – 3% of their portfolio. If we apply this rule to ourselves, then for every $5,000 we have in our trading account, we can risk only $50 – $150 on any given trade. Stocks might be a little different, but a $50 stop in Corn, which is one point, is simply too tight a stop, especially when the 10-day average trading range in Corn recently has been more than 10 points. A more plausible stop might be five points or 10, in which case, depending on what percentage of your total portfolio you want to risk, you would need an account size between $15,000 and $50,000.

Simply put, I believe that many traders begin to trade either under-funded or without sufficient capital in their trading account to trade the markets they choose to trade. And that doesn’t even address the size that they trade (i.e., multiple contracts).

To overcome this fatal flaw, let me expand on the logic from the “aim small, miss small” movie line. If you have a small trading account, then trade small. You can accomplish this by trading fewer contracts, or trading e-mini contracts or even stocks. Bottom line, on your way to becoming a consistently successful trader, you must realize that one key is longevity. If your risk on any given position is relatively small, then you can weather the rough spots. Conversely, if you risk 25% of your portfolio on each trade, after four consecutive losers, you’re out all together.

Break the Hand’s Grip
Trading successfully is not easy. It’s hard work…damn hard. And if anyone leads you to believe otherwise, run the other way, and fast. But this hard work can be rewarding, above-average gains are possible and the sense of satisfaction one feels after a few nice trades is absolutely priceless. To get to that point, though, you must first break the fingers of the Hand that is holding you back and stealing money from your trading account. I can guarantee that if you attend to the five fatal flaws I’ve outlined, you won’t be caught red-handed stealing from your own account.


Get 14 Critical Lessons Every Trader Should Know

Learn about managing your emotions, developing your trading methodology, and the importance of discipline in your trading decisions in The Best of Trader’s Classroom, a FREE 45-page eBook from Elliott Wave International.

Since 1999, Jeffrey Kennedy has produced dozens of Trader’s Classroom lessons exclusively for his subscribers. Now you can get “the best of the best” in these 14 lessons that offer the most critical information every trader should know.

Find out why traders fail, the three phases of a trader’s education, and how to make yourself a better trader with lessons on the Wave Principle, bar patterns, Fibonacci sequences, and more!

Don’t miss your chance to improve your trading. Download your FREE eBook today!


This article was syndicated by Elliott Wave International and was originally published under the headline Five Fatal Flaws of Trading. EWI is the world’s largest market forecasting firm. Its staff of full-time analysts led by Chartered Market Technician Robert Prechter provides 24-hour-a-day market analysis to institutional and private investors around the world.


Ahmedinejad Visits Latin America, Washington Implores and Seethes

At the best of times, the U.S. government is regarded as somewhat out of touch with what’s happening in the American “heartland,” much less the world at large, so much so that the phrase “inside the Beltway” was coined to define the syndrome.

But every now and again, an incident occurs that so perfectly encapsulates Washington’s self-absorbed navel gazing that little further comment is needed.

On 9 January U.S. State Department spokeswoman Victoria Nuland provided such a “Kodak moment” to the Washington press corps.

The object of her concern? Iranian President Mahmoud Ahmedinejad’s visit to Latin America, where he is touring Venezuela, Cuba, Ecuador and Nicaragua.

Nuland said that, because of its civilian nuclear energy program, which both Washington and Tel Aviv believe masks a covert nuclear program despite persistent denials by Tehran, Iran should have no friends and that “We are making absolutely clear to countries around the world that now is not the time to be deepening ties, not security ties, not economic ties, with Iran.”

During a regularly scheduled State Department press briefing Nuland gravely observed that Iran had “obviously carefully” chosen the four countries but “We are, meanwhile, calling on all of these countries to do what they can to impress upon the Iranian regime that the course that it’s on in its nuclear dialogue with the international community is the wrong one. And, frankly, we think it’s in the interest of all countries, including the countries that he (Ahmadinejad) is visiting in Latin America, that Iran proves the peaceful intent of its nuclear program to the world.”

The view from Caracas?

During a meeting with Ahmadinejad, Venezuelan President Hugo Chavez tartly accused the U.S. and its European allies of demonizing Iran and using false claims about the nuclear issue “like they used the excuse of weapons of mass destruction to do what they did in Iraq. They (the U.S.) accuse us of being warmongers. They’re the threat,” adding that Ahmadinejad is traveling through “the axis of evil of Latin America.”

Driving the point home, Ahmadinejad commented, “They say we’re making a bomb. Fortunately, the majority of Latin American countries are aware. Everyone knows that those words… are a joke. It’s something to laugh at. It’s clear they’re afraid of our development.”

What is Venezuela getting out of its dalliance with charter “axis of evil” Iran?

According to Chavez, Iran has helped his country build 14,000 homes as well as factories that produce food, tractors and vehicles. During Ahmadinejad’s visit, Iranian and Venezuelan government officials signed two agreements promoting industrial cooperation and worker training.

Why might Venezuela take such an uppity stance against Washington’s wishes? Well, for a start the U.S. government was deeply implicated in a failed 2002 military coup against Chavez. And last year, the U.S. imposed sanctions on Venezuelan state oil company Petroleos de Venezuela SA for delivering at least two cargoes of refined oil products to Iran.

From Venezuela, on 10 January Ahmadinejad flew to Nicaragua to attend the inauguration of President Daniel Ortega, elected to a third term last November.

And why might Nicaragua be disinclined to heed Washington’s advice? Perhaps the fact that President Ortega was one of the Sandinista leader who in 1979 overthrew the corrupt presidency of Anatasio Somoza, only to find itself under attack by U.S. armed and funded “Contra” insurgents operating out of neighboring Honduras in an eight-year campaign.

And, in one of those piquant ironies of history, the Reagan administration, in order to support the Contras after Congress blocked funding, in 1986-1987 covertly sold weapons for cash to… Iran, leading to the notorious “Iran-Contra” affair.

And Cuba? Well, since the U.S. has blockaded the country with economic sanctions since 1960 and currently has no direct diplomatic relations, perhaps Nuland’s entreaties will receive less consideration in Havana than they might.

Which leaves Ecuador, whose president, Rafael Vicente Correa, an economist by training educated in Belgium and the United States, took office in January 2007.

And what has President Correa done to antagonize the U.S.?

In December 2008, he declared Ecuador’s national debt illegitimate, arguing that it had been contracted by previous despotic regimes, pledging to fight creditors in international courts of jurisdiction. Even worse, Correa in June 2009 brought Ecuador into the Alianza Bolivariana para los Pueblos de Nuestra America (Bolivarian Alliance for the Peoples of Our Americas, or ALBA) founded by Chavez in alliance with Cuba in 2004.

The biggest story overlooked by the Washington press corps over the past decade, fixated as it was on the Bush administration’s “global war on terror” (GWOT) was Latin America’s increasing assertiveness and independence from America’s dictates, whose policies towards its southern neighbors even the august Council on Foreign Relations labeled “hegemony.” It apparently has yet to occur to either Ms. Nuland or her superiors that countries south of the Rio Grande regard the Monroe Doctrine as a dead letter.

But Ahmedinejad’s biggest secret diplomatic weapon is treating his Latin American hosts with respect, as equals. Until those “inside the Beltway” learn that simple lesson and that it’s no longer 1823, the year the Monroe Doctrine was proclaimed, it would seem that the Washington press corps is bound to endure further briefings from Ms. Nuland.

Source: http://oilprice.com/Geo-Politics/International/Ahmedinejad-Visits-Latin-America-Washington-Implores-and-Seethes.html

By. John C.K. Daly of oilprice.com


Forex – MACD Trading Strategies

No indicator can give all correct signals all the time and hence continuous refinement in the strategies to use an indicator is a must to avoid as many false signals as possible. Getting a few signals which are good is always better than getting a lot of signals of poor quality.

Moving average convergence divergence or MACD in short is used very commonly in technical analysis for trading. MACD is a lagging indicator and that means that any signals by the crossover of MACD and its signal line are generated with some lag in time. The signals are generated after a confirmation of the move in a particular direction this comes with a time lag. When the trend is weaker, this lagging would tend to cause more false signals.

Why more false signals during weak trends or when the market is ranging or running sideways?:

1) Entry signal: By the time the entry signal is generated, the price may be reaching the reversal point because during the time lag the trend becomes further weaker and market is on the verge of reversal.
2) Exit Signals: By the time the reversal crossover takes place and signals that we should close our position to take profit, the price already reverses so much that the realized profits levels are much less than the realization levels if would have closed the trade sooner.

Though the most important factor in trading are the skills, knowledge and trading discipline but there are always possibilities of improving our indicators also. The improvement can be either by the change in the logic by adding new conditions or by experimenting with different period settings. What we wish to always achieve is to have lesser and lesser percentage of false signals. Albin, Gunter and Kain came up with some refinements in the original MACD for reducing the percentage of false signals which may otherwise be generated. The first refined version is known as MACD R1 and the second is MACD R2 as the subsequent one.

Let’s check what MACD-R1 and MACD-R2 are. Our trading platform most probably will not have these refined versions but considering the logics of these, we may think about improving our MACD trading strategies.

MACD-R1:

a) One more condition was added and that was to wait for three periods (days on daily chart) after the MACD line crosses the signal line upwards or downwards before we take a position. This wait was to ensure that the signal was not false and an immediate reversal does not take place as soon as we take a position. If during this 3 periods another crossover takes place then we forget the first crossover and wait for another 3 periods to ensure this reversal.

b) To avoid the exit problem as mentioned in point number 2 above, MACD R1 has the profit taking levels as pre-decided percentages. In a nut and shell it says that don’t be greedy and come out of a trade with certain pre-decided percent of profits. These suggested profit taking percentages were 3% or 5%. So MACD R1 says that close the trade after 3% or 5% gain after the entry. In case a reversal crossover takes place before this pre-decided target of 3% or 5% then also we should close the trade.

MACD-R1 – weaknesses:

1) Even with these additional conditions there still is higher number of false signals.

2) Loss in the profits: Let’s assume that it is a strong uptrend and after taking a buy position the prices move up by 8%. And what we did was, we closed the position after 3% or 5% profit and hence the opportunity of making higher gains was lost. basically we may end up in making a big loss in the profit and that goes against the mantra that let your profits run and cut your losses short.

MACD-R2:

To overcome the above mentioned issue of still higher number of false signals by MACD R1 an additional condition was added in terms of further refinement. The new refined version is known as MACD-R2.

Let’s think why MACD-R1 still offers possibilities of reducing the false signals:

Scenario: We wait for 3 periods to have the confirmation of the trend continuation by seeing that no reversal crossover takes place during this waiting period. And after this 3 periods we enter the market. As soon as we enter the market, a reversal takes place and we end up with losses.

Now let’s see why the above mentioned scenario is possible and what did we miss to avoid it:

This can happen because we waited for the confirmation but ignored another warning signal i.e. what did not happen may happen soon now.

This may happen because though by the end of the 3 periods after the original crossover, another reversal crossover does not take place but the MACD line comes dangerously close to the signal line to indicate a reversal. The difference between the MACD and signal line reduces drastically. We are not keeping track of this development and ignore this reducing difference between MACD line the signal line even though it indicates the possibilities of a reversal crossover.

What additional changes/conditions are there in MACD-R2:

Now when we know what we missed, we have to add that condition so that we do not lose the track of the reducing difference indicating a reversal.

An additional condition was added apart from the original concepts of MACD-R1 to design MACD R2. This condition is to ensure that we keep a track of the difference between the MACD line and the signal line and do not ignore a warning signal of a possible reversal. This condition ensures that a pre-decided difference maintains between MACD and MACD signal line even after waiting for 3 periods and then only we enter the market. If the difference between MACD line and the signal line goes lesser than the pre-decided level then we do not enter the market. [Please find more details about MACD and moving averages for technical analysis in Forex trading at FA (ForexAbode)]

Suppose we decide that the minimum difference between MACD and signal line should be at least 1.2% at the end of 3 periods. What it means is if the difference between these two lines is less than 1.2% then should not take trade position. We decide this difference percentage based on the experience that a difference less than this may indicate a possible reversal.

For the explanation of this third condition please see the following example:

Let’s consider that we are talking about daily trading chart which means that 1 period means 1 day.

1) Suppose MACD and MACD signal line crossover takes place on July 1st.
2) We wait for 3 days and see that no further crossover has taken place during this time i.e. till July 4th.
3) We check the price. Let’s say it is 150.00
4) We check MACD (12 day EMA – 26 days EMA). let’s say it is 5.
5) We check the signal line (previous 9 days EMA of MACD). let’s say it is 3.
6) We use the formula (MACD-Signal line after 3 periods)*100/(price)
i.e. (5-3)*100/150 = 1.33%
now as 1.33% difference is bigger than the pre-decided minimum difference i.e. 1.2%. This indicates that we can enter a trade as a reversal crossover may not be taking place soon.

In the case that the difference between MACD and its signal line was less than 1.2% then we would not have entered the market as suggested by the MACD signal 3 periods back.

Article by ForexAbode


Google Currently In Talks with LG on TV Service

Bloomberg reports that Google (NASDAQ:GOOG) may give LG Electronics first access to the next version of its Google TV software so LG can build a compatible set, according to two individuals with knowledge of the project.The deal would be similar to the one Google has with Samsung and HTC to create Nexus handsets for Android.Google (NASDAQ:GOOG) has potential upside of 16% based on a current price of $629.64 and an average consensus analyst price target of $730.3.

Novartis To Restructure U.S. business, Cut 1,960 Positions

Novartis (NYSE:NVS) plans to strengthen its long-term competitive position in anticipation of the Diovan patent expiration and an expected reduction in demand for Rasilez/Tekturna following termination of the ALTITUDE clinical study. The company plans to reduce its cost base with the current restructuring focused on the US market. A central element of the plan is a restructuring of the General Medicines business in the important US market, where Novartis Pharmaceuticals will continue to focus on expanding its presence in specialty businesses aligned with the product portfolio and pipeline. As a result, the field force is planned to be reduced by approximately 1,630 positions and headquarters functions will realign to support the new organization, resulting in an additional reduction of approximately 330 positions. The changes are planned to take effect in the second quarter of 2012, and associates will be notified in early April. Novartis (NYSE:NVS) has potential upside of 18% based on a current price of $55.3 and an average consensus analyst price target of $65.26.