Are We Using Less Energy Than We Did 40 Years Ago?

Are We Using Less Energy Than We Did 40 Years Ago?

by David Fessler, Investment U Senior Analyst
Wednesday, November 2, 2011

Those of you in your fifties (my decade) or older remember the Arab oil embargo of 1973 to 1974. That’s when tensions in the Middle East caused the price of crude oil to quadruple from $3.00 per barrel to $12 per barrel in a matter of months.

The gas lines at my local filling station stretched down the street and out of sight. In the last week of February 1974, the American Automobile Association reported 20 percent of American service stations had no gasoline at all.

As a result of the OPEC embargo, the government scrambled to save energy. Gasoline and diesel rationing was instituted. A national speed limit of 55 mph was enforced. The United States began development of the Strategic Petroleum Reserve. The Department of Energy was created, and year-round daylight savings time was put in place.

Even NASCAR got into the act, reducing all race distances by 10 percent. In 1974, both the 12 Hours of Sebring and the 24 Hours of Daytona were cancelled.

Cars were redesigned. Small, front-wheel drive models began to replace the big front-engine, rear-wheel drive models. Interest in renewable energy skyrocketed, spurring research in wind and solar power. (Sound familiar?)

Now let’s fast-forward nearly 40 years to today. How does our energy use on a per capita basis compare to that of the post-oil embargo era?

You might be surprised to learn it hasn’t changed one bit. As you can see from the graph below, Americans use about the same amount of energy on a per capita basis as they did 40 years ago.

Annual American Energy Consumption

There are several reasons for this. Part of the reason was a geographical shift in population. Taking a look at the graph below from the U.S. Census, and you can see that the mean “center” for the entire population of the country has slowly but surely moved towards warmer and drier climates. This partially offset the building boom of larger and larger homes, that by their very nature require more energy to cool, heat and light.

America's Geographical Shift in Population

But the big reason had nothing to do with people moving around. Once again, increased energy efficiency has played a crucial role in our overall energy use remaining the same.

When the National Appliance Energy Conservation Act of 1987 was passed, it was a whole new ballgame for appliance manufacturers.

Makers of household appliances such as water heaters, furnaces, heat pumps, air conditioners, refrigerators and freezers all had to meet tough new standards for energy efficiency.

Go into any appliances store now and the ubiquitous yellow label denotes that particular model’s power consumption and expected yearly costs. It makes it easy for consumers to do an apples-to-apples comparison.

Light bulbs are moving from incandescents to CFLs and are well on the way to eventually being all LEDs. It will take a while, but we’ll see a lot of savings there, as well. Cree, Inc. (Nasdaq: CREE) is a big maker of LEDs, and should eventually benefit as the switchover gathers steam.

Energy management systems from the likes of Honeywell International, Inc. (NYSE: HON), and Johnson Controls, Inc. (NYSE: JCI) will continue to ensure commercial customers keep their energy costs as low as they possibly can, without relying on individuals to turn off the lights.

I’d avoid appliance makers at the moment. Whirlpool Corporation (NYSE: WHR) just reported less-than-stellar earnings, and guided lower. Consumers aren’t buying new big-ticket appliances like they were a few years ago.

The bottom line is that energy efficiency is doing more to save our energy skins than a bunch of solar panels or wind generators. We’ll see even more of that in the months and years ahead.

Good investing,

David Fessler

Article by Investment U

Gold Rebounds, Greek People asked to say “Yes or No” to Euro, FOMC “To Lay Ground for QE2”

London Gold Market Report
from Ben Traynor
BullionVault
Wednesday 2 November, 09:00 EDT

THE SPOT MARKET gold price climbed to $1736 an ounce in early London trading – 3.1% above Tuesday’s low – before falling back a bit, while European stock makrets halted recent steep declines but failed to stage a convincing rally following news that Greece’s prime minister had been summoned to France to explain himself after calling for a referendum on last week’s bailout deal.

“This latest development…will make markets that much more skeptical of the reassurances that inevitably will be offered by other Eurozone leaders in the coming days,” says one gold bullion dealer here in London.

“The medium term trend in the gold price remains bullish,” adds Commerzbank technical analyst Axel Rudolph, “while [gold is] trading above the $1595.65 October low.”

Silver prices hovered around $33.80 per ounce – 4.3% down for the week so far.

On the futures markets, prices for most commodities edged higher, while US, UK and German government bonds all sold off.

The Euro rallied against the Dollar after three days of losses – though it remains significantly below where it was a few days ago.

Greek prime minister George Papandreou was summoned to Cannes on Wednesday for a meeting with German chancellor Angela Merkel and French president Nicolas Sarkozy, ahead of the G20 summit.

The meeting follows Papandreou’s call for Greece to hold a referendum on the bailout package agreed last week.

The Greek cabinet last night backed Papandreou’s referendum call – although some ministers reportedly expressed their reservations, but decided to back the government ahead of a confidence vote scheduled for this Friday.

“The dilemma isn’t ‘This or another government’,” Papandreou told his ministers on Wednesday before heading to Cannes.

“The dilemma is ‘Yes or no to the loan accord’, ‘Yes or no to Europe’, ‘Yes or no to the Euro.'”

“Giving the people a say is always legitimate,” French president Nicolas Sarkozy said last night.

“But the solidarity of all countries of the Eurozone cannot work unless each one consents to the necessary efforts…[last week’s deal] is the only way to solve Greece’s debt problem.”

“[The deal to which] we just agreed last week cannot be placed back on the table,” added German foreign minister Guido Westerwelle.

Last week’s agreement included a 50% ‘haircut’ on private sector-held Greek bonds.

However, points out Michael Kemmer, head of Germany’s banking lobby, “I can’t imagine a debt exchange taking place before the referendum.”

The Greek government says the referendum will take place “as soon as possible”, once the details of the bailout are known.

The Euro rallied over 2% against the Dollar last Thursday after the deal was announced. Since then, however, it has fallen by over 4%.

The Euro gold price on Wednesday morning meantime were around 3% higher than last Thursday’s low.

Elsewhere in Europe, a €3 billion auction of European Financial Stability Facility bonds scheduled for today has been postponed, with the lead managers on the issue citing “recent market volatility”.

Klaus Regling, EFSF chief executive, last week travelled to China and Japan to present the advantages of investing debt issued by the triple-A rated Eurozone bailout fund. Neither country committed to buying bonds.

Italian 10-Year government bond yields remained above 6% Wednesday morning despite retreating from Tuesday’s highs.

Yields on shorter-dated debt meantime have risen sharply since last Thursday. Italian 6-Month Treasury Bill yields have risen from 3.5% to 4.5%, while 12-Month have gone from 3.8% to nearly 5.2%.

Back in July, Italy cancelled an auction of medium and long-dated bonds scheduled for August, announcing that 12-Month Bills would be regularly offered instead.

German unemployment meantime rose in October by 10,000 people – the first monthly unemployment rise since February 2010 – according to official data released this morning.

“People who hadn’t realized before should realize now that Europe’s issues will continue to be troublesome and difficult,” says Jeremy Friesen, Hong Kong-based commodities strategist at Societe Generale.

“There will continue to be risks, which will put more and more pressure on central banks…to be more accommodative,” a development which Friesen adds “will be bullish” for the gold price.

Over in Washington, the Federal Open Market Committee – which decides US monetary policy – is due to conclude its two-day policy meeting later today.

“We are becoming increasingly persuaded that QE3 is coming,” says Dana Saporta, US economist at Credit Suisse in New York, referring to a possible third round of quantitative easing.

“The best guess is at this meeting they’ll try to build some consensus around the idea and lay the groundwork for eventual purchases.”

Private sector employment in the US rose by 110,000 people last month – compared to 116,000 in September – according to the ADP Employment Change report, published today by payroll services firm Automatic Data Processing. The ADP report is released each month ahead of the US Bureau of Labor Statistics nonfarm payrolls data.

Ben Traynor
BullionVault

Gold value calculator   |   Buy gold online at live prices

Editor of Gold News, the analysis and investment research site from world-leading gold ownership service BullionVault, Ben Traynor was formerly editor of the Fleet Street Letter, the UK’s longest-running investment letter. A Cambridge economics graduate, he is a professional writer and editor with a specialist interest in monetary economics.

(c) BullionVault 2011

Please Note: This article is to inform your thinking, not lead it. Only you can decide the best place for your money, and any decision you make will put your money at risk. Information or data included here may have already been overtaken by events – and must be verified elsewhere – should you choose to act on it.

Markets Begin to Recover from Greek Referendum Surprise

Source: ForexYard

printprofile

Markets this morning are in a much calmer state a day after the announcement of the Greek referendum but the tepid recovery should not overshadow the underlying uncertainty that remains surrounding the Greek bailout. The EUR is beginning to form a base for a recovery as the North American trading session nears with all eyes on the ADP jobs report and the Fed.

European equities are up 0.5% while the EUR/USD in turn is higher by almost 1%. The EUR has also put in gains in the crosses. With a bit of solidarity coming from the Greek cabinet in support of the referendum the EUR has managed to move higher though near-term gains have been capped at 1.3800.

The USD/JPY is once again sliding lower under the 78 yen level on overall USD weakness for the day. With Monday’s intervention estimated to be a record ¥7 trn the yen looks to continue to strengthen and the USD/JPY could once again drift lower towards its record low. The relationship between the USD and the JPY is highly correlated between the spreads of nations’ 10-year bonds. Given the possibility of additional moves to ease US monetary policy it is unlikely that the US 10-year note will be yielding much more than its current 2.06%. The USD/JPY may have scope back to 77.50 from the mid-October high. Additional yen strength could push the EUR/JPY lower to yesterday’s low of 106.50.

US job numbers and monetary policy are coming into focus this afternoon. The ADP jobs report is typically the preview of Friday’s jobs report but there is very little evidence showing the private report has any success forecasting the outcome of the NFP report. Today’s WSJ article did not hint at additional policy measures to be taken by the Fed but Bernanke’s press conference at 18:15 GMT may provide fireworks. The next short-term resistance for the EUR/USD is found at 1.3870 from yesterday. To the downside losses may be capped at yesterday’s low of 1.3600.

Read more forex trading news on our forex blog.

Forex Market Analysis provided by ForexYard.

© 2006 by FxYard Ltd

Disclaimer: Trading Foreign Exchange carries a high level of risk and may not be suitable for all investors. There is a possibility that you could sustain a loss of all of your investment and therefore you should not invest money that you cannot afford to lose. You should be aware of all the risks associated with Foreign Exchange trading.

Bernanke’s Press Conference: Watch For Fireworks

By ForexYard

The market’s focus on euro zone events should not come as a surprise given the recent two year anniversary of the European debt crisis. Investors will be no less inclined after the decision by Greek Prime Minister George Papandreou to offer a referendum on the EU bailout package. However, today’s FOMC decision highlights one of the main themes of the foreign exchange markets over the past few years; USD weakness. While the FOMC statement may go materially unchanged the newly introduced FOMC press conference with Chairman Ben Bernanke may provide a bit more fireworks.

Economic News

USD – Ignore the FOMC Statement, Focus on the Press Conference

The USD continues to lose the FX beauty pageant of the least ugly currency. Despite a sovereign debt crisis that has spread throughout Europe the EUR/USD has been relatively buoyant while USD index continues to trade near its lows as of last week. The driver of this USD weakness has ultimately been the monetary policy of the Federal Reserve given the two previous programs of quantitative easing.

FOMC members have done a fine job of prepping the market for additional easing of US monetary policy. Beginning with a speech in Cleveland, Ohio in late September Ben Bernanke may have signaled his determination to introduce additional policy measures. This dovish stance has also been promoted by a number of FOMC members including Janet Yellen and William Dudley.

Given the mixed to better than expected economic data releases from Q3 (GDP, NFP, retail sales) and such close proximity to the introduction of Operation Twist, tomorrow’s FOMC statement/press conference may or may not contain references to QE3. Though given yesterday’s ISM Manufacturing PMI number that has fallen to 50.8 from 51.6, the foundation for an additional round of monetary policy easing is beginning to come to fruition and with it a USD negative. While an FOMC statement without changes to the specific wording is often met with yawns from the market, Bernanke’s press conference to follow may provide a bit more fireworks.

EUR – Democracy Reigns in Greece where it was Invented

In a surprise move Greek Prime Minister George Papandreou announced a public referendum on the most recent bailout plan for Greece and a vote of confidence in the Greek Parliament. This may be the only way to save his term as Prime Minister and his nation from self-destructing as the government pushes through harsh austerity measures. Contradicting reports suggest the public referendum could take place in the next few weeks or early next year with the vote of confidence likely within the next week. Market participants have already begun voting with their feet. This could be the end game for the EU as we may see just who will stay and who will go.

Since the start of the week the EUR/USD has fallen $0.05 and European bourses were sent lower by the tune of 5%. Support for the pair is the 61% retracement of the October move at 1.3565. The EUR/GBP is testing its rising trend line from June 2010 which comes in at 0.8560. A break here could have scope to 0.8525 from the September low.

AUD – RBA Cuts Rates and AUD Plunges

In the face of changes to the global macro environment the Reserve Bank of Australia decided to lower its interest rate 25 bp to 4.50%. RBA Governor Glenn Stevens said the central bank now maintains a “neutral stance.” It is interesting to note that outside influences are driving the monetary policy of Australia rather than domestic factors, though Australia has always been particularly dependent on Chinese economic growth to drive its own economy. Yesterday’s drop in China’s Purchasing Manager’s Index to 50.4 in October, dangerously close to the 50 boom/bust level does not bode well for the Australian economy nor the global economy for that matter.

At this time the AUD still represents one of the only developed market currencies with a relatively high interest rate. A reversal of market sentiment could be a catalyst for the AUD. The key level for the AUD/USD is 1.0230 where the 20-day moving average coincides with the 38% retracement of the October move. Below here rests support from 1.0120 from the October 18th low.

Crude Oil – Crude Oil Prices Face Economic Headwinds

Crude oil continues to trade in-line with improvements/declines in risk sentiment and the global economy. Yesterday’s release of Chinese PMI data that is so close to the 50 boom/bust level for the survey is one reminder of the headwinds crude oil prices face. With the major engine of global economic growth signaling a slowdown it will be difficult for crude oil to mount any significant rally.

Spot crude oil retraced 50% of its decline from May to October at $94.75 before pulling back. The congestion area from September at $90.30 is the initial support followed by $84 from the October 20th low.

Technical News

EUR/USD

An impressive run higher over the month of October took the EUR/USD as high as 1.4250, the 61% retracement from the May to October move. However, a failure of the pair to overcome this key technical mark does not bode well for the EUR in the near term. Also worth noting is the failure of the pair to move above its previously broken trend line from the June 2010 and the January 2011 lows. Falling stochastics on the daily and weekly chart also point to declines in the value EUR/USD. Support is located at 1.3915 from the October 17th high followed by 1.3650 off of the October 18th low and the October low at 1.3145. The 61% retracement level will serve as initial resistance with additional selling perhaps at 1.4450 from the trend line off of the May and July highs.

GBP/USD

Cable has failed to climb above both its 200-day moving average and stopped short of its 61% Fibonacci retracement target from the April to October move which at 1.6150 should serve as initial resistance. A move higher could go on to test the 1.6450 resistance off of the August high though daily stochastics have crossed and the weekly stochastics are beginning to roll lower as well. As such, a move lower could find support at 1.5890 from the October 26th low as well as the October 18th low of 1.5630.

USD/JPY

Another round of intervention has lifted the USD/JPY 400 pips for a 5.29% gain. However, the pair’s sharp move higher was unable to break a key falling trend line from the 2007 high which comes in this week at 79.70. With the long term downtrend still intact a move lower may once again test the all-time lows the pair will first encounter support at 77.85 from the September high as well as 77.50 from the mid-October high. Should the intervention continue the Japanese Ministry of Finance may find willing offers waiting at 80.20 which was the peak of the last round of intervention in August.

USD/CHF

The Swiss franc has once again resumed its downtrend versus the USD after moving as low as 0.8550, a level that has previously served as both support and resistance. A bounce from here could find an offer at 0.8900 from the resistance line off of the October peak. Should the downtrend from October extend into November a break of 0.8550 may have scope to 0.8240 from the August high.

The Wild Card

S&P 500

US equities have pulled from their month long appreciation in October. With the first two trading days of the week the S&P 500 has retraced almost 38% of the October move. Forex traders should note the key support levels of 1,185 from the October 18th low and the 61% retracement of the October move at 1,152. Resistance is last week’s high of 1,288 followed by the falling resistance line off of the May and July highs.

Forex Market Analysis provided by ForexYard.

© 2006 by FxYard Ltd

Disclaimer: Trading Foreign Exchange carries a high level of risk and may not be suitable for all investors. There is a possibility that you could sustain a loss of all of your investment and therefore you should not invest money that you cannot afford to lose. You should be aware of all the risks associated with Foreign Exchange trading.

Crude Oil Daily Outlook – 02 November

Crude Oil – Daily outlook 02 November 1, 2011

Since early October we’ve seen the bulls out in force pushing the price of oil higher and higher. Early last week we saw the market closing above the important technical level of 90, with the rest of the week seeing fairly flat and range bound conditions.

Monday saw a completion of a Hikkake pattern with the market falling lower in early trading, later reversing and closing higher. The Hikkake comes at a strong S&R level of 90 further confirming more bullish momentum could be on the horizon.

Below we can see the strength and importance of the 90 level as it has held as strong Support and resistance in the past. The next area we may see the market struggle to push through is 95; however should we see the market breaking and closing above this area it would not be unlikely to see 100 again.


oildailyoutlook02nov


Below we can see the Hikkake pattern in more detail. The Hikkake should be given more attention due to the fact it has formed at an important level in the market. It’s also important to take note of the double inside bars which further strengthen this bullish signal.


oildailyoutlook02novzoom

There are a couple of ways in which we can take this trade. One idea may be to wait for the market to fall placing a buy limit at the 90 area. Another idea may be to wait for the market to push higher and buying when we see a break of the outside bar.

By http://www.vantage-fx.com

All for Gold… But Is There Gold for All?

By MoneyMorning.com.au

I was strolling through the main square of a small French town a few days ago. It was about the same size as Tamworth – around 40,000 people. It was in the middle of nowhere. And would you believe next to the boulangerie was a shop selling gold and silver – and nothing else.

No foreign exchange. No travellers cheques. Just precious metals. So naturally I popped in to see how business was doing.

The shop seller told me the same thing I’ve heard in Australia (and other parts of the world). Bullion dealers can’t keep up with demand. According to her, sellers are buying increasingly large amounts of gold – particularly on the dips. And she can hardly get her hands on any silver to sell.

Remember – this wasn’t in the big smoke of Paris. It was a fairly small town. And I think it just goes to show the growing demand for physical gold and silver is global.

It would certainly back up the Perth Mint’s recent report that demand is…

… currently running at unprecedented levels and we have been inundated by high levels of web and telephone traffic from clients all around the world. This has put tremendous pressure on our business systems and Customer Service department which have struggled to cope with the number of enquiries and orders.

And King World News reported…

…Peter August, CEO of Australian Bullion Company, Melbourne Australia, which is one of the largest and most respected bullion dealers in the country told KWN, “We have never, ever seen these levels of demand for physical gold and silver.

“One of the biggest changes we have found in recent times is that our client base has become much more savvy and they are aggressively buying on the dips….

“As an example, with the recent plunge in the price of silver, we have noticed that the demand for physical silver has exploded. Another complicating factor is the fact that there are virtually no sellers in the silver market.

“We have found the same exact buying pattern is occurring in the gold market. As the price declines, we have been experiencing an unprecedented amount of new orders for physical gold. Demand has been so extraordinary for both gold and silver, that our two main suppliers are in the process of ramping up capacity because they simply can’t handle the current levels of demand.”

But while it’s getting harder to get your hands on physical gold, there is some good news. The chart below shows the HUI gold stocks index divided by the gold price. This chart falls when gold stocks underperform and rises when gold outperforms. And it looks to me as though this chart is finding its feet at last.

Gold stocks to start performing?

Gold stocks to start performing?
Click here to enlarge

Source: stockcharts

Last week we saw gold stocks start to move with the gold price. And while it’s still early days, it looks as though gold stocks might start moving with the gold price.

And that could be very good news if you’re holding onto gold stocks. One of the gold producers I’ve recommended in Diggers & Drillers, for example, already has bigger profit margins than any of its peers. It’s cashed up. Has no debt. And it’s increasing production. (Click here to find out more about that one…) If it starts moving with the gold price – and the demand for physical bullion keeps pushing the gold price up – who knows how high our gold stocks could go?

Dr. Alex Cowie
Editor, Diggers & Drillers

Related Articles

Why it’s Not Too Late to Avoid This Investing Mistake

Three Steps to Wealth: Leverage, Volatility and Risk

Two Decades of Boom and Bust

Great News for Options Traders

How to Turn Pennies into Pounds With Australia’s Most Exciting Companies

From the Archives…

Gain Without Pain
2011-10-28 – Greg Canavan

If a Butterfly Flaps its Wings in Frankston…
2011-10-27 – Kris Sayce

Dr Doom’s Warning for Aussie Investors
2011-10-26 – Kris Sayce

“Ctrl + Alt + Delete”
2011-10-25 – Dan Denning

A Mistake That Could Cost Millions
2011-10-17 – Kris Sayce


All for Gold… But Is There Gold for All?

RBA Interest Rate Cut – Backs Investors into a Corner

By MoneyMorning.com.au

Thanks to the Reserve Bank of Australia’s (RBA) interest rate cut (i.e. the manipulation of the interest rate market) yesterday, savers will earn 0.25% less in interest. It may not sound much. After all, on a $20,000 deposit it’s just $50 per year.

But for someone in retirement who may have cash savings of say, $500,000, it means $1,250 less per year in income… or $104.17 less per month. And if half a million is all you’ve got to see you through the next 30 years of retirement, well, $104 makes a difference.

So, what else could you do with the cash? Buy a “safe” investment property perhaps?

Not likely.

As we recall, rental yields on housing are below 4%… even for a cash buyer. And with little to no prospect of price growth over the next 10 years, only a madman would buy a property for rental income.

But where else can you stick your cash for safe returns?

The stock market perhaps. Well that’s hardly what you’d call a safe investment. In fact, right now the stock market is about as risky as it’s been in three years.

The problem is, if the experience overseas is anything to go by, the RBA has just kick-started its own version of interest rate stimulus…

More Risks for the Same Return

That is, they’ve spied a potential economic problem on the horizon (a problem we’ve pointed out here for a long time – a slowing Chinese economy) and decided the economy needs a boost to try and avoid the problem.

That means lower interest rates.

And it means forcing savers and investors to take bigger risks to get the same return. Exactly what the folks at major trading firm MF Global were trying to do. They’ve now gone into Chapter 11 bankruptcy protection.

You see, whether you’re a regular 9-to-5 worker or a hot-shot Wall Street trader, your goal is the same, to earn a living. In most cases you try to earn as much as you can with as little effort (and risk) as possible.

But when obstacles are put in your way, sometimes you have to work a little harder just to get the same return. For a 9-to-5 worker it may mean doing a bit of over time in order to cover the increased cost of fuel… or higher school fees.

However, even though you’re earning more, the net result is the same because your costs are higher. In other words, you do more work to achieve the same result.

But for a hot-shot Wall Street trader, when interest rates are close to zero they’ve got to find new ways to make money. And for traders that usually means making bigger bets and taking bigger risks.

More of the Same Old, Same Old

The fact Wall Street trading giant, Goldman Sachs last month reported a third-quarter trading loss of USD$393 million should have been a warning sign.

If even these guys can’t make a buck, what are the odds on lesser trading firms making a buck? So when MF Global went belly-up this week after making a “$6.3bn bet on European sovereign debt” it wasn’t because the firm was riddled with so-called rogue traders…

It was because the firm had to make bigger bets and take bigger risks just so it and its traders could make the same money they used to make from smaller bets and smaller risks.

The big trading firms are no different to the average worker in that respect. It’s just that when a big trading firm makes a bad bet the damage has much bigger consequences.

Ultimately, the fault isn’t with Goldman Sachs or MF Global. Rather it’s with those that lay the groundwork for these big bets – the central banks that manipulate interest rates lower and the governments that aid and abet them.

But as usual, they’ll get off scot free. In fact, our bet is there will be a call for more regulations and supervision to protect investors from the likes of MF Global. And who will be given the honour of regulating and protecting?

That’s right. Agencies appointed and monitored by central bankers and governments.

How’s that gonna work out? We’ll tell you…

Get ready for more of the “same old, same old.”

Cheers.
Kris.


RBA Interest Rate Cut – Backs Investors into a Corner

Why You Should Cuddle a Wall Street Trader

By MoneyMorning.com.au

Yes. We know it sounds crazy. But in a moment we’ll explain why the hot-shot traders on Wall Street, Collins Street and Martin Place aren’t the enemy.

In most cases they’re just like you and us… they’re trying to earn a crust (whether it’s an honest crust is an argument for another day).

We’ll explain all shortly. But as another week starts, what do we see but… another stuff-up.

The market goes back to doing what it has done for the past three years.

Just when the market had gotten all excited about the Greek bailout… whammo! The whole applecart gets upended.

As we drove off early last Friday morning for a few relaxing days with the family, we left thinking not much could happen.

As with our family holiday to Queensland a few weeks back we had no Internet access and didn’t watch the TV news.

So imagine our surprise when we came back to see that major trading firm, MF Global had gone into Chapter 11 bankruptcy protection… and Greece had decided to hold a referendum on the Euro bailout package.

The phrase, “same old, same old” sprang to mind.

Backing Investors into a Corner

Knowing that something – anything – could be around the corner is what has us most on edge about investing in this market. Because think about it. Despite hours and days of meetings and resolutions… and hundreds or thousands of words printed in summit communiqués, what’s changed?

Over-leveraged trading firms are going bust… and governments are showing their true colours – they’re incapable of doing anything sensible.

Until that changes, we see no reason to recommend overexposing your portfolio to the stock market. Or any market for that matter.

Trouble is, for investors who are trying to make an honest buck, the options for low-risk investing are disappearing fast.

Because whilst things like the RBA interest rate cut might help some, it will certainly harm others.


Why You Should Cuddle a Wall Street Trader

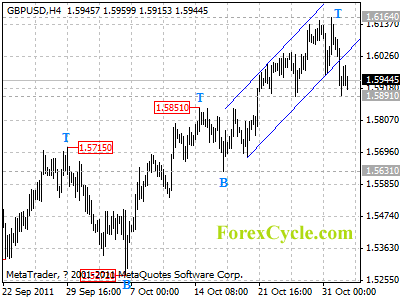
GBPUSD is facing 1.5891 support

GBPUSD is facing 1.5891 support, as long as this level holds, the fall from 1.6164 is treated as consolidation of uptrend from 1.5272, and another rise to 1.6250-1.6300 area is still possible. However, a breakdown below 1.5891 will indicate that a cycle top has been formed at 1.6164 on 4-hour chart, then lengthier consolidation of uptrend could be seen, and the trading range would be between 1.5800 and 1.6164.

gbpusd

Forex Signals