How to Play America’s Fourth Biggest Oil Producing State

How to Play America’s Fourth Biggest Oil Producing State

by David Fessler, Investment U Senior Analyst
Monday, November 7, 2011

When the Barnett Sale gas play in Texas was first drilled, drilling started out slow, but then ramped up rapidly once the size and scope of the play was fully understood. The same thing is happening in the Bakken formation.

The Bakken is an oil- and natural gas-rich formation covering a 200,000 square mile area encompassing parts of Montana, North Dakota and Saskatchewan. According to an April 2008 survey by the USGS, it’s estimated to contain as much as 4.3 billion barrels of recoverable reserves.

While initial drilling activity was slow and drill rigs were sparse, it eventually picked up. Rapid growth ensued starting in 2006, and continues to the present day.

The reason production saw such a rapid rise was the introduction of horizontal drilling and fracking, similar to what’s fueled the meteoric rise of other oil and natural gas shale plays.

Take a look at the first graphic below, courtesy of the EIA. The larger the circle diameter, the bigger the well flow. Green circles represent wells where the majority of the output is oil, yellow is a mix, and red is mostly gas.

In 2005, nearly all of the oil drilling was taking place in Montana, on the western side of the play, while most of the gas wells were being drilled in the southern part of the Bakken known as Billings Nose.

Bakken Shale Production 2005

Now take a look at a snapshot of Bakken drilling activity as it existed at the end of 2010. What a difference a few years makes.

Bakken Shale Production 2010

The Parshall Field was discovered in 2006. It’s located in the eastern-most part of the Bakken. It initiated a huge shift towards drilling in the oil-rich part of the Bakken field. As a result, the eastern side of the play is where a lot of the action is.

Oil production began to skyrocket starting in 2003, and hasn’t looked back. It now far overshadows the natural gas production from the Bakken.

It’s all turned North Dakota into America’s fourth largest oil producer. Only Texas, California and Alaska produce more. It’s most been due to the gains in the Bakken.

Based on data from North Dakota’s Department of Mineral Resources, total production for the state averaged 445,000 barrels of oil per day (bopd) in August 2011. That’s a 29 percent increase in just eight months time.

Even more impressive, back in 2000, Bakken production averaged just 2,000 bopd. At the end of 2010, it was more than 260,000 bopd. Over 90 percent of Bakken production is from horizontal wells, and that percentage will only increase as more are drilled.

Who Are the Big Bakken Players?

One of the biggest oil drillers and producers in the Bakken is Continental Resources, Inc. (NYSE: CLR). Seventy percent of Continental’s reserves are located in the Bakken.

Brigham Exploration Company (Nasdaq: BEXP) is another large Bakken driller. It recently announced it’s being acquired by Statoil ASA (NYSE: STO), the Norwegian oil and gas giant.

A number of shareholder lawsuits have sprung up subsequent to the announcement, contending that the $36.50 a share offer price is far too low. It’s a great example of how desperate other companies outside the United States are to find additional sources of oil.

Another, smaller but no less active producer is Whiting Petroleum Corporation (NYSE: WLL). Whiting is active in the Sanish Field in the northern part of the Bakken play. It also has active exploration activities underway in the Collingswood Shale formation in northern Michigan, and in the Permian Basin in western Texas.

Investors wanting to participate in the continued growth of the Bakken might want to consider shares of either Continental or Whiting. Both will be drilling on their Bakken acreage for years to come. As oil prices continue to rise, oil companies share prices will rise right along with them.

Good investing,

David Fessler

Article by Investment U

What To Do With Your Money Today

What To Do With Your Money Today

by Alexander Green, Investment U Chief Investment Strategist
Monday, November 7, 2011: Issue #1637

When I speak at financial seminars and conferences around the country, I feel a tension – a palpable fear – that didn’t exist in the past.

Investors aren’t just nervous or uncertain. They’re scared. And who can blame them? The economy is sputtering. The greenback is in the tank. The Eurozone threatens to come apart at the seams. And the stock market is gyrating wildly.

In response to all this, some stock market pundits are pounding the table, insisting that this is an historic buying opportunity. Others, however, are infected with anxiety themselves. And a few are actively fear mongering.

Who should you believe, the raging bulls or the rampaging bears?

The answer is neither. As historian David McCullough often reminds his audiences, there’s no such thing as the foreseeable future. None of these gurus has a crystal ball.

And that’s okay. Because investment success is not about following the right predictions. It’s about following the right principles.

Fortunately, the principles of successful investing are well understood. Why don’t most people follow them? One reason is ignorance.

There’s no shame in this. It’s a big, complicated world out there and we’re all ignorant of different things.

However, it’s unfortunate that most kids graduate from high school without a modicum of financial literacy. It’s tough to get a quick start in this world if you don’t understand compound interest, 401(k)s, adjustable-rate mortgages, or why we have a stock market.

So what are the great principles of investing? It’s tough to cover them all in a short column like this. (Although I cover the bases in my first book, The Gone Fishin’ Portfolio.)

But here are the nuts and bolts everyone should know:

For starters, few people get rich by founding a computer company in their garage, recording a platinum record, or playing third base for the Yankees. Most people with a net worth of a million dollars or more do it the old fashioned way. They maximize their income, minimize their outgo, and religiously save and invest the difference.

As my friend Rick Rule likes to say, when your outgo exceeds your income, your upkeep becomes your downfall.

Ok, let’s assume you’ve done what many people are either unable or too undisciplined to do: You’ve saved some money. Now what?

The next step is to understand that there are six factors that will determine what your investment portfolio is worth in the future:

  • The amount of money you save.
  • The length of time you let it compound. (Hands off.)
  • Your asset allocation. (This refers to how you diversify your portfolio among uncorrelated investments like stocks, bonds, cash and precious metals.)
  • Your security selection. (i.e. the individual investments you own.)
  • The amount you pay in commissions, fees and other expenses.
  • And the amount you fork over in taxes.

Note that there’s nothing here about forecasting the economy, timing the stock market, or figuring out how the European debt crisis will end.

You cannot know the answer to those questions. And that’s okay, too, because they will have little bearing on what your investment portfolio is worth five, 10, or 15 years from now.

If you’re investing to reach long-term financial goals, think long-term and forget about the day-to-day trivia that dominates the headlines and pays the salaries of so-called experts.

Focus instead on following proven investment principles. In other words:

  • Save as much as you can.
  • Start as soon as you can.
  • Leave it alone as long as you can.
  • Diversify among high-quality securities.
  • Minimize your investment costs.
  • And tax-manage your portfolio.

I’ll be talking in more detail about each of these investment principles in the weeks ahead.

In the meantime, heed the advice of Thomas Jefferson:

“In matters of style, swim with current; in matters of principle, stand like a rock.”

Good investing,

Alexander Green

Article by Investment U

Individualism Versus Collectivism

By MoneyMorning.com.au

“What I am referring to is the rise of what might be termed individualism over collectivism. This is the idea that our world view has shifted from the need to play a minor part in a bigger society to the view society, and pretty much everything else, should revolve around us.”

In an op-ed for the Australian newspaper two months ago, Bernard Salt, a partner at KPMG – an auditing, taxation and financial advisory firm – argued that people have become self-centred. That people worry more about themselves than they do about the wider society.


He backs his view saying:

“If you are not claiming every thing you are entitled to, and more, then you are seen as a bit of a loser. And I suspect this is because today we believe we are entitled to a standard of living that is more or less disconnected to any notion of how hard we work.”

That paragraph proves Mr. Salt doesn’t understand individualism. In fact, we’ll explain how individualism is the most important ingredient for economic prosperity and progress.

But first, back to Mr. Salt…

Individualists Don’t Sponge Off the State


The mentality he rails against is actually the mentality of collectivism, and not individualism.

People who are individually minded, those who rightly act in their own interests, have no desire to sponge off the state. Simply because they prefer to keep what they earn and would like others to keep what they earn.

Collectivism is where you get the entitlement mentality.

You know the saying, “What’s mine is mine and what’s yours is mine”!

In a collective economy… an idea always needs approval from an “Ideas Tsar”… a central planner who decides on behalf of the market which ideas live and die.

Now, that’s not to say collectivist societies can’t develop new ideas. The difference is, the State decides which ideas will be successful, not the market.

The 1960s “Space Race” is a good example. How was the Soviet Union able to put the first man in space when it was a communist nation? And why was the capitalist United States second?

For the answer you just need to consider the cost of the “Space Race”. Sure, the Soviets got there first… but look at the cost… millions of people living in abject poverty… an economy that could barely produce a workable car… queues for even basic food items… no medicines – except drugs for athletes… and so on.

By contrast, the individualistic United States had plenty… 40 car firms of various sizes (by the way, 680 auto firms came and went between 1900 and 1930. That’s creative destruction for you!)… little poverty… supermarkets crammed with food… the best healthcare system in the world… and so on.

The difference was entrepreneurs could flourish. The government didn’t dictate what companies could produce.

But in order to be the first nation into space, the Soviets had to devote all their resources to it, and subject their citizens to decades of poverty, violence and oppression.

In contrast, the Americans got a man into space by only devoting a fraction of its resources.

Free Markets, Not Governments Fund Essential Services


In short, individualism and free markets provide society with the things governments take the credit for – health, education, public buildings, etc. If it wasn’t for the actions of the market, like the Soviet Union, none of these services would be possible.

But it all relies on an economic environment that allows creative destruction. Where new ideas can spontaneously break through to succeed or fail.

Cheers.
Kris.


Individualism Versus Collectivism

Entrepreneurs and Entrepreneurialism

By MoneyMorning.com.au

Wanted: Obsessed and Passionate Investors

Entrepreneurialism can only thrive in an individualistic society. Successful entrepreneurs create products, services or processes they believe will be beneficial to society. But they don’t do it out of charity.

They do it because of the flipside of helping society… the belief they’ll make a bucket load of cash from their idea.

Fortunately, even though the Australian economy has become more collectivist, it hasn’t gone completely down the Soviet road of 100% central planning. So there is hope.

But because the government is so involved in the economy (remember, total government spending accounts for around 35-40% of the Australian economy) it’s hard for entrepreneurial companies to make it to the big time.

And when they do hit the big time the rewards are huge. It’s like a pressure cooker effect… government rules and regulations keep entrepreneurs pinned down… but eventually, so much pressure builds up, a crack appears and a handful of ideas squeeze out.

Those are the entrepreneurs, ideas, and stocks I look for.

But entrepreneurialism isn’t just about inventing new gadgets. Entrepreneurialism is just as strong in places like the resources sector. It could be a tiny mining company looking for a resource in an unusual place.

Or a seemingly ordinary natural gas company developing a way of liquefying gas at half the cost of other gas companies (such as LNG Ltd [ASX: LNG], the stock I tipped in November 2008 and sold for a 242% profit one year later).

Our July stock tip is a good example of entrepreneurialism in the resources industry. It’s searching for and hoping to produce oil in an unusual location. And our latest stock tip is taking advantage of high prices to exploit a valuable resource.

Entrepreneurs


But not every stock I look at is entrepreneurial. Most are. Because that’s where you get the real excitement from investing in the stock market… taking a punt on small companies with a clever idea.

That means finding some of the most creative, destructive and selfish people on the market. Those who aim to improve businesses and the lives of consumers… while at the same time earning a bundle of cash for themselves and their investors.

On this subject I’ll leave the last words to Brad Feld. Mr. Feld is the co-founder of TechStars, an entrepreneur-based reality TV show on Bloomberg TV.

Here’s what he says about the qualities you need to look for in an entrepreneur:

“Really you’re looking for amazing and credible people that are gonna be obsessed and passionate about whatever they’re going after.”

Cheers.
Kris.

P.S. Finding Aussie companies with potentially ground-breaking ideas is what I do on a daily basis. The long days of research go towards producing a monthly investment newsletter called, Australian Small-Cap Investigator. That’s where I introduce subscribers to some of the amazing companies trading on the Australian market. Companies that – if they get things right – could give investors triple-digit percentage gains. It’s a high risk investing approach, but it’s also interesting and a lot of fun! Click the following link if you’d like to find out more about my small-cap newsletter.


Entrepreneurs and Entrepreneurialism

Crude Oil Weekly outlook – 07 – 11 November – Heading for a Hundred?

Crude oil – Weekly outlook 07 November – 11 November 7, 2011

Our analysis of last weeks Hikkake pattern came off to the upside as expected; however we were unable to see the market closing above its next resistance level at 95. Friday saw a high of 94.90 before slightly retracing and closing the day with a bullish pin bar. The next significant area we may see the market reach is 100. With last weeks Hikkake and Friday’s pin bar the market could reach this area in the coming days/weeks.


oilweeklyoutlook07nov

Below we can see the Hikkake pattern mentioned in last week’s analysis. The Hikkake was strengthened as it was formed at a significant area in the market rejecting the 90 level

oilweeklyoutlook07novzoom

Should we see a break and close above 95 we could see the bull’s pushing the market back up to the 100 area. We would have liked to have seen last Friday’s pin bar closing above 95 to further confirm our bullish outlook. However price action at this time is still favoring the bulls.

 Article by vantage-fx.com


Political Rumors Fly and EUR Bounces from Daily Low

Source: ForexYard

printprofile

Price movements in the EUR continue to be influenced by both politics and rumors flying over the newswires. The EUR bounced off of its lows this morning after it was reported that Italian Prime Minister Silvio Berlusconi could resign today.

In Italy Reuters is reporting Berlusconi may resign as early as today. Markets moved higher as an exit by Berlusconi would improve sentient as the state of Italian politics is holding back any meaningful austerity measures to tackle the debt burden. Financial markets kept the pressure on Italy today with Italian 10-year BTP bonds rising to 6.66%. A level above 6% is considered unstable by many fixed income analysts.

According to reports from the WSJ Greece is favoring replacing Greek Prime Minister George Papandreau with former ECB Vice President Lucas Papademos. A national unity government was agreed to for the implementation of the EU/IMF bailout package. Details remain sketchy and the political situation continues to weigh on equity markets as the London FTSE 100 is down 0.60%.

Speculators reduced their overall bearish EUR bets by 25% according to the most recent COT report. Traders continues to favor short EUR positions though the market positioning appears to be more balanced which could allow for additional declines in the EUR/USD.

The EUR/USD made a low this morning at 1.3680 before bouncing higher on rumors of Berlusconi’s resignation. Today’s low failed to move below the rising support line from the November 1st low on the hourly chart. A clean break below here will likely test the 1.3600 level. Initial resistance is found at 1.3830.

By the way, after completing this forex blog post Berlusconi denied the rumors of his resignation via his facebook page.

EURIMM

Read more forex trading news on our forex blog.

Forex Market Analysis provided by ForexYard.

© 2006 by FxYard Ltd

Disclaimer: Trading Foreign Exchange carries a high level of risk and may not be suitable for all investors. There is a possibility that you could sustain a loss of all of your investment and therefore you should not invest money that you cannot afford to lose. You should be aware of all the risks associated with Foreign Exchange trading.

Smart Investors Are Switching to Plastic

By The Sizemore Letter

If consumer sentiment soured last quarter, it appears that MasterCard (NYSE:MA) cardholders were curiously immune. Earlier this week, the company announced third-quarter revenues were up 27%, and the dollar volume of purchases made using MasterCard-branded credit and debit cards rose 18%. Earnings per share were up an almost mind-blowing 43%. Not bad, given that we might technically be in a recession.

MasterCard’s results followed stellar (if slightly more modest) results from rival Visa (NYSE:V). For the quarter ended Sept. 30, Visa earnings per share were up 20%. Most companies would kill for 20% EPS growth; only when compared to MasterCard does it look a little shabby.

American Express (NYSE:AXP), MasterCard and Visa’s smaller rival that caters primarily to business customers, reported earnings last month. Earnings per share were up 14% for the quarter. Again, not bad given the condition of the economy.

Figure 1: MasterCard, Visa, and American Express


Not surprisingly, all three card stocks have enjoyed a healthy rally this year. MasterCard is the clear winner, up nearly 70% year-to-date, but Visa too has had a nice run. Both of these stocks had been held back by uncertainty surrounding the implementation of the Dodd-Frank Durbin Amendment’s restrictions on debit card swipe fees. (American Express was unaffected, as the company issues only credit cards and not debit cards.)

In lumping American Express with MasterCard and Visa, we’re not quite comparing apples to apples. AmEx actually makes loans and accepts credit risk. MasterCard and Visa do not; they simply allow banks to issue credit cards branded with their logos, and the issuing banks accept the credit risk. MasterCard and Visa also get a significant amount of their revenues from debit cards; American Express does not.

So, while I consider America Express “safe” in that its clientele tend to be high-quality borrowers, without a debit card business I consider the company’s growth to be limited. Thus, we’ll focus only on MasterCard and Visa.

Some of the rocket-like outperformance of these stocks this year was thanks to the Durbin uncertainty being lifted (note the vertical spike in both MasterCard and Visa in late June after the Fed’s favorable ruling), but there also are two powerful tailwinds supporting these companies:

  • The macro move towards a global cashless society.
  • The rise of the emerging-market consumer.

Yes, I realize the world will never truly go “cashless.” Many shoppers appreciate the anonymity of paying with cash, and cash in some physical form probably always will be with us. Still, the percentage of transactions settled with “plastic” or through other electronic means grows every year, and the continued growth of internet commerce will only speed this along.

By some estimate, as much as 40% of transactions in the United States still take place with cash or paper checks, and the percentage is significantly higher in most emerging markets. Suffice it to say, MasterCard and Visa will have healthy demand for their credit and debit cards for the foreseeable future, regardless of what happens to the economy. If retail sales were to experience zero growth in the years ahead, MasterCard and Visa would be able to enjoy at least modest gains purely from consumers switching to plastic from cash or checks.

MasterCard and Visa also are well positioned to profit from the rise of the new emerging-market middle class. Visa gets close to half of its revenues from outside the United States, and MasterCard gets more than half. Much of this is from the fast-growing economies of Asia, Latin America and the Middle East. Expect to see these percentages rise in the years ahead. While the U.S. and Europe remain mired in a cycle of debt deflation, emerging markets continue to grow, and millions of people formerly trapped in poverty join the ranks of middle class consumers every year.

Neither MasterCard nor Visa are “cheap” in strict value-investor terms; the companies trade at 17 and 16 times their respective 2012 earnings estimates. Still, this slight premium is worth paying for two high-quality, high-growth companies supported by long-term trends.

If you liked this article by Sizemore Insights, you’d probably enjoy The Sizemore Investment Letter, our premium members-only newsletter. Click here for more information.

This article first appeared on InvestorPlace.

Lighting a Match to Inflation

By MoneyMorning.com.au

“The Frankfurter Allgemeine Sonntagzeitung (FAS) reported that Bundesbank reserves – including foreign currency and gold – would be used to increase Germany’s contribution to the crisis fund, the European Financial Stability Facility (EFSF) by more than 15 billion euros ($20 billion).” – Reuters

On the subject of gold, this time next week the Gold Symposium will have just kicked off.

If you haven’t booked your seat yet, and you can make it to Sydney’s Luna Park for the two-day event, click here for more details.

Your editor is chairing day two of the event. This includes a panel discussion, titled, The Great Currency Debate. Panellists are Eric Sprott, John Embry, Ben Davies and Egon von Greyerz.

You can read the panellists’ biographies and details here.

Back to the report from Frankfurter Allgemeine Sonntagzeitung

‘Hans’ Off

So, the rest of Europe is trying to get their mitts on Germany’s gold eh?

Not so fast. A German government spokesman told Reuters, “Germany’s gold and foreign exchange reserves, which the Bundesbank administers, were not at any point up for discussion at the G20 summit in Cannes.”

If you know anything about how these summits work, the snivelling bureaucrats meet in advance and discuss the subjects to go on the agenda. This is where the bankrupt states say, “So, all that gold you’ve got [sniff], erm, we’ll look after it for you if you like!”

This would have meant transferring gold from the Bundesbank (Germany’s central bank) to the EFSF (Europe’s new bailout fund).

Not a chance, was Germany’s response.

But it’s a tiny and yet important development. Western governments and central banks are getting serious about gold again… and they want to get their hands on it. Why? Because they know gold is money.

And because they know their money printing will devalue any paper assets held by the central banks. So what better way to insure themselves against paper asset devaluation than snaffling some German gold?

Of course, seeing as the European Central Bank (ECB) has full control of the European printing presses, it won’t be too disappointed. If inflation picks up and paper assets are devalued, guess what, it can just print more.

That has plenty – including the Germans – worried…

A Credible Threat?

We’re sure you’ve seen many commentators compare the hyperinflation of 1920s Germany, 18th Century France and even the Roman Empire to the current money-printing frenzy in the U.S. and Europe.

Heck, we’ve made comparison once or twice in these pages.

But it’s an easy comparison. So one of the questions we’ll have for the gold experts at next week’s Gold Symposium is this: “Is hyper-inflation a credible threat?”

Australian Wealth Gameplan editor, Dan Denning pointed out an article posted on contraryinvesting.com. The author (Brett) had been to a presentation by Hugh Hendry, a London-based contrarian hedge fund manager.

According to Brett:

“The widespread belief among the greatest financial minds today that hyperinflation is inevitable greatly disturbs him [Hendry].

“In the Western world, he sees hyperinflation as a political choice – one that requires the will of the populous. (Forget Zimbabwe, he says – that might as well be Timbuktu. It’s not our culture.)”

Remember, this is a second-hand retelling of Hendry’s presentation.

Apparently, Hendry only sees hyperinflation if the world’s major economies descend into a deflationary depression.

The rationale is, with deflation, prices and wages generally fall. Existing money increases its purchasing power. But debts become more expensive to service – because debt levels increase relative to falling wages.

With so much debt held by governments, banks and individuals, the incentive to print money would be irresistible. As governments are sure to do all they can to prevent banks from going bust.

Don’t forget, governments have form when it comes to bank bailouts. Can we really expect that to change?

To us, Hendry’s argument seems fair. But what about the counter argument…

Lighting a Match to an Oily Rag

Well, the argument for hyperinflation without depression and deflation is equally fair – that is, governments and central banks will do all they can to try and prevent deflation and depression.

A pre-emptive attack, if you like.

As we see it, the result would be the same.

In some ways the hyperinflation argument is a bit like arguing whether a rag dipped in petrol is more flammable than a rag that has petrol poured over it… light a match to either and see if you get the same result.

For the past three years governments and bankers have done their darnedest to try and prevent another recession – and avoid a depression. Has it worked? Only as far as it has delayed either or both.

Whether it has actually produced an economic benefit is another thing – we don’t believe it has.

But what do we know? We just write about this stuff and try to offer you a few ideas and tips on how to protect yourself when (not if) the worst happens.

Yet as we prepare for the Gold Symposium, more questions spring to mind than we know the answer to. Hopefully we’ll get an answer next Tuesday. Including the question we’ll have for you in tomorrow’s Money Morning

Cheers.
Kris.

Related Articles

Totally Standard Hyper-Inflation

Is There Any Upside for Gold Investors?

The Gold Bubble and China

What a 2,300 Year-Old Coin Reveals About Gold

Gold Investing Far From a Bubble

From the Archives…

Your Retirement Savings – The Day the Government Began to Raid Them
2011-11-04 – Kris Sayce

Fed Up With Inflation…
2011-11-03 – Kris Sayce

All for Gold… But is There Gold For All?
2011-11-02 – Dr. Alex Cowie

Why Australia Needs More Losers
2011-11-01 – Kris Sayce

Qantas – A Grounded Investment?
2011-10-31 – Dan Denning

For editorial enquiries and feedback, email [email protected]


Lighting a Match to Inflation

How to Trade This Headline Driven Stock Market

 By Chris Vermeulen & JW Jones

With all eyes on the unemployment report and Europe, the CME Group’s PR Department nearly created an all out panic with their announcement after the market close on Friday relating to futures maintenance margin. The original statement was vague and I was quite concerned until I checked out the CME Group’s web-page and the PR Department sent an update clarifying their position. At this point I think the crisis has been averted, but this is just another reminder that we live in “interesting times.”

Keep in mind that if the CME starts raising margin rates across the board for futures contracts in order to protect themselves stocks and commodities could collapse. Silver recently has is margin rates increased and silver since then dropped 25% in value. So imagine if they raised the rates for more commodities…

The current price action in the marketplace pales in comparison to the world’s geopolitical tensions and deteriorating social mood. In my trading career, I have never seen the price action in the indices react so violently to intraday headlines and rumors. Risk is high and the types of traders profiting from this market are day traders and very short term traders with trades lasting  just a couple hours to 24 hours in length. Aggressive trading which small position sizes is all that can be done right now. This is not meant to be investment advice, but more as a function of the market environment in which we find ourselves currently trading within.

Right now it is hard to say where price action in the broader indices heads in the short-run.  One headline out of Greece or Italy could dramatically alter economic history. In the intermediate term I remain neutral to bearish for a number of reasons. One indicator I follow is the bullish percent index on the S&P 500 which at this point is arguing for lower prices.

The chart below illustrates the S&P 500 Bullish Percent Index:

How to trade S&P 500 Headline Driven Market

As can be seen above, the S&P 500 Bullish Percent Index is presently at an overbought status. When looking at the relative strength and full stochastics indicators one would argue that a pullback is warranted. Historically when the S&P 500 Bullish Percent Index is this overbought, a pullback ensues which ultimately sees the S&P 500 Index selloff. The more arduous task is trying to determine just how deep the pullback on the S&P 500 Index might be.

It is critical to point out that while I do believe a pullback is likely, I will not rule out a rally into the holiday season. Much of the near-term price action is going to be dictated by headlines coming out of Greece and the rest of Europe. In addition to Greece, Italy is also starting to see increased concern regarding an unsustainable fiscal condition. Depending on how the European Union handles the varying degrees of risk in the near term, we could see price action react violently in either direction.

With the market capable of moving in either direction, I wanted to point out some key price levels which should act as clues regarding potential future price action in the S&P 500. The two key support levels to monitor on the S&P 500 Index are the 1,240 and 1,220 price levels.

The daily chart of the S&P 500 Index below illustrates the price levels:

How to Trade Large Cap Stocks

For bullish traders and investors the key price level to monitor is the recent highs on the S&P 500 around the 1,290 area. The weekly chart below demonstrates why this price level is critical and which overhead levels will offer additional resistance should the recent highs be taken out to the upside.

SP500 Weekly Chart Analysis:

How to Trade Weekly Charts

While I am neutral in the intermediate to longer term presently, in the short run I have to lean slightly bearish simply because of the future headline risk and also because a major head and shoulders pattern has been carved out on the hourly chart of the S&P 500 Index. This type of chart pattern is synonymous with bearish price action.


The hourly chart of the S&P 500 Index is shown below:

How to Trade Hourly Chart

Right now I remain slightly bearish, but should the head and shoulders pattern fail and/or we begin to see multiple positive reactions to news coming out of Europe a strong rally into the holiday season is likely. Unfortunately all we can do is monitor the key price levels and wait patiently for Mr. Market to tip his hand.

Until we see a breakout in either direction, we could see price action inhabit the 1,220 – 1,290 price range for several weeks before we get any more clarity of future direction. Until I see a breakout, I will remain relatively neutral with a slight short term bias to the downside based on price patterns in the shorter term time frames. This is a tough market to trade in, and I don’t want to get chopped around or do any heavy lifting. I’m going to focus my attention on high probability, low risk trade setups until directional biased trades make more sense.

In closing, I will leave you with the thoughtful muse of the late Texas Congresswoman Barbara Jordan,

For all of its uncertainty, we cannot flee the future.

Market Analysis and Thoughts By:

Chris Vermeulen – ETF Trading Videos & Trade Alerts

JW Jones – Options Trading Signals & Videos

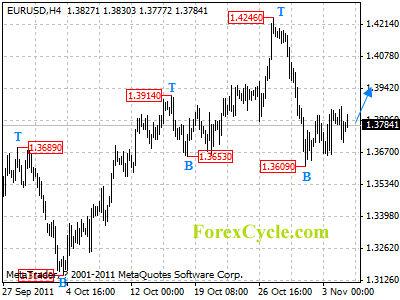
EURUSD had formed a cycle bottom at 1.3609

EURUSD had formed a cycle bottom at 1.3609 on 4-hour chart. Further rally is still possible in a couple of days, and target would be at 1.3950-1.4000 area. However, the rise is treated as consolidation of downtrend from 1.4246, another fall towards 1.3400 could be seen after consolidation, and a breakdown below 1.3609 could signal resumption of downtrend.

eurusd