GBP Trading

Source: ForexYard

printprofile

Many of you traders often think to yourselves what’s the best way to trade the GBP? It’s true; GBP trading can be tricky at times. However, after reading this article you will feel much more comfortable trading the GBP. Since the start of the recession, the British economy and the Pound have been badly hit. Despite a mini recovery lately, the cable has shown a lot of weakness in the past week.

In early trading today, the GBP is trading higher against a number of its main currency pairs. The EUR/GBP pair is down slightly by 20 pips at 0.8597. The Pound is currently up by 70 pips vs. the U.S. Dollar at 1.6570. Against the Swiss currency, the Pound is showing resilience at the 1.7800 level. These gains are remarkable, as we are only 3 hours into today’s trading.

The bullish GBP this morning may be owed to optimism coming from Germany, in which Prelim GDP figures showed that Europe’s largest economy officially climbed out of recession in the 2nd quarter. It’s important to note that as the world’s leading economies recover from the economic recession, the British Pound climbs with this optimism. Therefore, in the coming months, the GBP may be in a significantly stronger situation, as more positive economic data is published from the leading economies.

Today, there is much data expected from the U.S., led by Retail Sales at 12:30 GMT. This will directly affect the GBP’s strength. Therefore, it’s highly important that you forex traders open your GBP position now, as the trading day gets under way. If you don’t already have an account with ForexYard, I advise you to open one now, if you want to start making big money in the coming hours. For more information about the GBP, you can visit the GBP CAMPAIGN section on our blog.

Forex Market Analysis provided by ForexYard.

© 2006 by FxYard Ltd

Disclaimer: Trading Foreign Exchange carries a high level of risk and may not be suitable for all investors. There is a possibility that you could sustain a loss of all of your investment and therefore you should not invest money that you cannot afford to lose. You should be aware of all the risks associated with Foreign Exchange trading.

German Prelim GDP – 1st Quarter

Source: ForexYard

printprofile

On this coming Friday the German Preliminary GDP figures are scheduled to be published at 6:00 GMT. The data release is a measure of the alteration in the value of services and goods that are produced by the German economy in each quarter. In most cases an equal or better than forecasted result produces a bullish EUR vs. its major currency pairs. This data release is one of the most important and extensive primary measures of Germany’s economic activity and health. It is also a prelude to the Final GDP figures that are set to be released 10 days from Friday.

Most analysts forecast that the Preliminary GDP figures of the 1st quarter will be about -3% from the 4th quarter of 2008. This is significantly direr than the previous figures of -2.1%. This so as the German economy continues to deteriorate as analysts fear unemployment to spiral to 5 million in the near future. As of now, the EUR/USD rate is relatively unchanged today at 1.3568, despite rising to over 1.3700 in yesterday’s trading on Wednesday. The EUR/GBP rate is relatively unchanged too at 0.8970 as traders wait till Friday.

If the GDP figures are the same or are worse than the forecasted -3% figure than this could lead to a bearish EUR going into end of week trading. Therefore, the EUR/USD rate could go below 1.3400, whilst the EUR/GBP cross could fall below 0.8850. However, if the results are less severe than analysts fear, then there could be a very bullish EUR going into next week’s trading. Therefore, the EUR could jump about 150 pips against the USD, GBP, and JPY respectively. In the meantime, traders are advised to pay close attention to news events coming out of Britain and the U.S., such as U.S. Unemployment Claims today at 12.30 GMT.

Forex Market Analysis provided by ForexYard.

© 2006 by FxYard Ltd

Disclaimer: Trading Foreign Exchange carries a high level of risk and may not be suitable for all investors. There is a possibility that you could sustain a loss of all of your investment and therefore you should not invest money that you cannot afford to lose. You should be aware of all the risks associated with Foreign Exchange trading.

Deflation Returns to Switzerland

By ForexYard

Swiss CPI data from October showed a larger than expected decline in prices. As such, traders have tried to get out ahead of the next possible move by the SNB to weaken the CHF.

Economic News

USD – US Data Decoupling from Euro Zone

US economic data is seen as improving while recent data in Europe presents a bleak picture of an economy that is heading for a recession. Beginning with a respectable Q3 GDP result of 2.5% growth and a respectable NFP report showing an additional 80K jobs were added. Europe on the other hand reported weak PMIs last week while yesterday’s release of German industrial production contracted -2.7% on consensus forecasts of -0.7%. Last week the ECB cut rates by 25 bp as Draghi foresees the euro zone entering a “mild recession”.

One factor weighing over the head of the FX markets is the potential for another round of quantitative easing from the Fed. Today two Fed speakers will likely present an argument against QE3. Both FOMC members Charles Plosser and Narayana Kocherlakota are known hawks who do not share the ultra-loose monetary policy of Fed Chairman Bernanke. The risk is for USD weakness following their speeches today, though movements in the major FX pairs will likely be driven by events in Europe.

EUR – EUR Faces Headline Risk

The rumor mill continues and this makes the EUR vulnerable to headline risk. Such was the case with Italy’s Prime Minister Berlusconi pending resignation and then denial via Facebook. The Italian 10-year BTP yield moved to an EMU high of 6.67%, a level that signals continued pressure in the Italian debt markets.

The ECB was busy buying bonds last week to contain the fallout from Italy. The SMP purchased EUR 9.52 bn worth of European bonds compared to the previous week’s EUR 4 bn. This is a troubling sign given the continued pressure on Italian debt yields.

A short term bearish technical indicator appeared on Friday with the crossing of the 5-day moving average below the 20-day moving average. Many times this indicator shows the direction of the short term trend. Support is located at the November 1st low of 1.3600 with resistance at last week’s high of 1.3870.

CAD – Canadian Economic Data Begins to Sag

The economic data from Canada is beginning to show weakness in the Canadian economy. Last Friday unemployment numbers showed the Canadian economy shed 54K jobs in October while the unemployment rate jumped to 7.3% from 7.1%. Friday’s Canadian jobs report showed that a majority of the job losses were in the manufacturing sector. Market sentiment is also beginning to affect the CAD and events in Europe are helping to support the USD/CAD.

Today Canadian housing numbers will be released along with a speech by BoC Governor Mark Carney. The Risk is for his speech to sound more bearish on the outlook for the Canadian economy given the downbeat Market Policy Report from October.

Technicals for the USD/CAD are turning bullish. After the pair broke its long tern downtrend from the May and August 2010 highs the pair fell back to the trend line and bounced higher in textbook fashion. Resistance for the pair is found at the October 18th high of 1.0260 and a break here could have scope back to the October high of 1.0650. Support is located at the previously broken trend line at 0.9850.

CHF – Deflation Returns to Switzerland

SNB officials may begin to worry over October’s CPI data which showed consumer prices contracted by -0.1% m/m. Consensus estimates were for an increase of 0.2% m/m. The y/y rate is down to -0.1% from +0.5% as last reported in September. The CHF was sold across the board following the data release as market players expect the SNB to take additional action to weaken the Swiss franc in light of the deflation threat. One possible step the SNB could take would be to raise the floor of the EUR/CHF to 1.25 from the initial 1.20 level. Today SNB Governing Board Chairman Philipp Hildebrand will be speaking in Berlin and may shed more light on the strategy behind the SNB’s battle with deflationary forces and an overvalued Swiss franc.

The EUR/CHF reached as high as 1.2390, a level that coincides with its long term downtrend off of the May 2010 high. A decisive break here might find resistance at the October high of 1.2470, followed by the late April highs of 1.2960. Likewise the USD/CHF is moving higher and a crossing of the 50-day and 200-day moving average is a bullish technical indicator. Resistance is found at the October 20th high of 0.9080 and the October high of 0.9310.

Technical News

EUR/USD

After the pair recovered to its long term trend line from the June low the EUR/USD failed to move above the previously broken trend line which turned into a resistance level. Weekly stochastisc have rolled lower and point to additional declines in the pair. Initial Support is found at last week’s low of 1.3600 and a break here could have the pair testing the October low of 1.3145. Resistance is located at the 200-week moving average at 1.3980 followed by the October high of 1.4250.

GBP/USD

The GBP/USD continues to be buoyant with the pair forming a base at its 55-day moving average at 1.5860 though weekly stochastics are beginning to cross which hints at a decline in the price. A break below last week’s low of 1.5875 could have scope to 1.5630 from the October 18th low, a level that is close to the 61% Fibonacci retracement from the October bullish move. Resistance is capped at the pair’s 200-day moving average near 1.6140, followed by 1.6530 off of the trend line from the April and the August highs.

USD/JPY

The MOF intervened in the market when the USD/JPY was at a new all-time low and ensured that both the weekly and monthly candlesticks would make an outside day up, a bullish candlestick. However, the failure of the pair to break above the falling trend line off of the 2007 and 2010 highs show the long term downtrend remains intact. Initial support is found at 77.80 from the September high followed by 77.50. The resistive trend line comes in at 79.50.

USD/CHF

A cross of the 50-day moving average above the 200-day moving average will likely take place within the next few days and is a bullish technical move. Initial resistance is found from the October 20th high of 0.9080 followed by the October high of 0.9310. Support is back at Thursday/Friday’s low of 0.8760 followed by the October low of 0.8565.

The Wild Card

Gold

Spot gold prices have moved above their 61% retracement from the $400 decline seen during the month of September. This puts into play the resistance level of $1,816.50 and forex traders are eyeing the $1,921 high. Support is found at the 55-day moving average at $1,719 and the November 1st low of $1,681.

Forex Market Analysis provided by ForexYard.

© 2006 by FxYard Ltd

Disclaimer: Trading Foreign Exchange carries a high level of risk and may not be suitable for all investors. There is a possibility that you could sustain a loss of all of your investment and therefore you should not invest money that you cannot afford to lose. You should be aware of all the risks associated with Foreign Exchange trading.

Italian Parliamentary Vote Could Boost EUR

Source: ForexYard

printprofile

A vote today in the Italian Parliament at 14:30 GMT may hold the key to Berlusconi’s future as Italian Prime Minister. If today’s events play out anything like yesterday’s rumor of his impending resignation then the ouster or Berlusconi could be EUR positive.

Today’s budget vote may signal Berlusconi has lost his governing majority and a no confidence vote would likely follow to remove the Italian Prime Minister from office. Berlusconi is a survivor and has faced no confidence votes the past.

But both political and economic pressures are building. Recently his party members have been abandoning him with others publicly calling for the resignation of the PM. Pressure continues to be felt in the Italian debt markets with the yield on the Italian 10-year BTP rising to an EMU high of 6.67%.

Traders may remember the price action from yesterday with the EUR/USD climbing 60 pips on a rumor Berlusconi would be tendering his resignation. Those rumors proved to be false and the EUR/USD quickly surrendered those gains. The pair has been testing the falling resistance line off of the October high which comes in today at 1.3780. Additional resistance is found at the 20-day moving average at 1.3840 and last week’s high of 1.3870. Support is located at 1.3700 from the bottom of the narrowing range that has formed since the beginning of the month.

Read more forex trading news on our forex blog.

Forex Market Analysis provided by ForexYard.

© 2006 by FxYard Ltd

Disclaimer: Trading Foreign Exchange carries a high level of risk and may not be suitable for all investors. There is a possibility that you could sustain a loss of all of your investment and therefore you should not invest money that you cannot afford to lose. You should be aware of all the risks associated with Foreign Exchange trading.

Roman or Zimbabwean

By MoneyMorning.com.au

“Cash is probably the most important instrument for small-retail transactions and for transfers of value between individuals. Anecdotal evidence and experience suggest that cash transactions account for the dominant share of the number of transactions, but a very small share of their value… In 2009, withdrawals from ATMs averaged $12.6 billion a month, which equates to around $575 per person.” – Reserve Bank of Australia (RBA) website

One question we may put to the panellists at the Sydney Gold Symposium next Tuesday (providing our peers don’t tell us it’s a stupid question!) is this: Is high or hyperinflation possible in an economy where cash is not the main method of payment?

Granted, it may be a stupid question. But that hasn’t stopped us asking them before. And there’s a reason we ask it.

Which Inflation Would You Like?

Let’s look at the most commonly used examples of high inflation…

The Roman Empire.

Eighteenth century France.

Civil War America.

1920s Germany.

Zimbabwe.

Each experienced a period of inflation (devalued money). Some periods were longer than others. Zimbabwe’s hyperinflation only took a year or so to blast off.

Whereas the debasement of Roman silver coins took over 100 years.

But, there’s an important difference between previous examples of inflation and what we have today.

In the past, consumers could tell the difference between “real” money and devalued money. Simply because both currencies were used at the same time.

When the central bank introduced a new currency or changed the terms of an existing currency (for example, suspending the right to swap it to gold), consumers could see the change…

The coins were smaller… or they contained less gold or silver… or the paper notes no longer had ‘redeemable for gold or silver’ printed on it.

Today, there’s no convertibility to gold or silver.

So there’s no need for the central bank to introduce a new currency. They can just print more of the old one. And no-one can tell the difference. A newly printed note looks the same as a note printed last year.

What’s more, it has the same face value and the same market value. No-one will tell you a 2011 printed $20 note is only worth $19 to them, but that they’ll take a 2009 printed $20 note at face value. That just doesn’t happen.

But here’s the thing. They don’t even need to do that. Not when most money is created and destroyed electronically.

2.7 Cents on the $10

The RBA says in 2009, ATM (automatic teller machine) withdrawals averaged $12.6 billion a month. That’s a lot – about $600 million per business day. But get this…

According to the RBA, “On average, non-cash payments worth around $220 billion are made each business day…”

That number includes everything not involving cash. So it includes credit cards, debit cards, cheques, bank transfers, inter-bank settlements, etc…

In other words, on any given day just 0.27% of financial transactions involve notes and coins! Or to put it another way, for every $10 spent, just 2.7 cents involves cash. The other $9.973 is spent electronically… using “air money” if you like.

The point is, today entire days can go by without a consumer touching a single note or coin. And with new “tap-and-go” technology, many larger retailers are now happy to accept credit or debit cards for small payments… so the need for cash is even less.

With consumers more distant than they’ve ever been from understanding what money is, is it possible consumers will never figure out what central bankers are doing to their wealth?

Maybe that means central banks can just carry on devaluing currencies year after year without the population catching on.

Remember, monetary systems only fall apart when the population gets wind of what’s happening.

They ditch the devalued currency (causing it to devalue further) and pile into the less devalued currency: whether that’s from paper money to gold-backed paper money… or paper money to gold coins… or in the case of Zimbabwe, paper money to another paper money (U.S. dollars).

The outlook looks bleak if we accept that… the central bankers look certain to get away with inflationary money printing for years. But, not so fast…

Hard-Wired to Real Money or Knee-Jerk Reaction

If you remember back to the global financial meltdown in 2008, when banks were on the verge of collapse, what did consumers do? That’s right, they started withdrawing cash.

You may remember the pictures of U.K. bank customers lining up outside the soon-to-fail Northern Rock bank… waiting for the doors to open so they could grab their cash.

Does that mean consumers still understand cash? And that one day they’ll figure out what central bankers have done to the value of money over the past 40 years… resulting in a rush to hard assets (such as gold and silver)… and the eventual collapse of the paper money system.

Or was it just a knee-jerk reaction until governments brought in guarantees of bank deposits? After all, three years after the banking system nearly collapsed, consumers still haven’t completely given up on electronic “air money” in favour of hard assets.

As we see it, it’s a choice between a Zimbabwe style “explosive” inflation and Roman Empire style “slow-burn” inflation.

Which will it be?

We’re afraid we don’t have the answer yet. But we’ll let you know what the panel of experts have to say on the subject next week.

Cheers.
Kris.


Roman or Zimbabwean

The Bear’s Not Dead

By MoneyMorning.com.au

‘European officials are consulting investors and credit-rating companies over two options for translating the rescue fund’s €440 billion in guarantees into as much as €1 trillion of spending power’, Bloomberg News tells us this morning.

Does this mean it’s time to start buying the market again?

No. I don’t think so. The music can stop very quickly on this rally. October has given the Dow Jones Industrial Average its biggest monthly move for about 70 years. The great bulk of the rally has been caused by short sellers who have been wrong footed and have had to buy back shares. Volume has been quite low. And the conviction by the big traders has also not been present.

I don’t think you can judge the rescue package a success until we have seen a couple of week’s trading post the announcement. I’m convinced this rally is close to its used-by date and when the music does stop there won’t be any real buying support to hold it up.

I always respect the ability of the market to do the unexpected. Especially when governments are sticking their noses in and throwing other people’s money around.

The European bailout package is so complex and there are so many moving parts that I can’t help but think there will be some unintended consequences from these actions.

Dealing with this constant intervention makes trading difficult.

The ASX200 has had an amazing run to the upside, which has given me some difficult technical trading patterns to read. We are in an intermediate uptrend still, with the 10-day moving average above the 35-day moving average:

ASX200 chart
Click here to enlarge

Source: Slipstream Trader You Tube Channel

There is some buying support coming in around the 50-day and 35-day the moving average which shows that the uptrend is still intact. We need to see the 10-day cross back under the 35-day moving average before we turn bearish again.

This is more of an observation period rather than a time to jump in and trade. But if you are patient, the market will throw up some fantastic opportunities in the near future.

We may have to withstand some higher prices over the next few weeks, but ultimately I feel safe in my view that this is not over by any stretch of the imagination.

The politicians are clutching at straws if they think they can wave a magic leverage wand and make all of their problems disappear. It is too much leverage that got them into this mess.

More leverage isn’t going to get them out of it.

Cheers,
Murray.
Editor, Slipstream Trader

P.S. Each week I provide free weekly technical analysis on the Australian and US market. And tell you what I think will happen next. It’s all available on my YouTube Channel. If you haven’t checked it out yet, click here to subscribe. Remember, it’s free…

Related Articles

Totally Standard Hyper-Inflation

Is There Any Upside for Gold Investors?

The Gold Bubble and China

What a 2,300 Year-Old Coin Reveals About Gold

Gold Investing Far From a Bubble

From the Archives…

Your Retirement Savings – The Day the Government Began to Raid Them
2011-11-04 – Kris Sayce

Fed Up With Inflation…
2011-11-03 – Kris Sayce

All for Gold… But is There Gold For All?
2011-11-02 – Dr. Alex Cowie

Why Australia Needs More Losers
2011-11-01 – Kris Sayce

Qantas – A Grounded Investment?
2011-10-31 – Dan Denning

For editorial enquiries and feedback, email [email protected]


The Bear’s Not Dead

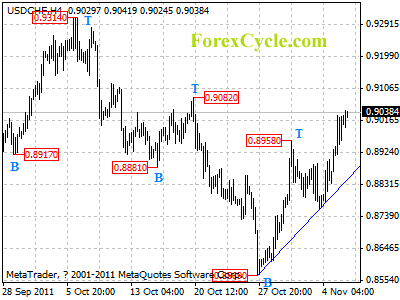
USDCHF broke above 0.8958 resistance

USDCHF broke above 0.8958 resistance, suggesting that the uptrend from 0.8569 had resumed. Further rise is still possible in a couple of days, and target would be at 0.9150-0.9200 area. Support is now at the uptrend line on 4-hour chart, a clear break below the trend line will indicate that the uptrend from 0.8569 is complete, then the following downward movement could bring price back to 0.8000.

usdchf

Forex Trading In India

To many people, trading is synonymous with New York, London, the Orient, with Australia and mainland Europe thrown in for good measure. However, financial dealing is also very common in India and it is possible to trade forex, along with conventional stocks and shares as well as futures.

In actual fact the oldest Stock Exchange in Asia lies in India, the Bombay Stock Exchange, which is still the eighth largest market place in the world. India has a total of 22 exchanges but the majority are not internationally accepted, unlike the Bombay Stock Exchange.

However, despite India being a hub for financial trading, there are a number of restrictions that forex investors will find themselves up against which could potentially hamper how they trade.

Whilst the Indian currency, the Rupee, has started to appear in forex pairs, the volumes are very low and the potential for gains significantly limited. This is because the Indian economy is more isolated than many other nations who trade, meaning that the currency sees far less movement due to the attached regulation. Therefore, it is necessary to convert Rupees to US Dollars before beginning to trade.

This may sound straightforward, but in India there are strict rules over currency conversion. The Reserve Bank of India has recently relaxed the rules and residents are now permitted up to $200,000 per annum – but they are not allowed to trade with it and therein lies the problem. The RBI prohibits trading with the money converted which makes the $200,000 useless for forex purposes.

It is of course possible to lie about the purpose of the conversion and hope not to be caught. However, this is highly illegal in India and not recommended under any circumstances.

A legal alternative is to arrange for a friend or relative outside of India to transfer money into your account as there are no limitations on this. However, whilst it is legal to receive money via money transfer systems, it is not possible to send funds the other way.

A third option is to use online virtual currencies, such as e-gold, but these are not regulated and mean that any dispute is liable to end in tears as you will be unable to irrevocably prove you had money invested.

If you manage to find your way around the thorny issue of currency conversion, little else will stand in your way of trading. Every investor will require a bank account held with one of the large recognised institutions as well as a demat account.

A demat account is similar to a personalised number which officially allows trading in India. Demat is short for dematerialized and is an expression of documents being relayed into an electronic format. It is only used on the stockmarket and acts as a replacement for the sheaf documents which were required before the digital age hit India. A demat account is essential for traders who wish to diversify and can easily be set up with assistance from nearly every bank.

There are forex brokers who are based within India but they are subject to more restrictions than those that operate within India but are based outside. Indian based brokers are only permitted to offer USD/INR pairings at present and the majority also are fee charging, unlike forex brokers based elsewhere in the world.

Although the restrictions on transacting business within India are very different, the way in which pairings should be traded remains exactly the same. Just as in other nations, keeping up to date with forex news is vital and using a myriad of tools to help predict markets will help to bring profits.