The Long Divergence: What Turned the Tables Between the West and Islam?

By The Sizemore Letter

For centuries the Islamic world dominated the West militarily, economically, and culturally.  As late as 1683, when Ottoman forces laid siege to Vienna, Muslim military domination was a legitimate fear for the Christian world.

Excluding the sophisticated Byzantine Empire—which Muslim Arab forces nearly conquered and Muslim Turkish forces did conquer in 1453—and some of the city-states of Italy, the West remained backward and underdeveloped compared to the Middle East for roughly 1,000 years.  Prior to the Renaissance the West had nothing that could rival Damascus, Baghdad or the other great cities of the region.

But then, a funny thing happened.  Europe emerged as an economic juggernaut and turned the tables on the Islamic world.  Starting in the late 1400s and accelerating with the Industrial Revolution of the late 1700s, the West emerged as the dominant military, economic, and cultural force in the world.

The question that has perplexed scholars for ages is why?

None of the popular explanations are satisfactory.  Those who would suggest that Islam is hostile to commerce have clearly never walked the streets of a Muslim country or have never spent five minutes discussing business with a Lebanese—Muslim or Christian.   Arabs—particularly in the Levant—have capitalism in their blood, as do Turks and North Africans.  Try your luck at haggling in a bazaar, and you’ll see what I mean.

The oft-cited Muslim prohibition against the charging of interest also fails to hold water.  The charging of interest was prohibited for Christians in the West for most of the Middle Ages, and neither Christians nor Muslims prevented Jewish minorities within their borders from charging interest.

Islam’s founder was also no stranger to the business of making money.  Unlike Jesus Christ—who lived his earthly life as a humble carpenter and eschewed worldly possessions—Muhammad was a hard-nosed trader and businessman before he became a religious leader, and the Koran is far more “business friendly” than the Christian New Testament.

The second popular explanation—that the Islamic world is poor due to Western imperialism—makes even less sense.  Until roughly 1500 it was the Muslim powers doing the colonizing, not the Christian. And in any event, the West’s eventual colonization of the Islamic world happened only after it had become wealthier, so we’re back to the original question: why did the West rise to the top in the first place?

In his engaging new book The Long Divergence, Timur Kuran believes he has found the answer: the West invented the corporation.

The Christian New Testament is a general guide for spiritual and personal living; it is distinctly not an all-encompassing blueprint for organizing a society.  Ever since Christ’s admonition to render to Caesar what is Caesar’s and render to God what is God’s, there has been an understanding that there are secular areas of life for which religion does not have the answer. This left the Christian world free to experiment with concepts such as double-entry accounting, the limited partnership or the corporation.

Not so in the Islamic world. As Kuran writes,

In principle, Islamic law covered all human activity… In commerce and finance, two areas in which the Middle East fell conspicuously behind, Islamic law played a key role. People entered into contracts that followed an Islamic template and were enforced through Islamic courts. They apportioned estates according to Islamic inheritance rules. Residents of the region’s great cities obtained services mostly from waqfs, which were trusts formed under Islamic law and supervised by officials with religious training. Almost all lawsuits involving at least one Muslim were litigated by Muslim judges, under Islamic legal principles.

Interesting, the uniform commercial code imposed by Islam was initially a boon to commerce.  Since all Muslims played by the same set of rules and were held accountable in the same Islamic courts, business deals across borders became remarkably easy.

Unfortunately, these Islamic institutions had several limitations that made them unsuitable for the modern era:

  1. The concept of limited liability did not exist in Islamic partnership law.  All partners were responsible for the obligations of the partnership, which discouraged risk taking.
  2. Islamic partnerships are designed for specific projects and are not designed to be perpetual going concerns.  The partnerships are automatically dissolved with the death of a partner, and any partner can dissolve the partnership at any time.  Partners could not sell their ownership interests in the form of tradable shares of stock or pass their ownership interests to their heirs.
  3. Islamic inheritance law ensures that assets are dispersed among wives, children, and even siblings, and the common practice of polygamy among the wealthy meant that there were more heirs entitled to a share of the inheritance.  Under sharia, a Muslim only has discretion over one third of his or her assets; the rest is distributed per Koranic guidelines.

These restrictions prevented the multigenerational accumulation of wealth  and prevented the emergence of large corporations that were capable of engaging is long-term, global enterprises.  Something like the British East India Company, for example, would have been absolutely out of the question.

It was only in the late 1800s that Muslim rulers began to import Western legal institutions, and these were subject to opposition by religious conservatives.  But by then, the damage was done.  The West had already leapt into the position of world dominance.

Though his explanations may seem too simple to some readers, Mr. Kuran makes a compelling case and he has the research to back it up.  The Sizemore Investment Letter recommends The Long Divergence for any readers that are economic history buffs.

Alas, for the Occupy Wall Street crowd, the book will only provide more proof of the unassailable power of the modern corporation.

Precious Metals Charts Point to Higher Prices – Part II

By Chris Vermeulen – thegoldandoilguy.com

Over the recent couple months the precious metals charts have made some sizable moves. Most investors and traders were caught off guard by the sharp avalanche type selloff and lost a lot of hard earned capital in just a few trading sessions. Gold dropped over 20% and silver a whopping 40%.

The crazy thing about all this is that these types of moves in precious metals can be avoided and even taken advantage of in certain situations. There is no reason for anyone to continue holding on to those positions after they pullback 6% of more because of the type of price and volume action both gold and silver had been displaying in the past few sessions.

I warned investors on Aug 31st that precious metals were about to top any day and that protective stops should be tightened or taking profits was also a smart move. It was only 2 trading sessions later that precious metals topped and went into a free fall. You can get my detailed analysis if you read my report Dollar’s On the Verge of a Relief Rally Look Out!”.

A couple weeks later once precious metals has found support and the uneducated investor’s were licking their wounds wondering what the heck just happened to their trading accounts… I put out another report but this time with a bullish outlook. Silver was currently trading at $29.96 and I had a $35-$36 price target over the next two months. Gold was trading down at $1611 and I saw it heading back up to $1750-$1775 area before finding resistance and pulling back. Both these forecasts were reached over the next two months. You can quickly review the report called “Precious Metals Charts Point to higher Prices” for more info.

With all that said, what exactly are the charts saying right now?

Current Precious Metals Charts Summary:

The past 6 weeks we have been watching both gold and silver struggle to hold up but they have managed to grind their way to my price targets. After reaching those targets a couple weeks ago sellers have stepped back into the precious metals market and put pressure these metals.

Last week gold and silver started to pullback in a big way with rising volume. This could just be the start of something much larger which I will cover in just a moment.

The wild card for precious metals and for every stock and commodity for that matter is Europe. Every other day there seems to be headline news moving the market and most of takes place in overnight trading for those of us living in North America. It’s this wild card which is keeping me from getting aggressive in the market right now.

Let’s take a look at the charts…

Silver Precious Metals Chart:

Silver is currently in a down trend and may be starting another leg down this week. Long term I am bullish but for the next couple months I am remain neutral to bearish for silver until it forms a base to start a new uptrend from.

Precious Metals ChartsPrecious Metals Charts

Gold Precious Metals Chart:

Currently I am neutral/bearish on gold. If it can trade sideways for a few weeks then I will become bullish.

Precious-Metals-ChartsPrecious-Metals-Charts


Precious Metals Charts Conclusion:

In short, I feel there is a good chance the US dollar will continue higher and if that happens we should see strong selling in North American equities, commodities and likely on the precious metals charts.

Financial markets around the world are at a tipping point meaning something really big is about to take place. The question is which way will investment move. The only thing we can do is trade with the current trends, price patterns and volume.

At this time I still see a higher dollar and that means lower stocks and commodities. This could change at the drop of a hat depending on the news that comes out of Europe so the key to trading right now is to remain cash rich and taking only small positions in the market.

If you would like learn more about etf trading and receive my daily pre-market videos, intraday updates and detailed trade alerts which even the most novice trader can follow then join my FREE trading education newsletter and my premium trading alert service here: – thegoldandoilguy.com

By Chris Vermeulen


USD is Bid to Begin this Week’s FX Trading

Source: ForexYard

printprofile

The USD is up prior to the North American trading session despite a failure of the US super committee to come to an agreement. Pressure remains in the euro zone as Moody’s said France’s credit rating could be downgraded. With the recent USD strength some of the major currencies are now standing at significant technical levels.

It is expected today that the US super committee will fail in its mission to agree on budget cuts and potential tax increases. The failure does not come as a surprise to most market participants given the inability of Congress to work together on almost anything these days. However, it does add an additional level of uncertainty in the already shaky financial markets. Despite the negative news the USD is bid to begin this week’s FX trading as market players focus on events in Europe.

This morning Moody’s warned that France’s Aaa credit rating could be reduced due to elevated borrowing costs and a poor growth outlook for the French economy. One month ago Moody’s warned it could put France on a negative outlook within the next three months. This puts expectations of additional rating action on course for January.

Risk sentiment continues to turn lower due to the European debt crisis with the German DAX down by 2.60%. Many of the major currency pairs are standing close to significant support levels. The GBP/USD is testing the 1.5630 support from the October 18th low. A break here could spur further declines towards the October low of 1.5270. The AUD/USD has retraced 61% of its October move and could fall back to the October 4th low at 0.9385. The NZD/USD has broken its long term rising trend line from May 2010.

Read more forex trading news on our forex blog.

Forex Market Analysis provided by ForexYard.

© 2006 by FxYard Ltd

Disclaimer: Trading Foreign Exchange carries a high level of risk and may not be suitable for all investors. There is a possibility that you could sustain a loss of all of your investment and therefore you should not invest money that you cannot afford to lose. You should be aware of all the risks associated with Foreign Exchange trading.

ECB Sticks to its Guns

By ForexYard

Comments by ECB President Mario Draghi highlight the ECB’s position in the European debt crisis. His remarks suggest the European Central Bank will not come to the rescue of financially pressured nations. However, a creative solution between the ECB and the IMF may allow the ECB to avoid the restrictions placed upon the central bank by EU treaties.

Economic News

CAD – Canadian Inflation Overshoots Forecasts

Canadian inflation for the month of October came in higher than expected with core CPI climbing 0.3% m/m on consensus forecasts of 0.2%. Headline CPI was also higher at 0.2% m/m on expectations of only 0.1%. The year-over-year data requires a second look as it shows core inflation rate actually fell to 2.1% vs. 2.2%.

Despite the drop in the annual inflation rate the monthly inflation data will likely prevent the BoC from lowering interest rates in the near-term out of fear of losing its grip on inflation. The BoC would like to ease interest rates to support the Canadian economy given the expected economic slowdown in Europe.

The CAD was bid after the inflation numbers and could keep the CAD supported in the short term. Support for the USD/CAD is found at the rising support line from the early November lows which comes in at 1.0100. Resistance is last week’s high of 1.0300, followed by the October high of 1.0650.

EUR – ECB Sticks to its Guns

Comments on Friday from ECB President Mario Draghi suggest the ECB will take a hard line stance and not come to the rescue of Italy, Greece and Spain as France would prefer. Draghi’s stated position essentially eliminates the ECB as the “lender of last resort,” a solution where the ECB would buy unlimited amounts of European bonds to allow financially pressured nations continued access to capital markets. The bond purchases would most likely be funded by turning on the ECB printing press. Germany worries this would have the effect of hyperinflation and a loss of the hard earned credibility of the ECB.

The EUR came off of its daily lows on Friday after Dow Jones reported a proposal being studied that could allow the ECB to lend to the IMF and which would turn around and lend to sovereign nations. The creative solution would allow the ECB to avoid breaking EU treaties that prohibit the central bank from financing a nation’s deficit. In other words, the ECB printing press would be still be used. A solution which allows the ECB to finance additional bond purchases would be a EUR catalyst.

There is a bullish wedge pattern that has formed on the EUR/USD daily chart. The falling resistance line is off of the October high and the support line falls off the November 1st low. Resistance is found at 1.3615. A break here and the EUR/USD could test the November highs near 1.3850.

JPY – USD/JPY is a One Way Street

The USD/JPY continues to move lower following a bout of USD weakness. With the USD/JPY breaking below the 76.80 support level there is little support remaining on the charts to stand in the way of the pair’s all-time low.

Since the Japanese intervened in the FX markets on October 31st the USD/JPY has been moving in one direction only. The pair has retraced more than 61% of the gains following the government intervention. Expectations are for the USD/JPY to continue to decline towards its all-time low at 79.55. Resistance will be found back at 76.80 followed by the long term downtrend from 2007 which comes in today at 79.15.

Crude Oil – Crude Oil Briefly Rises Above $100

Spot crude oil prices briefly peaked above the psychological $100 level before being sent lower on a stronger USD and doubts of a continued economic recovery. While the pullback in the price of spot crude oil may seem worrying especially given the bearish technical signal from Thursday’s trading, a healthy trend requires the occasional decline.

As readers of the FOREXYARD Daily Forex Analysis should recall, our expectations for an additional round of bond buying from the Fed (QE3) could very well support crude prices in the future. Despite Thursday’s bearish outside day down candlestick for spot crude oil, a pullback may be natural given the commodity has added more than 33% to its price since the beginning of October. Declines in the price may allow traders additional buying opportunities in the commodity. Support for spot crude oil is found at $96.65 from Friday’s low followed by $94.50 from the October 25th high. Resistance comes in at last week’s high of $103.25 followed by $104.50 from the mid-May high.

Technical News

EUR/USD

There is a bullish wedge pattern that has formed on the EUR/USD daily chart. The falling resistance line is off of the October high and the support line falls off the November 1st low. Resistance is found at 1.3615. A break here and the EUR/USD could test the November highs near 1.3850. Should the pair continue its trend lower the pair could encounter support at the rising trend line from the January 2010 and October 2011 lows at 1.3270. Traders may be eyeing the October low of 1.3145 followed by a deeper move to the 2011 low of 1.2875.

GBP/USD

After breaking lower from the late October-mid November consolidation pattern the GBP/USD rose back to the previous support line at 1.5850 only to turn lower once again. This is a textbook retracement to a previously known support that has now turned into resistance. Support may be found at the October 18th low of 1.5630 followed by the October low of 1.5270. Resistance comes in at the top of the previous consolidation pattern at 1.6075.

USD/JPY

The slow decline of the USD/JPY back to its all-time low at 79.60 continues while the charts show very little support to prevent the move. Any attempt to bid the pair higher may encounter selling pressure at the November 15th high of 77.50 followed by the long term downtrend from the June 2007 high which comes in at 79.10.

USD/CHF

The rally from the late October low continues to gain steam as the pair approaches the October high of 0.9310. Both weekly and monthly stochastics continue to move higher. A break of 0.9310 will expose the 20-month moving average at 0.9450 followed by the February high of 0.9770. Support is off of the November 3rd low of 0.8760 which coincides with the 100-day moving average. While perhaps a bit extreme the pair may eventually target the falling trend line off of the 2003, 2008, and 2010 highs which comes in at 1.1200.

The Wild Card

NZD/USD

The NZD/USD is pressing the rising trend line from May 2005 low and comes in at 0.7540. The pair has already tested this level once today and bounced higher though falling weekly stochastics suggest the pair may have more room to run. Forex traders should note a break lower and the pair may encounter support at the October low of 0.7465 as well as 0.7330 from the 38% Fibonacci retracement of the 2009 low to the 2011 high. The March pivot at 0.7110 also stands out. Resistance is found at the November 3rd low of 0.7800.

Forex Market Analysis provided by ForexYard.

© 2006 by FxYard Ltd

Disclaimer: Trading Foreign Exchange carries a high level of risk and may not be suitable for all investors. There is a possibility that you could sustain a loss of all of your investment and therefore you should not invest money that you cannot afford to lose. You should be aware of all the risks associated with Foreign Exchange trading.

FX Weekly Technical Analysis – USD/CHF May Rise Back to Long Term Trend Line

Source: ForexYard

printprofile

The USD continues to strengthen and shows little signs of slowing in this risk off environment.

EUR/USD

There is a bullish wedge pattern that has formed on the EUR/USD daily chart. The falling resistance line is off of the October high and the support line falls off the November 1st low. Resistance is found at 1.3615. A break here and the EUR/USD could test the November highs near 1.3850. Traders may be eyeing the October low of 1.3145 followed by a deeper move to the 2011 low of 1.2875.

EURUSD_Daily

GBP/USD

After breaking lower from the late October-mid November consolidation pattern the GBP/USD rose back to the previous support line at 1.5850 only to turn lower once again. This is a textbook retracement to a previously known support that has now turned into resistance. Support may be found at the October 18th low of 1.5630 followed by the October low of 1.5270. Resistance comes in at the top of the previous consolidation pattern at 1.6075.

GBPUSD_Daily

USD/JPY

The slow decline of the USD/JPY back to its all-time low at 79.60 continues while the charts show very little support to prevent the move. Any attempt to bid the pair higher may encounter selling pressure at the November 15th high of 77.50 followed by the long term downtrend from the June 2007 high which comes in at 79.10.

USDJPY_Daily

USD/CHF

The rally from the late October low continues to gain steam as the pair approaches the October high of 0.9310. Both weekly and monthly stochastics continue to move higher. A break of 0.9310 will expose the 20-month moving average at 0.9450 followed by the February high of 0.9770. Support is off of the November 3rd low of 0.8760 which coincides with the 100-day moving average. While perhaps a bit extreme the USD/CHF may eventually rise to the falling trend line off of the 2003, 2008, and 2010 highs which comes in at 1.1200.

USDCHF_Monthly

Read more forex trading news on our forex blog.

Forex Market Analysis provided by ForexYard.

© 2006 by FxYard Ltd

Disclaimer: Trading Foreign Exchange carries a high level of risk and may not be suitable for all investors. There is a possibility that you could sustain a loss of all of your investment and therefore you should not invest money that you cannot afford to lose. You should be aware of all the risks associated with Foreign Exchange trading.

Why the European Central Bank Manipulates the Interest Rate

By MoneyMorning.com.au

Taken from the Financial Times:

“The Bank of England signalled it was likely to pump billions more into the economy, after slashing its forecasts for inflation on Wednesday and saying output was likely to stagnate until next summer.”

The U.K. has an inflation rate of 5.2%.

The Bank of England’s (BoE) policy is to target an inflation rate of 2%.

It has failed.

According to the BoE’s Inflation Report:

“Under the assumption that Bank Rate moves in line with market interest rates and the size of the asset purchase programme remains at £275 billion [AUD$434 billion], inflation is judged more likely to be below than above the 2% target at the forecast horizon.”

The market has taken this to mean the BoE will print more money to buy U.K. government bonds. Because, after all, perish the thought that inflation should fall below 2%.

So why is the U.K. getting away with it, while indebted Euro nations aren’t? Because the BoE can print money… it controls the presses.

But that doesn’t mean it’s in any better shape than Greece, Italy or Spain. It just means the U.K. is defaulting through inflation rather than non-payment of debts.

Greece, Italy and Spain have to find another way…

The first step was for the European Central Bank to lower interest rates.

By cutting interest rates below the market rate, governments give themselves a free-kick. They can increase debt levels to cover the drop in tax revenues… while at the same time keep their interest costs stable.

That works for a while. Until markets start to feel there’s no or little chance of the government repaying the debt. When that happens, interest rates go up, investors get scared, and the financial and social engineers think of other whacky ideas.

Such as the proposal by the European Commission (EC) green paper titled, “Feasibility of introducing Stability Bonds”.

Europe’s Subprime Governments

Here are 31 words that prove market volatility is here to stay. It’s proof nothing has changed. That the bureaucrats still don’t get it:

“Stability Bonds would provide all participating Member States with more secure access to refinancing, preventing a sudden loss of market access due to unwarranted risk aversion and/or herd behaviour among investors.”

The EC’s solution is to not just manipulate the interest rate… but the entire bond market… by pooling risk. And forcing investors to buy higher risk debt at a lower interest rate.

But as the subprime mess showed, just because “bad” debt is pooled with “good” debt, it doesn’t mean the investment is safe.

In fact, the pooling of “good” and “bad” debt has the opposite effect. It creates a higher demand because investors start to believe it’s lower risk… and so the demand increases… which encourages the “bad” debt issuers to issue more debt to meet the market demand…

This drives interest rates lower, further convincing the market these things are safe. Until investors again figure out it’s not safe.

Bottom line: we’re now into year four of the Great Recession. The bailouts that were supposed to fix the global economy are failing. But it’s a slow process.

As you’ve seen these past three years the market goes through periods of joy then despair – often within the space of a few days (sometimes within hours). This trend will carry on for at least another five years.

As policymakers keep covering up and fixing their latest mistakes, they only end up making more of them. First the joy, then the despair… market up, market down. And so it continues.

Cheers.
Kris.

Related Articles

Totally Standard Hyper-Inflation

Is There Any Upside for Gold Investors?

The Gold Bubble and China

What a 2,300 Year-Old Coin Reveals About Gold

Gold Investing Far From a Bubble

From the Archives…

The Onward March of the State
2011-11-11 – Kris Sayce

Lose a Shirt, But Gain a Wardrobe
2011-11-10 – Kris Sayce

Neither a Borrower Nor a Seller Be…
2011-11-09 – Kris Sayce

Roman or Zimbabwean
2011-11-08 – Kris Sayce

Lighting a Match to Inflation
2011-11-07 – Kris Sayce

For editorial enquiries and feedback, email [email protected]


Why the European Central Bank Manipulates the Interest Rate

Market Volatility and Buy-and-Hold Disasters

By MoneyMorning.com.au

Market volatility is here to stay.

At first glance that sounds like a problem. But, if you actively manage your investments it could be good news. Because you could use the volatility to add thousands of dollars to your bottom line.

This includes punting on the type of stocks we look at in Australian Small-Cap Investigator.

In fact, we believe high-risk/high-return small-caps should be an integral part of your portfolio. They’re the perfect way to take advantage of market volatility. For that reason, our publisher is giving away our stock tips for free for the next 30 days. (Click here for details).

Of course, there is an alternative to active investing. You could be a buy and hold passive investor. But be warned, we’ve got some bad news. If you make that choice, you shouldn’t expect to add a single dollar to your wealth for the next five years.

The fact is, despite what the politicians say the European debt crisis is no closer to a fix than it was last week when Spanish 10-year bonds almost hit a 7% yield…

Or the week before when Italian 10-year bonds burst through 7%…

Or last Thursday when the Greek 10-year bond yield hit 29%.

Because while high interest rates are great for investors, they aren’t so good for borrowers. And right now, governments are big borrowers.

And that means more market volatility. Not just in Europe, but everywhere. Including here in Australia.

How to Avoid Buy-and-Hold Disaster

For the long term buy and hold investor that spells disaster. Because they’ll just hold… hold on to assets that will be worth the same in five years as they are today.

Take the latest from Super Ratings as reported by the Age this morning:

Super Ratings

Source: The Age

Those are per annum returns over five years. It’s not just super funds. That’s the type of return most buy-and-hold investors have gotten over the past five years. You’re better off sticking cash in the bank.

But with real inflation much higher than the official price inflation rate of 3.5%, you can’t afford to just stay in cash. You’ve got to take risks. Fortunately, if you play the market at its own game (volatility), you can come out ahead.

It involves playing it safe with most of your investible cash while trying to get your timing right with a few carefully selected speculative plays.

You won’t win on every punt, but if you apply the right risk management strategies… and if you “get it” that the market is volatile, you should be set to make inflation-busting returns from a market that’s going nowhere.

Cheers.
Kris.

Related Articles

Totally Standard Hyper-Inflation

Is There Any Upside for Gold Investors?

The Gold Bubble and China

What a 2,300 Year-Old Coin Reveals About Gold

Gold Investing Far From a Bubble

From the Archives…

The Onward March of the State
2011-11-11 – Kris Sayce

Lose a Shirt, But Gain a Wardrobe
2011-11-10 – Kris Sayce

Neither a Borrower Nor a Seller Be…
2011-11-09 – Kris Sayce

Roman or Zimbabwean
2011-11-08 – Kris Sayce

Lighting a Match to Inflation
2011-11-07 – Kris Sayce

For editorial enquiries and feedback, email [email protected]


Market Volatility and Buy-and-Hold Disasters

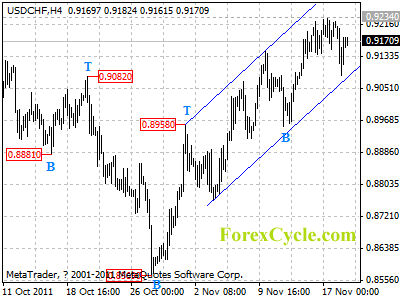
USDCHF’s rise extended to 0.9234

USDCHF’s rise extended to as high as 0.9234 last week. Support remains at the lower line of the price channel on 4-hour chart, as long as the channel support holds, uptrend from 0.8569 could be expected to continue, and one more rise to test 0.9314 previous high resistance is still possible. On the other side, a clear break below the channel will indicate that a cycle top has been formed at 0.9234, and the rise has completed, then the following downward move could bring price back to 0.8000 zone.

usdchf

Daily Forex Analysis