Emerging-Market Stocks to Rise “39 Percent”

Emerging-Market Stocks to Rise “39 Percent”

by Jason Jenkins, Investment U Research
Friday, November 25, 2011

There’s more information coming out to give more credence to the talk that global wealth and growth will stem from emerging rather mature markets for the next few years.

Morgan Stanley is reporting that emerging-market stocks may rise 39 percent by year’s end 2012. They see a “soft landing” for China’s economy, earnings growth and cheap valuations as the main reasoning behind the assessment.

21 Emerging Country Indices

The Morgan Stanley Capital International (MSCI) Emerging Markets Index is a free float-adjusted market capitalization index designed to measure the equity market performance of emerging markets. The MSCI Emerging Markets Index consists of the following 21 emerging market country indices: Brazil, Chile, China, Colombia, Czech Republic, Egypt, Hungary, India, Indonesia, Korea, Malaysia, Mexico, Morocco, Peru, Philippines, Poland, Russia, South Africa, Taiwan, Thailand and Turkey.

According to Jonathan Garner, Morgan Stanley’s chief emerging market and Asia strategist, the MSCI Emerging Markets Index may jump to 1,355 by the end of next year – up from the 976.86 it closed at this Monday. Morgan Stanley is now in agreement with UBS AG (NYSE: UBS) in favoring Chinese stocks for next year founded in the confidence the government will loosen monetary policies to support Asia’s biggest economy.

Garner, who’s based in Hong Kong, went on to say, “Inflation is probably going to fall going forward and we hope for a soft landing in growth… We should be in a better environment for the stock market.”

Why all the optimism?

The MSCI developing nation index has rallied 17 percent from this year’s low early last month. Policymakers from China to Indonesia and across the rest of Asia have moved to bolster economic growth by not raising borrowing costs or even lowering them. Garner suspects the rally has already begun from the low in early October.

As you expect, Morgan Stanley favors China most among emerging markets in Asia and its consumer companies. The Shanghai Composite Index has risen more than nine percent from this year’s low on October 21 as inflation slowed and the government announced measures to help small businesses attain easier access to bank loans. The Hang Seng China Enterprises Index of Chinese companies – listed in Hong Kong – climbed 15 percent since its year’s low.

As far as inflation is concerned, China’s consumer price gains slowed to 5.5 percent in October from a three-year high of 6.5 percent in July. The slowdown in inflation gives the Chinese government more flexibility with monetary policy, which will help as the ever-looming European sovereign debt problem will hurt exports.

“We expect a soft landing in China and earnings growth should hold up very well in this environment, we think the market is too cheap,” said Garner. China may cut interest rates in the first half of 2012, he told Bloomberg.

UBS also prefers China, along with India and Brazil, among emerging markets for 2012. With such a broad investment spectrum, this would probably be a good time to go with a fund such as the Templeton Emerging Markets Fund (NYSE: EMF) or the Vanguard Emerging Markets Stock Index (VEIEX) to have across the board exposure. For direct exposure to the MSCI Emerging Markets Index, there’s a fund – the MSCI Emerging Markets Index Fund (NYSE: EEM).

Good investing,

Jason Jenkins

Article by Investment U

Gold Falls on ‘Black Friday’, ECB Assistance “Unavoidable” for Belgium, “Funding Stresses & Weak Rupee Weighing on Gold”

London Gold Market Report
from Ben Traynor
BullionVault
Friday 25 November, 09:00 EST

U.S. DOLLAR gold prices looked set for a second weekly drop in a row Friday lunchtime, after falling as low as $1672 an ounce – 7.2% down on the November high – while stocks, commodities and government bond prices also lost ground as Belgium became the latest country to be sucked into the European sovereign bond crisis.

New York’s Comex gold futures exchange will close early today – having been shut for Thanksgiving yesterday – as US shoppers hit the stores in search of Black Friday discounts.

Heading into the weekend, Dollar gold prices looked set for a loss of nearly 3% on the week.
“There are two factors which are putting downward pressure on gold,” says Standard Bank commodities strategist Walter de Wet.

“The first is weak emerging market currencies in general, and the Indian Rupee in particular. The second is funding stress in Europe.”

In spite of this morning’s fall in gold prices, “we still haven’t seen any significant physical demand coming through,” de Wet adds.

“I think sentiment in the physical side is not that bearish,” says one Hong Kong trader.
“But the funds are more cautious because of fears of recession…[they] are worried that their clients will redeem assets to get more cash on hand.”

Silver prices also fell, hitting $31.10 per ounce – and headed for weekly loss of around 4%.
On the stock markets, by Friday lunchtime both the UK’s FTSE and Germany’s DAX looked to be heading for their tenth straight daily loss – down 0.4% and 0.5% respectively.

Dexia – the Franco-Belgian bank whose Belgian division was nationalized last month – is drawing down emergency liquidity funds from central banks in Belgium, France, Italy and Spain, news agency Reuters reported Thursday.

Dexia is waiting for the governments of Belgium, France and Luxembourg – which last month pledged to guarantee €90 billion of the banking group’s borrowing for ten years – to finalize the arrangement.

Yields on 10-Year Belgian government bonds rose to 5.81% this morning – up from 3.6% at the start of October.

“I think Belgium will be included in the ECB buying program,” one trader told Reuters.

“I don’t see how they can avoid it now that yields are getting up towards 6%”.

Elsewhere in Belgium, “another [European Central Bank] rate cut will likely follow…if the current [economic] trends continue” Belgian central bank governor Luc Coene – who is also on the ECB’s 23 member Governing Council – said Friday, Belgian newspaper De Tijd reports.

Coene also reportedly saidthe ECB’s policy of buying distressed sovereign bonds on the open market, is not sustainable.

“The markets would notice that ECB has a lot of Italian and Spanish paper on its balance sheet and they would lose confidence in the ECB,” De Tijd quoted Coene.

French and German leaders will seek a “positive compromise” on the question of what role the ECB should play in resolving the sovereign debt crisis, French president Nicolas Sarkozy said yesterday.

Sarkozy – who held talks with German chancellor Angela Merkel and Italian prime minister Mario Monti – said that he and Merkel have agreed to refrain from discussing the matter publicly.

“The three of us have indicated that we will respect the independence of this essential institution and we agreed that we should refrain making any demand, positive or negative, on it,” Sarkozy said.

French finance minister Francois Baroin has previously called for a “solid firewall” with ECB backing to prevent contagion. Merkel said earlier this month that any politicians who believe the ECB can solve the Euro crisis were “trying to convince themselves of something that won’t happen”.

“We must take steps toward a fiscal union,” Merkel said yesterday.

Italy successfully auctioned €8 billion worth of 6-month Treasury bills Friday morning. The average yield, however, was 6.504% – the highest since August 1997, and up from 3.535% at the last 6-month T-bill auction on October 26.

Ratings agency Moody’s meantime issued its latest sovereign downgrade late Thursday, when it cut Hungary’s rating one notch from Ba1 to Baa3 – sending Hungary’s bonds into ‘junk’ territory.

Over in India, total silver bullion imports for 2011 are expected to come in slightly lower than last year’s 3030 tonnes , according to a senior bullion bank executive.

“Silver business [by volume] is not that significant,” Rajan Venkatesh, managing director, India bullion at Scotia Mocatta told reporters Thursday.

2011 Indian gold imports, by contrast, could rise to 1000 tonnes, Venkatesh says– despite Rupee gold prices hitting record highs this month.

Since the start of the year, the Rupee has fallen 15% against the Dollar, hitting an all-time low earlier this week.

The value of India’s gold consumption last year was approximately 2.5% of 2010 gross domestic product, according to BullionVault calculations based on World Gold Council and International Monetary Fund data.

India’s current account deficit last year was $49.0 billion – 3.2% of GDP – according to the IMF. IMF projections forecast that this will grow to $62.5 billion for 2011 – 3.7% of GDP.

Ben Traynor
BullionVault

Gold value calculator   |   Buy gold online at live prices

Editor of Gold News, the analysis and investment research site from world-leading gold ownership service BullionVault, Ben Traynor was formerly editor of the Fleet Street Letter, the UK’s longest-running investment letter. A Cambridge economics graduate, he is a professional writer and editor with a specialist interest in monetary economics.

(c) BullionVault 2011

Please Note: This article is to inform your thinking, not lead it. Only you can decide the best place for your money, and any decision you make will put your money at risk. Information or data included here may have already been overtaken by events – and must be verified elsewhere – should you choose to act on it.

Indicators VS Price Action

When it comes to reading a chart, many traders are divided in their opinions as to which method is most profitable: Trading with indicators or Trading Price Action. Both methods are proven in being profitable, however Price Action Trading can be a much simpler and more profitable way of looking at the market.

Indicator based trading consists of the trader introducing indicators onto their charts helping them predict what the market is going to do next. Indicators in their most basic form indicate the direction or lack of direction of trend. There are two types of indicators; Leading and Lagging.

Leading Indicators indicate to the trader before a trend or reversal of a trend is about to occur.

Lagging Indicators indicate to the trader after a trend or reversal has occurred.

There are 100’s if not 1000’s of different leading and lagging indicators. Many are generic and can be found on most charting platforms; however some are customized and require specialized knowledge before use.

Price Action trading consists of the trader using the most basic of all information available, the Price, before making any trading decisions. Similar to indicator based trading, price action trading helps the trader determine what the market is going to do next. This type of trading in its most basic form includes using specific charting patterns and support and resistance levels.

The most common mistake made by most novices and a handful of experienced traders is trading using too many indicators. Many traders will make the mistake of ‘cluttering’ their charts with complex indicators believing they gain an ‘edge’ over the market. They believe the more information they have available the better their analysis will be. This is a common misconception which often leads to traders being unable to make definite decisions leading to mistakes and poor trading. Having a chart filled with too many indicators simply confuses the trader and covers the only real information they need to trade; the PRICE! Take a look at the chart below which has only 4 of the most common indicators used by indicator based traders. It’s clear to see how ‘messy’ and confusing this chart looks.  Where would one begin to analyze this chart?


indicatorchart

Although indicator based trading can be profitable for some traders it’s not the only way to trade. Often indicators give conflicting signals; for example a MACD can be giving a sell signal and an RSI can be signaling a buy. How does the trader know which indicator to believe? Indicator based trading can become very confusing and with the often conflicting signals can become very frustrating often leaving the trader missing out on trading opportunities.

Price action trading on the other hand clears the ‘mess’ indicators produce leaving the trader with the only real information they need to trade. When trading we are analyzing what the PRICE is going to do next which is why it makes sense to only concentrate on what the price is doing now. Take a look at the same chart seen above but this time notice how clean and easy to read it is. With only one simple horizontal level (resistance) drawn on its quite obvious which chart is easier to analyze.


priceactionchart

As you can see Price action trading can be a much simpler and a more profitable way of looking at charts. On a price action chart the PRICE is easy to see. Knowledge of chart patterns and the ability to identify horizontal support and resistance areas can greatly improve a trader’s analytical skill.

Cons of Indicator based trading –

Cluttering your chart with often needless information

Lagging information. We’re not trading the past, we’re trading the present

100’ if not 1000’s of different indicators. Which are best?

Very time consuming in learning how different indicators work and which combinations work best together.

Conflicting signals. Maybe one indicator is saying buy while another is saying sell.

Pros of Price Action Trading –

Only a few simple and easy to understand chart patterns are required to start price action trading.

No need to spend hours and hours learning about different indicators.

Clean charts. No ‘mess’ cluttering your chart, leading to less confusion.

Professional traders use price action.

We’re trading the present not the past. PRICE DOSNT LIE!

Article by vantage-fx.com

How to Profit As the U.S. and China Battle for Southeast Asia

How to Profit As the U.S. and China Battle for Southeast Asia

by Carl Delfeld, Investment U Senior Analyst
Friday, November 25, 2011: Issue #1651

I never thought I would ever say this but (three deep breaths)

Hillary Clinton has done a great job as Secretary of State, shifting American attention and resources from the Mideast to the booming Asia-Pacific region.

You can profit by following this strategic shift in U.S. diplomacy, so let’s look at some snapshots that highlight America’s re-engagement with Asia.

During the past week alone, there was some intensive Pacific Rim diplomacy.

  • Hosting the Asia-Pacific Economic Community (APEC) meeting in Hawaii last week and the presidential mission to Australia to deepen commercial and security ties.
  • President Obama’s visit to Indonesia last week to promote U.S.-Indonesian commerce and to attend the East Asian Summit in Bali. There, he met separately with the leaders of India, Indonesia, Malaysia and the Philippines. Indonesia’s Lion Air inked a deal to buy $22-billion worth of Boeing aircraft.
  • Launching the Trans-Pacific Partnership (TTP) – essentially a free trade agreement for the Pacific Rim including Japan.
  • Playing a more active role in pushing for open access and peaceful resolution to disputes in the South China Sea.

What does all this mean for you as an investor?

Pivot to Asia

First, take a look at your portfolio and see if you have enough exposure to Asia, especially beyond China and India. Perhaps you have less than you think. Merrill Lynch Bank of America recently did a review of its high net worth clients’ portfolios and found that the average allocation to emerging markets was only three percent.

Second, think about what’s the best strategy to profit from the inevitable and healthy rivalry between America and China for commercial gain in Asia?

Here’s my take. Look at the below map and you will see a thriving region south of China and east of India – Southeast Asia. This is a region often overlooked by even the most sophisticated investors and is the cockpit of rising U.S.-China commercial rivalry in Asia for a number of reasons.

These countries lie along vital sea-lanes and chokepoints, are rich in natural resources, have export-oriented fast-growing economies and politically balance their relations with both China and America as a hedge against uncertainty.

The free trade pact between the regional grouping for Southeast Asia (ASEAN) and China launched in early 2011 has supercharged trade and investment flows.

Follow U.S. Diplomacy to the heart of Southeast Asia

To counter rising Chinese influence, many of the American initiatives outlined above are aimed at strengthening commercial and security ties with Southeast Asia.

My advice is to begin with the iShares Singapore Index Fund (NYSE: EWS). The “Switzerland of Asia” plays a key role as the financial center for the region. While it’s only one-fifth the size of Rhode Island and three times the size of Washington, D.C., it’s the most strategically important global trading, finance and service nexus in Asia. Singapore is the busiest port in Asia, situated next to a vital trading chokepoint, the Straits of Malacca.

Singapore has a well-diversified economy. Seventy percent of its GDP is from finance and services but it has been able to maintain a robust manufacturing base. A promising trend is that multinational firms are moving their Asia-Pacific headquarters from China to Singapore due to its infrastructure, logistics and laws protecting intellectual property.

Exxon Mobil, Royal Dutch Shell and Sumitomo are expanding petrochemical facilities. Strong global demand for transportation, communications and logistics services, increasing information technology spending, rising consumer spending and property prices, and expanded tourism all point toward continued growth.

Next, add a dash of iShares MSCI Malaysia Index Fun (NYSE: EWM), for a country that offers investors many of the attributes of neighbor Singapore with the added benefit of natural resources and lower wage levels.

Malaysia is a constitutional monarchy a bit larger than New Mexico. Rich in natural gas and an oil exporter, it offers investors an economic environment of low inflation and debt. It’s a solidly middle-income country with a per capita income north of $10,000.

Although palm oil, tin, petroleum, copper, iron ore and other commodities are an important part of the Malaysian story, it’s well diversified with 50 percent of GDP attributed to the services sector, 40 percent to industry and 10 percent to agriculture. Malaysia’s capital, Kuala Lumpur, is also a rising regional financial center.

Finally, with U.S. interest rates at record lows and hot money pouring into fast-growing Asian markets, the investing in the Malaysian ringgit and the Singapore dollar through EWS and EWM offer investors a nice hedge on the U.S. dollar.

Singapore and Malaysia will continue to fire a region burning on all cylinders. Take a stake today.

Good investing,

Carl Delfeld

Article by Investment U

Strong German Data but PMIs Point to Lower EU Growth

By ForexYard

Yesterday’s data from Germany was on the positive side but disappointing PMIs from Europe point to a recession in the euro zone.

Economic News

USD – US Data Trending Higher

Mixed US data was released on Wednesday which paints a varied picture of the US economy. Q3 GDP data was revised lower at 2.0% from 2.5%. Also US durable goods orders fell by -0.7%, though the number was above consensus forecasts of a decline by -1.1%. Core durable goods orders were well above forecasts, rising by 0.7% on expectations of a gain for only 0.1%. While the revised GDP numbers are disappointing, the US economy is beginning to show signs of a recovery as core durable goods orders have climbed 6.9% year-over-year.

Personal income was also up by 0.4% on expectations of 0.3% while personal spending rose 0.1% on forecasts of a 0.3% gain. The drop in spending suggests the contribution by consumers to Q4 GDP will likely be smaller than previous estimates.

Despite the mixed economic numbers the USD continues to be supported in an environment with heightened risk aversion. Barring any breakthrough in the rift between Germany and France the USD will likely continue on this path.

EUR – Strong German Data but PMIs Point to Lower Future EU Growth

Yesterday’s data from Germany was on the positive side. Q3 GDP shows the German economy is growing at a respectable pace of 2.6% y/y. The Ifo business climate survey came in with higher than expected numbers. Unfortunately the trend of European PMIs shows both the German and European economies are most likely to grow at a slower pace in Q4. With weaker growth expectations the response from the ECB will likely be for another 25 bp rate cut in December. This would have Draghi unwinding the 50 bp of tightening that Trichet carried out in the first half of the year. With another rate cut the EUR may continue to suffer from a combination of the European debt crisis and falling interest rate differentials.

JPY – USD/JPY Carving Out a Base

USD strength has helped the JPY ease from its lows as the USD is the premier safe haven currency during the European debt crisis. Lower yields on US debt may also temporarily support the USD/JPY. The USD 10-year note is currently yielding 1.88% and the spread between the US bond and its Japanese equivalent has fallen to only 0.90 in favor of the US.

The USD/JPY is carving out a base near the 76.80 level after a failed attempt to breach below the support. On Wednesday the price made a move above the initial resistance of 77.50 from the mid-October lows only to run into selling pressure. Should the European debt crisis continue to heat up the USD could strengthen and the USD/JPY may climb to 77.85 from the November 9th high.

Gold – Spot Gold Prices Consolidating before Next Move

Despite the volatility that has been seen in the financial markets spot gold prices have been consolidating from their recent declines. A bear pennant pattern has been forming on the daily chart with a falling resistance line from the November 18th high and support from the November low. The chart pattern is considered bearish as the current trend in the commodity is to the downside and the measured move from the pattern suggests a move of $8.50. Support for the commodity is found at the October 20th low of $1,607.

Technical News

EUR/USD

There is a bullish wedge pattern that has formed on the EUR/USD daily chart. The falling resistance line is off of the October high and the support line falls off the November 1st low. Resistance is found at 1.3615. A break here and the EUR/USD could test the November highs near 1.3850. Should the pair continue its trend lower the pair could encounter support at the rising trend line from the January 2010 and October 2011 lows at 1.3270. Traders may be eyeing the October low of 1.3145 followed by a deeper move to the 2011 low of 1.2875.

GBP/USD

After breaking lower from the late October-mid November consolidation pattern the GBP/USD rose back to the previous support line at 1.5850 only to turn lower once again. This is a textbook retracement to a previously known support that has now turned into resistance. Support may be found at the October 18th low of 1.5630 followed by the October low of 1.5270. Resistance comes in at the top of the previous consolidation pattern at 1.6075.

USD/JPY

The slow decline of the USD/JPY back to its all-time low at 79.60 continues while the charts show very little support to prevent the move. Any attempt to bid the pair higher may encounter selling pressure at the November 15th high of 77.50 followed by the long term downtrend from the June 2007 high which comes in at 79.10.

USD/CHF

The rally from the late October low continues to gain steam as the pair approaches the October high of 0.9310. Both weekly and monthly stochastics continue to move higher. A break of 0.9310 will expose the 20-month moving average at 0.9450 followed by the February high of 0.9770. Support is off of the November 3rd low of 0.8760 which coincides with the 100-day moving average. While perhaps a bit extreme the pair may eventually target the falling trend line off of the 2003, 2008, and 2010 highs which comes in at 1.1200.

The Wild Card

EUR/CHF

The EUR/CHF has fallen to its lowest value in over three weeks below the psychological 1.23 level. With the price at 1.2250 the pair is sitting above significant support from the 200-day moving average as well as the gap from Monday November 7th. Forex traders should note that if the EUR/CHF closes the gap it could continue to the November low of 1.2130.

Forex Market Analysis provided by ForexYard.

© 2006 by FxYard Ltd

Disclaimer: Trading Foreign Exchange carries a high level of risk and may not be suitable for all investors. There is a possibility that you could sustain a loss of all of your investment and therefore you should not invest money that you cannot afford to lose. You should be aware of all the risks associated with Foreign Exchange trading.


France to Propose EU Treaty Changes

During a press conference earlier today, French President Nicolas Sarkozy and German Chancellor Angela Merkel attempted to patch up a public rift stemming from an incident last week. The two leaders also used the session to express confidence in newly-appointed Italian Prime Minister Mario Monti.

As the heads of the two largest members of the Eurozone, Merkel and Sarkozy have made a great effort to present a united front while tackling the debt crisis. This is why markets were so surprised when the two leaders were so clearly at odds last week over the latitude with which the ECB could operate in the sovereign bond markets.

French officials actively lobbied for the ECB to invest heavily in government bonds in order to ensure sufficient liquidity and to keep yields lower. Germany, on the other hand, argued that under European Union rules, the ECB did not have the mandate to buy the debt of individual nations. Merkel harkened this to acting as a de facto “lender of last resort” for nations struggling with higher yields on their bonds.

Given events earlier this week that saw French bond yields rise amidst warnings that France could lose its triple A rating, there is little chance that French officials will abandon their efforts to see the ECB intervene. Indeed, Sarkozy left the press conference stating that “propositions for the modification of treaties” would be offered within the next few days.

Further details on the proposals were not offered other than Merkel insisting that the proposals did not directly impact the ECB. Meanwhile, Germany received its own yield scare this week which has increased concerns the very future of the Eurozone could be in jeopardy.

Scott Boyd is a currency analyst and a regular contributor to the OANDA MarketPulse FX blog.

USD/SEK Breaking 2-Year Downtrend

Source: ForexYard

printprofile

The Swedish krona continues to weaken as the USD/SEK breaks higher above its 2-year downtrend.

Barring any surprises today the USD/SEK looks poised to close on a weekly basis above the downward sloping trend line from February 2009. The pair will encounter initial resistance at the September high of 6.9915, followed by the November 2010 high of 7.0700. A break here will open the door to the 2010 August and June highs of 7.5100 and 8.1350. The broken trend line may prove to be supportive at 6.6860 followed by the October low of 6.3075.

USDSEK_Weekly

Read more forex trading news on our forex blog.

Forex Market Analysis provided by ForexYard.

© 2006 by FxYard Ltd

Disclaimer: Trading Foreign Exchange carries a high level of risk and may not be suitable for all investors. There is a possibility that you could sustain a loss of all of your investment and therefore you should not invest money that you cannot afford to lose. You should be aware of all the risks associated with Foreign Exchange trading.

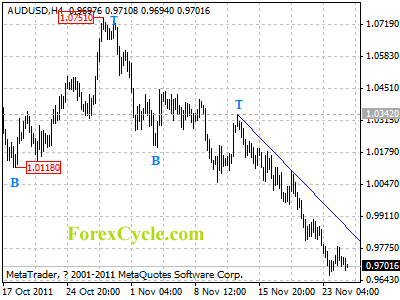
AUDUSD stays below a downward trend line

AUDUSD stays below a downward trend line on 4-hour chart, and remains in downtrend from 1.0342. As long as the trend line resistance holds, downtrend could be expected to continue after a minor consolidation and next target would be at 0.9600 area. However, a clear break above the trend line could indicate that the fall from 1.0342 has competed, then the following upward movement could bring price to 1.0400 zone.

audusd

Daily Forex Analysis

Gold – Your Wealth Insurance Policy

By MoneyMorning.com.au

Gold as a wealth insurance policy is looking more attractive all the time…

Moody’s downgraded Portuguese and Hungarian bonds to junk status last night.

And yesterday there was a run on Latvian bank, Bankas Snoras AB.

Latvians Queue Up To Withdraw Their $95 A Day Allowance

Latvians Queue Up To Withdraw Their $95 A Day Allowance

Source: Zerohedge

From Zerohedge…

‘Depositors can withdraw 50 lati a day beginning today for the rest of the week, said [Irena] Krumane [head of Latvia’s bank regulator] at a press conference.” At today’s rate this is about $95.’

And that’s on top of every other Eurozone issue you’ve read about in Money Morning over the last two years…

But so what?

The ECB will start printing money soon, right? They’ll buy up Spanish and Italian debt… won’t they? (ECB officials have given no indication they will do this but the markets think they are bluffing.) We’re not so sure.
If you’re not so sure either, we have some advice for you…

One of the safest ways you can hedge against a lack of confidence and trust in the financial system is to own physical gold.

When you own physical gold – and have it stored securely – your assets are outside the financial system. No matter what happens to financial markets, you have a portion of your wealth out of harm’s way.

Think of it as wealth insurance.

Given the intractable problems within the European Union and the latent debt crises in Japan and the US, gold is one of the only assets I can see increasing in value significantly in the next five years.

Where could gold prices go?

US$5,000 an ounce is possible as trust and confidence in the system deteriorates.
Part of the psychology of a bear market is that investors slowly change their thinking from ‘how to make money’ to ‘how not to lose it’.

And each year, more and more investors will want to take out insurance in the form of gold. This means they will move a portion of their assets out of paper (say government bonds) and into physical metal.

And I’m not just talking about individual investors.

I’m talking pension funds and insurance companies. Once they realise their vast holdings of ‘risk-free assets’ (government bonds) are not risk free, they will start to allocate a small portion of their capital to physical gold – the great protector of wealth in times of financial turmoil.

But that is all in the future.

The chart below shows the US dollar gold price since 2006. Can you spot the trend?

After advancing to record highs earlier this year, gold is now in a ‘consolidation’ phase. How long this lasts… who knows. If Europe implodes, we could see another sickening 2008 type correction.

We’re putting a low probability on that outcome though.

Since 2009, gold has held above the 200-day moving average (red line) and I think that will continue to be the case.

Gold Spot Price
Click here to enlarge

Greg Canavan
Editor, Sound Money. Sound Investments

Publisher’s note: Greg Canavan is the foremost authority for retail investors on value investing in Australia. He’s the former head of Australasian Research for a major asset-management group and a regular guest on CNBC, Sky Business’s ‘The Perrett Report’ and Lateline Business. Greg shares his insight, ideas and investment recommendations with readers of his Sound Money. Sound Investments newsletter… to find out more information on Greg’s letter, go here.

Related Articles

Totally Standard Hyper-Inflation

Is There Any Upside for Gold Investors?

The Gold Bubble and China

What a 2,300 Year-Old Coin Reveals About Gold

Gold Investing Far From a Bubble

From the Archives…

The Onward March of the State
2011-11-11 – Kris Sayce

Lose a Shirt, But Gain a Wardrobe
2011-11-10 – Kris Sayce

Neither a Borrower Nor a Seller Be…
2011-11-09 – Kris Sayce

Roman or Zimbabwean
2011-11-08 – Kris Sayce

Lighting a Match to Inflation
2011-11-07 – Kris Sayce

For editorial enquiries and feedback, email [email protected]


Gold – Your Wealth Insurance Policy