AUD/USD – Weekly outlook 24 Oct – 28 Oct

AUD/USD – Weekly outlook 24 Oct – 28 Oct

Last week saw the bullish momentum we have seen in the Aussie so far this month slowing down with the market chopping in a 260pip range. The market managed to just about stay under the 1.04 level mentioned in last week’s outlook. The outlook on the Dailies remains the same as last week. Should we see the recent bullish momentum resume a break above the 1.04 area could lead to further gains up to 1.06 and beyond. However it is still possible to see a ‘bounce’ of the 1.04 area which could potentially lead to a fall back to parity.


audusdweeklyoutlook24oct28octdailychart

On the weekly charts we saw the market break and close out of the upper channel line mentioned in last week’s outlook. Its significant to note that last week’s candle has closed as a bullish pin suggesting further gains could be seen in the coming day’s/week’s.


audusdweeklyoutlook24oct28oct

With the strong upper resistance on the daily charts and the bullish pin bar on the weekly the market is giving conflicting signals. At this moment it would be advisable to stay patient and ‘wait and see’ what the pair finally decides to do. Should we see any bearish price action rejection signals at the resistance areas mentioned above we will look to short this market back down to lower levels.

http://www.vantage-fx.com


Forex: Currency Speculators add to bearish bets on Euro, increase Dollar longs

By CountingPips.com

The latest Commitments of Traders (COT) report, released on Friday by the Commodity Futures Trading Commission (CFTC), showed that large futures speculators added to their euro short positions and increased bullish positions in favor of the US dollar. Speculative positions have now totaled a bullish dollar bias for a sixth straight week.

Non-commercial futures traders, usually hedge funds and large speculators, slightly increased their total US dollar long positions to $14.86 billion on October 18th from a total long position of $14.24 billion on October 11th, according to the CFTC COT data and calculations by Reuters which calculates the dollar positions against the euro, British pound, Japanese yen, Australian dollar, Canadian dollar and the Swiss franc.

EuroFX: Currency speculators slightly increased the short bets for the euro against the U.S. dollar as of October 18th to a total of 77,220 net short contracts from the previous week’s total of 73,795 net short contracts reported on October 11th. Euro positions are close to their most recent low point recorded on October 4th when net contracts were on the short side at 82,697.

The COT report is published every Friday by the Commodity Futures Trading Commission (CFTC) and shows futures positions as of the previous Tuesday. It can be a useful tool for traders to gauge investor sentiment and to look for potential changes in the direction of a currency or commodity. Each currency contract is a quote for that currency directly against the U.S. dollar, where as a net short amount of contracts means that more speculators are betting that currency to fall against the dollar and net long position expect that currency to rise versus the dollar. The graphs overlay the forex spot closing price of each Tuesday when COT trader positions are reported for each corresponding spot currency pair.

GBP: British pound sterling positions have increased for two consecutive weeks after their six-week decline, according to the data as of October 18th. Pound positions increased to a total of 53,226 net short positions on October 18th following a total of 61,972 short positions as of October 11th.

JPY: The Japanese yen net long speculative contracts decreased for a second consecutive week and to the lowest level since July. Yen positions fell to a total of 26,907 net long contracts reported on October 18th following a total of 35,119 net long contracts that were reported on October 11th. The latest data marks the lowest level since July 12 when large speculators net positions equaled 28,288.


CHF: Swiss franc long positions edged lower and fell over to the short side after an increase the previous week. Speculators decreased bets for the Swiss currency futures to a total of 2,243 net short contracts following a total of 13 net long contracts as of October 11th. The Swiss currency, usually a popular safe haven currency, has seen muted movements in recent trading since the Swiss National Bank has maintained a policy to curb the gains of the franc and initiate a peg against the euro at the 1.20 level.


CAD: Canadian dollar positions edged slightly higher from the previous week which marked the lowest bearish level of the year. CAD net contracts slightly rose to a total of 24,795 short contracts as of October 18th following a decrease to a total of 24,913 short contracts reported on October 11th.


AUD: The Australian dollar long positions increased as of October 18th after a small decline the previous week. AUD futures positions rose to a total net amount of 20,353 long contracts following a total of 10,753 net long contracts reported as of October 11th. The October 18th level was almost double the previous week’s total and almost 4 times the amount of the September 27th recent low level which had marked the lowest level for Aussie positions since July of 2010.


NZD: New Zealand dollar futures positions advanced for a second consecutive week after previously falling for a string of three consecutive weeks to the lowest level since the middle of April on October 4th. NZD contracts advanced higher to a total of 8,225 net long contracts as of October 18th following a total of 6,838 net long contracts registered on October 11th.


MXN: Mexican peso contracts edged very slightly higher as of October 18th although contracts have been essentially unchanged for three straight weeks. Peso positions edged up to a total of 24,129 net short speculative positions as of October 18th following a total of 24,870 short contracts that were reported on October 11th and a total of 25,431 short contracts on October 4th.

COT Currency Data Summary as of October 18, 2011
Large Speculators Net Positions vs. the US Dollar

EUR -77720
GBP -53226
JPY +26907
CHF -2243
CAD -24795
AUD +20353
NZD +8225
MXN -24129


How People Make Money Through The Forex System

By Cedric Welsch

Currency news trading is becoming a popular trend among financial investors nowadays. The reason is because the forex system provides a good source of income for those who trade smartly. One of the main reasons why people trade forex is because it allows them to speculate on the fluctuations of currency pairs and make money from it. For some, they make huge amounts of money, while others make extra.

Trade forex news is essential to every trader because it allows them to guess how the financial market will move. The forex system involves the trade of two sets of currency. One pair constitutes one forex product. When the value of one currency falls in comparison to the other, the trader can make money by buying it at a lower price and later selling it at a higher price. This is how money is made through the system. However, knowing when to sell or buy is essential to gaining profit. Hence, forex news is essential in keeping traders updated.

Getting Quality Training and Education

With proper training and education in the currency market, you can easily achieve your financial goals. There are many sites online that provide free training information, instructional material, and trading platforms. To practice the trade, you can sign in for a free demo account on one of the many platforms on the Internet.

The demo account does not require payment of actual cash. It provides the investor with virtual money for practice purposes. Learning how to trade in real time allows you determine how the forex system works. It also allows you to develop winning strategies.

When to Trade Actual Currency

With sufficient practice and knowledge on the system, you can now proceed with the actual trading process. It takes time to develop winning strategies, but do not be discouraged with the initial loses. Every trader has been there. The only thing that matters is you keep practicing and learning from your mistakes. You can also learn from the experts and derive good insight from how they do their own trades.

The sweetest victory for the trader is his first win. However, the secret to making money from the system is beating the losses. It is not important how many times you lose. It is important how much money you make when you win. Hence, speculate carefully and be sure to keep updated with the latest news to determine when to buy or sell for profit.

About the Author

Some incomprehensible numbers and stats may arise as you hear forex news trading from different sources. The more heavy the gravity of a certain forex scam, the more you need to be aware of it too.

Forex Exit Strategy – How to Pinpoint Exit For Maximum Profit

By Warren Seah

Being a form of business, forex trading requires meticulous planning before proceeding to carry out. Almost everybody could be said to be taking part daily in the forex market as everybody engages in one form of buying and selling activity or another; otherwise called currency trading. In forex trading, it is easy to enter and exit the market just by pressing a button. But you need to have a forex exit strategy ready when entering the market.

To be successful in trading, just like most other things in life, you need to have a plan. A plan that has strategies for success incorporated into it. The plan and strategies you have in place go a long way in determining how successful you will be in forex trading. Entering the market without any previously determined plan of action and strategies is tantamount to risking your financial resources. A good entry strategy as well as a better exit strategy are very important. It is always better to have a plan when starting any business than to begin putting one together half way through when the business had already gone awry in an attempt to prevent further losses; that would be like putting the cart before the horse.

There is the need to have a suitable forex exit strategy when trading. The strategy is determined by the time frame you set for trading. For example, when trading between 5 to 15 minutes, the appropriate thing to do will be to have a good forex exit strategy before the start of trading as time may not permit you to do that once you have started. But when trading for anywhere from 1 hour up to 4 hours, you then have enough time to fashion out your strategy.

Professional traders usually base their entry and exit strategies on the market analysis that had been done prior to the start of trading which they only need to follow as planned. In such analysis, forex entry strategy and exit strategy are normally equally well-considered in that they go hand in hand, and one is not to be treated as less important in any way. The practice of treating both entry and exit as important connotes balanced trade execution.

Some forex newbies make the mistake of thinking that once they have the perfect entry point, success is for sure. They soon get rude awakening that it is not all bread and butter; it is not that simple. Experience has shown that what is earlier thought to be a sure winner could turn out to be sure losers because only the entry point is put into consideration when making trading decisions, and no plan of action whatsoever was stipulated as to what the forex exit strategy would be. This lack of a forex exit strategy will not allow traders who make such mistakes get out of the market at the most appropriate time to ensure some level of profit. So, before you enter into the market, be sure to have your forex exit strategy at hand because you will surely need it as it is rather indispensable if you, as a trader, are to make any significant profits trading forex market in the long term.

About the Author

Warren Seah

What if you just couldn’t trade forex effectively with a day time job?

I know how hard it can be to trade forex manually, but if you want to really be successfully trading your own unique manual system, you need to learn a single method that works amazingly well.

This method is simple to pick up and it works like an automated trade exit tool. Yes, you can now select the forex exit strategy and the tool will manage your trade and exit with profit. You can read how to do it in my free report here: Stop Loss EA

Don’t give up hope, it’s NOT impossible. Forex Exit Strategy will expand your trading capabilities to greater trading success learn more by clicking the link.

The Simple Magic of Moving Averages

How Moving Averages Can Alert You to Future Price Expansions

By Elliott Wave International

To a first-time observer, watching a technical analyst spot a major trend change in a financial market before it occurs can seem as mystical as pulling a rabbit out of hat. But once you learn the tools of the trade, you know there are no tricks up the technical analyst’s sleeve. What you see, is exactly what you get.

On this, EWI’s Senior Commodities Analyst Jeffrey Kennedy speaks to one technical indicator in particular: moving averages. In Jeffrey’s own words:

“There is no magic in moving averages, the magic comes in finding something that you are comfortable with and applying it. I like it because it consistently works and you can customize it to your individual trading style and time frame.”

Jeffrey’s appreciation of the measure doesn’t end there. In his highly acclaimed Commodity Trader’s Classroom eBook, Jeffery expands on the many variations of MA analysis used to identify high probability trade set-ups. Among his favorites: the Moving Average Compression. The excerpt below is a direct quote from Jeffrey’s eBook:

“Moving Average Compression works so well in identifying trade set-ups because it represents periods of market contraction. As we know, because of the Wave Principle, after markets expand, they contract (when a five-wave move is complete, prices retrace a portion of this move in three waves.) MAC alerts you to those periods of price contraction. And since this state of price activity can’t be sustained, MAC is also the precursor to price expansion.

The Live Cattle chart above demonstrates three different simple moving averages based on Fibonacci numbers 13, 21 and 34. The point at which all of the moving averages become one and form a straight line is what Jeffrey refers to as Moving Average Compression. As you can see, the compression of the moving averages tells us that the market has contracted, and prompts the expansion shown in April and May 2004.”

FreeWeek is back!

You can get trading lessons (just like this one), daily video analysis and expert commodity picks — absolutely FREE!Now until noon Thursday, October 27, you can have complete access to EWI’s popular commodity service, Futures Junctures — only during FreeWeek.

Learn more about Futures Junctures and get complete access for a full week >>

This article was syndicated by Elliott Wave International and was originally published under the headline The Simple Magic of Moving Averages. EWI is the world’s largest market forecasting firm. Its staff of full-time analysts led by Chartered Market Technician Robert Prechter provides 24-hour-a-day market analysis to institutional and private investors around the world.

Uranium Stocks – Are They Going To Explode?

By MoneyMorning.com.au

Since the price peak in 2007, it’s been a hard few years for uranium investors.

Check out this uranium price chart:

Uranium Spot Price… And the Great Uranium Bubble of 2007

Uranium Spot Price... And the Great Uranium Bubble of 2007

Source: Cameco


The price peak is called the ‘Uranium Bubble of 2007′.

The bubble started as investors worried about a uranium shortage.

Back then the uranium supply was a problem… 180 million pounds (81,000 tonnes) were required for nuclear power. But only 108 million pounds were mined.

It was only because of the Russian ‘Megatons to Megawatts program’, where old Soviet nuclear warheads were converted into nuclear fuel, that there was enough uranium to meet the demand from nuclear reactors.

But the tight supply wasn’t enough to cause the 2007 price bubble. That was caused by something else.

Andrew Mickey, an investment analyst at Q1 Publishing, blames it on a disaster at uranium miner, Cameco’s [NYSE: CC] Cigar Lake mine…

Cigar Lake is the world’s largest undeveloped high-grade uranium deposit. But in the lead up to 2006, Cameco claimed Cigar Lake would supply 17% of the world’s uranium needs.

So it’s no surprise that what happened next caused the uranium price to take off…

As Mickey wrote in 2008:

‘The uranium bubble was set to deflate slowly. [But] the exact opposite happened. A retaining wall collapsed and the entire mine flooded. Cameco confirmed a single pound of uranium wouldn’t come out of Cigar Lake for at least five years. [So] the bubble grew even larger.’

With no supply from Cigar Lake, the uranium price reached ‘panic’ levels…

…Until the early days of the sub-prime crisis in 2007. That’s when the uranium price began to crash. So that today uranium is less than half the level it was in 2007.

But despite – or perhaps because of – the lower price, there are still supply and demand problems.

In fact, in its most recent commodity report the Australian Bureau of Agriculture and Resource Economics (ABARE) expects worldwide uranium consumption to rise 6% to 86,800 tonnes this year.

And with 72 nuclear reactors set to open by 2016, ABARE estimates more than 107,300 tonnes will be needed for fuel.

So, where will the supply come from?

There are two sources of uranium for the market. The main source is uranium mined from the ground.

The other source includes nuclear weapons. Amazingly, this market meets up to 30% of uranium demand!

However, the agreement with Russia for the ‘Megatons to Megawatts’ program is due to expire in 2013.

So if the program stops, the supply and demand gap for uranium will get worse.

Simply put, there’s not enough uranium to go around. And that could push the uranium price higher.

Dr. Alex Cowie, editor of Diggers & Drillers says, ‘…if uranium continues to creep up, then we may see the uranium sector finally turn a corner and start the next leg up.

‘We have seen the start of come corporate activity, which is another good sign for the sector. For instance, Korea Electric Power Corporation (Kepco) is the biggest power utility in South Korea, and operates dozens of nuclear plants.

‘A few months ago at the Fremantle Uranium Conference, Kepco announced it was looking for acquisitions so it’s good to see this happening. It has just done a deal with Strathmore Minerals [TSE: STM] to fund exploration of one of its uranium assets.’

As you can see, Alex is bullish on the uranium sector. He goes on:

‘Another deal involves global uranium leader, Cameco. It’s bidding for Canada-based Hathor Exploration [TSE: HAT].

‘These merger and acquisition deals should be a clear sign that the sector is alive and well.’

On Thursday Rio Tinto made a cash offer for Hathor of C$578m, 11% above Cameco’s unsolicited offer.

Large energy firms are trying to cash in on uranium deposits while the price is low. Simply because they understand their future energy needs and want to secure a uranium supply now.

This is good news for some Aussie stocks. Right now, Australia is the third largest miner of uranium… and it’s set to expand further.

Growth for the sector is tipped to be 15% per year until 2015. In fact, by then, Australia could produce 17,000 tonnes of uranium… which would be worth almost $3 billion to the Aussie economy.

This growth potential is why Alex is confident uranium is the perfect stock for risk-hungry investors. He says:

‘The charts for most uranium stocks may be ugly, but the fundamentals of the uranium market are strong.

‘There’s a huge opportunity for investors here with enough patience to stick around.’

Shae Smith
Editor, Money Weekend


Uranium Stocks – Are They Going To Explode?

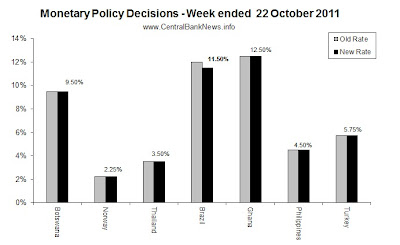
Monetary Policy Week in Review – 22 Oct 2011

The past week in monetary policy saw interest rate decisions announced by 7 central banks.  The only bank to announce a change to its main monetary policy  interest rate was the Banco Central do Brasil, which cut its interest rate by another 50 basis points to 11.50%.  Meanwhile the other central banks held their key interest rates unchanged: Botswana 9.50%, Norway 2.25%, Thailand 3.50%, Ghana 12.50%, Philippines 4.50%, and Turkey 5.75%.  A common theme mentioned by the central bankers was concern over signs of slowing global growth and the potential risks arising from the ongoing sovereign debt crisis in Europe.
Monetary Policy Week in Review


Some of the key quotes and soundbites from central bankers announcing monetary policy decisions during the past week are included below:

  • Banco Central do Brasil (cut rate -50bps to 11.50%): “Continuing the process of adjusting monetary conditions, the Committee decided unanimously to reduce the Selic rate to 11.50% pa, without bias.  The Monetary Policy Committee believes that the timely mitigate the effects coming from a more restrictive global environment, a moderate adjustment in the level of the base rate is consistent with the scenario of convergence of inflation to the target in 2012.”
  • Bank of Thailand (held rate at 3.50%): “The MPC deemed that the current level of the policy rate is appropriate in addressing upcoming inflationary pressure  and supporting economic adjustments amidst heightened uncertainty in the global economy. Meanwhile, with the floods not yet over, their impact on the economy was not fully evident.
  • Central Bank of Turkey (held rate at 5.75%): “Recent data releases suggest that there will be a notable reduction in economic growth in the second half of the year. External demand remains weak, and domestic demand continues to slow down. The deceleration in  credit growth and domestic demand combined with the exchange rate movements have been contributing to the rebalancing of domestic and external demand. Accordingly, the Committee expects a significant improvement in the current account balance in the forthcoming period.”
  • Norges Bank (held rate at 2.25%): “The Executive Board is of the view that the outlook and the balance of risks now suggest that the key policy rate should be kept at the current level for some time ahead. If the economic unrest abroad intensifies, money market premiums remain high and the outlook for growth and inflation weakens further, the key rate may be reduced. If financial market turbulence subsides and there are prospects of higher growth and inflation, the key rate may rise.”
  • Bank of Botswana (held rate at 9.50%): “While short-term price developments have resulted in inflation remaining above the objective range of 3 – 6 percent, the medium-term outlook for consumer prices is more encouraging. As a result, the Committee judged that maintaining the Bank Rate at the current level is consistent with inflation converging on the objective range in the medium term.”
  • Bank of Ghana (held rate at 12.50%): “Looking ahead, wage pressures, payment arrears and recent depreciation of the exchange rate have increased the upside risks to inflation. In the short-term, the impact of these underlying inflationary pressures on the economy remains contained. The Bank’s inflation forecasts  show that the end year target will be achieved.  Movements in the exchange rate remain consistent with the delivery of the Bank’s inflation target.”

Looking at the central bank calendar, next week will be reasonably busy in monetary policy with 9 central banks scheduled to review monetary policy settings.  Also on the radar is the ECB’s bank lending survey, due out on Wednesday (and of course the EU leaders are meeting this weekend to try and agree on a plan to stem contagion from the sovereign debt crisis).  The key announcements to watch will be Canada, India, Japan, and Russia.

  • ILS – Israel (Bank of Israel) expected to hold at 3.00% on the 24th of Oct
  • HUF – Hungary (Magyar Nemzeti Bank) expected to hold at 6.00% on the 25th of Oct
  • CAD – Canada (Bank of Canada) expected to hold at 1.00% on the 25th of Oct
  • INR – India (Reserve Bank of India) expected to hold at 8.25% on the 25th of Oct
  • JPY – Japan (Bank of Japan) expected to hold at 0-0.10% on the 27th of Oct
  • NZD – New Zealand (RBNZ) expected to hold at 2.50% on the 27th of Oct
  • SEK – Sweden (Riksbank) expected to raise 25bps from 2.00% on the 27th of Oct
  • COP – Colombia (Central Bank of Colombia) expected to hold at 4.50% on the 28th of Oct
  • RUB – Russia (Bank Rossii) expected to hold at 8.25% on the 28th of Oct

Forex Market Outlook 10/21/11

By Mike Conlon, ForexNews.com on Oct 21, 2011

The market has been range-bound headed into the weekend, but man, those ranges are pretty big! I was surprised as I thought we’d see the ranges tighten up but that hasn’t been the case. Yesterday, the markets made huge moves as various news trickled out regarding the Euro debt crisis.

It is times like these when I tend to be more cautious, as it is difficult to know when news may hit or what its impact may be. Yesterday, the markets were selling off as risk aversion picked up throughout the early US session, only to completely reverse after “news” came out that the size of the rescue plan is going to be in the magnitude of $1.3 Trillion, with a “T”. That is encouraging news for the market, as in this case more is better.

But, later that day, news came out that indeed EU leaders needed more time to unveil the plan and that this weekend’s Debt Summit would not produce the resolution but rather next Wednesday will be the day that it is revealed. While this was initially seen as further stall tactics, the market is willing to give them a few extra days. They are likely close to a deal, and just need the weekend to sell it to the other members.

Though this creates another set of problems, as any dissension in the ranks could put the markets on edge. It should be no surprise though that they moved the decision, falling back more in line with what Merkozy originally proposed and not the G-20 timeline.

There’s not a ton of economic data out this morning, with German IFO survey figures coming in better than expected and the UK posting better than expected public finances on lower borrowing.

The big news of the morning came from Canada, where CPI data came in slightly hotter than expected. Core CPI came in at 2.2% vs. an expected 2%, with the headline figure at 3.2% vs. 3.1%. The Loonie has strengthened as a result, also being buoyed higher by early risk appetite in the markets.

There is no further news on the docket for today, but there could be more “news” leaked out of the Euro debt debate so there could be volatility. Not to mention general risk aversion heading into the weekend.

**This just in: USD/JPY tanking here and making a new all-time low at 75.82! Japanese intervention talk is bound to pick up now as that 76 level was seen as the “line in the sand”. This could also be the function of USD weakness if they are more involved in the bailouts of Europe. Stay tuned to this development!

So the markets are definitely behaving crazily here, so it is always good to remember to use a hard stop and take shorter term trades. There’s no telling what may happen today or over the weekend, so I’m going to step aside and not try to be a hero over the weekend. The potential risks do not outweigh the possible rewards.

Regards,

Mike Conlon,
Senior Forex Mentor
www.forexnews.com

Pangolin’s Hay Says He Favors Malaysian Consumer Stocks

Oct. 21 (Bloomberg) — James Hay, principal and founder at Pangolin Investment Management, talks about his investment strategy for Malaysia and Indonesia stocks. Hay also discusses the impact of Thailand’s floods on the nation’s economy. He speaks from Kuala Lumpur with Rishaad Salamat on Bloomberg Television’s “On the Move Asia.” (Source: Bloomberg)

Chart: Intel’s (Nasdaq: INTC) Growth in Emerging Markets

Chart: Intel’s (Nasdaq: INTC) Growth in Emerging Markets

by Justin Dove, Investment U Research
Friday, October 21, 2011

Some people refer to the current state of technology as the “post-PC era.” The emergence of smartphones and tablets is supposed to eventually crush the PC market. But this chart, from TechInsidr blog, may lead one to believe that the rumors of the PC’s demise are greatly exaggerated.

According the author, Intel (Nasdaq: INTC) is not only surviving in the post-PC era, but is actually growing, mostly thanks to its growth in the Asia-Pacific region, Japan and Europe.

Intel Revenue by Geography

(Courtesy: TechInsidr.com)

Because Intel failed to gain traction in the area of smartphone and tablet chips, it leads one to conclude that PCs aren’t doing as badly as most claim.

“Emerging markets are good, enterprise is strong, the mature market consumer is a little bit weaker,” Intel CFO Stacy Smith told Reuters. “I’d say Europe was a little bit weaker than the U.S.”

Although some of Intel’s growth can be attributed to its high-margin enterprise and server chips, there’s additional evidence from IDC that the worldwide PC market is still on the uptrend thanks to the Asia-Pacific region.

PC Market on Uptrend per Asian Growth

As shown above, Asia-Pacific PC shipments are still increasing by double digits. And Lenovo (OTC: LNVGY.PK) continues to expand its giant lead in the Asia-Pacific region, which is probably one reason it recently surpassed Dell as the world’s No. 2 PC manufacturer.

Investors may want to rethink the idea that the PC is dead. The “post-PC era” doesn’t seem to be bothering all the PC players. As for Intel, someone has to help build chips for all the data centers used in cloud computing.

Good investing,

Justin Dove

Article by Investment U