U.S. Markets Remain Down

Source: ForexYard


Positive employment numbers helped the U.S. stock markets jump significantly during late Friday afternoon trading. Despite the gains, the credit rating downgrades of Spain and Italy put a damper on trading soon thereafter.

Many view this as a sign that no matter how good or bad the U.S. economy performs, the EU debt crisis remains the primary source of investor’s lack of confidence.

Furthermore, the downgrade of Spain and Italy’s credit rating further signaled the uncertainty in measures taken by the ECB and EU in recent weeks to alleviate the debt crisis.

Forex Market Analysis provided by ForexYard.

© 2006 by FxYard Ltd

Disclaimer: Trading Foreign Exchange carries a high level of risk and may not be suitable for all investors. There is a possibility that you could sustain a loss of all of your investment and therefore you should not invest money that you cannot afford to lose. You should be aware of all the risks associated with Foreign Exchange trading.

State Bank of Pakistan Cuts Rate 150bps to 12.00%

The State Bank of Pakistan unexpectedly slashed its discount rate 150 basis points to 12.00% from 13.50%.  The Bank said: “There is a decline in CPI inflation and government borrowing from SBP is lower than its end-June level. Led by consistent inflow of workers’ remittances the external current account position is comfortable though there has been some decline in SBP’s foreign exchange reserves. Importantly, concerns regarding  weak private sector credit growth and  falling real private investment expenditures remain along with a likelihood of rise in real interest rates.”

Pakistan’s central bank last cut the discount rate by 50 basis points to 13.50% at its July meeting.  Pakistan reported annual inflation of 10.46% in September, 11.56% in August, 13.77% in July, 13.92% in June this year, 13.23% in May, and 13.04% in April.  The Pakistani government announced an inflation target of 12 percent for fiscal 2012, with a desired path for inflation of 9.5% and 8% in the subsequent 2 years.  


Pakistan is aiming for 4.2% growth in fiscal 2012, compared to 2.4% in the previous year; one of the lowest rates of expansion in recent history for the nation, as it struggled to cope with the floods and terrorist attacks.  The IMF is forecasting real GDP growth of 2.6% in 2011, 3.8% in 2012, and an average 5% through 2016.  

The Pakistani Rupee (PKR) has depreciated about 2% against the US dollar so far this year, and the USDPKR exchange rate last traded around 87.4

www.CentralBankNews.info

Bank Holidays to Cause Low Market Liquidity

By ForexYard

US banks will be off today in observance of Columbus Day, and Canadian banks will be off for the celebration of Thanksgiving. Liquidity will likely be held to a minimum making the market unlikely to experience any major swings.

Economic News

USD – US Dollar Dips as Employment Data Supports Risk-Taking

The US dollar (USD) was seen trading mildly bearish Monday morning as traders saw a small decline in risk aversion following last week’s economic reports. The EUR/USD rose following the completion of a long-term consolidation trend, reaching a 4-day high. The GBP/USD saw somewhat higher gains, with the greenback inching the pair towards last week’s early high.

Employment reports from the US and Canada last week portrayed a global economy somewhat stronger than what many had expected. Non-Farm Payrolls (NFP) last Friday revealed a growing jobs market as businesses across the United States and Canada begin seasonal hiring for the holidays. Such reports are likely to drive the US dollar lower as risk aversion declines and traders begin seeking out higher yields.

With a very light news day ahead, traders appear anxious for the week’s data which seems to be centered mostly on housing reports. Today’s publications are severely limited, however, with most major banks on holiday. US banks will be off today in observance of Columbus Day, and Canadian banks will be off for the celebration of Thanksgiving. Liquidity will likely be held to a minimum making the market unlikely to experience any major swings.

EUR – EUR Bullish as Traders Seek Higher Yields

The euro (EUR) was seen trading with largely bullish results this morning following last week’s mildly optimistic assessments from North American employment reports. Against the US dollar (USD) the euro was trading near a 4-day high, with few signs of halting the bullishness which appears to come on the coattails of a long-term consolidation pattern. Against the Great British pound (GBP), the EUR witnessed a similar, albeit weaker, gain in strength.

Traders appear to be clinging stronger to the 17-nation common currency with higher yielding investments in mind. With employment rising in the North American continent, it seems likely that more traders will opt for higher yields heading into the 2011 holiday season. Should data continue to move in such a direction, it is far more likely that the EUR will see further gains.

Economic sentiment across the euro zone remains negative overall, however, with many analysts and economists expecting moves towards safety by traders as early as next week. With a light news day ahead, many traders are awaiting more data releases later in the week before buying up further EUR. With today’s low liquidity, not much movement is expected, though random central bank statements could roil markets at any time.

Silver – Silver Price Continuing in Bullish Channel

The price of Silver found modest support over the weekend amid the surging strength of the US dollar, the currency in which such assets are valued. Silver has been trading with stronger price action since early August, but traders have been awaiting a price correction from the rampant increase in risk aversion due to rising tensions from the euro zone’s periphery and a sudden lift off in dollar values.

As investors seek safety, the value of Silver, which has been seen trading with mixed results since two weeks ago, is expected to rise following its current bullish channel, bouncing off a recent low near $39.40 an ounce after a selloff in commodity futures pulled down on precious metals last week. A sudden rise in dollar values due to this week’s uncertain environment is expected to assist the sentiment favoring Silver, however. Should risk sentiment continue to bounce in sporadic directions this week, the price for this precious metal may continue to experience similar swings in value, favoring an upside as Silver holds within its bullish pattern.

Technical News

EUR/USD

According to the Relative Strength Index on the 8-hour chart, this pair may see a downward correction in trading today. This theory is supported by the Stochastic Slow on the daily chart, which shows a bearish cross forming. Traders may want to go short in their positions today.

GBP/USD

Both the Relative Strength Index and Stochastic Slow on the 8-hour chart indicate that this pair is approaching overbought territory. This may be a sign that the cross could see a downward correction in the near future. Traders may want to go short in their positions today.

USD/JPY

This pair has been range trading for some time, and appears poised to continue that trend today. Most technical indicators are currently in neutral territory, indicating that no major movement is predicted in the immediate future. Traders may want to take a wait and see approach today.

USD/CHF

While certain indicators, such as the MACD on the daily chart, are showing that this pair is in overbought territory, most signs indicate that the pair is range trading and that no major movements are predicted in the immediate future. Traders may want to take a wait and see approach today.

The Wild Card

AUD/CAD

After spiking yesterday, this pair seems poised for a downward correction today. The Relative Strength Index on the 8-hour chart has entered overbought territory while the Stochastic Slow on the daily chart has formed a bearish cross. Forex traders may want to short their positions today.

Forex Market Analysis provided by ForexYard.

© 2006 by FxYard Ltd

Disclaimer: Trading Foreign Exchange carries a high level of risk and may not be suitable for all investors. There is a possibility that you could sustain a loss of all of your investment and therefore you should not invest money that you cannot afford to lose. You should be aware of all the risks associated with Foreign Exchange trading.

Queensland Housing’s 100-Year Slump

By MoneyMorning.com.au

If you own a home or investment property… or are thinking of buying either in Queensland, today’s Money Morning will make you think twice.

After spending a week holidaying on the Gold Coast we’ve come to the conclusion that Queensland house prices could fall and stay low for up to 100 years!

It’s a big claim. But we’ll explain all in a moment. First…

You might think the Queensland sun has damaged your editor’s mental capacity. And after catching up on the news from the past 10 days, we’re having doubts too.

Because this morning we agree with something written by Michael Pascoe in yesterday’s Age:

“Just when we were getting used to the ‘$X billion wiped off shares’ stories, along came a week that wiped $90 billion back on, but neither headline is particularly healthy.”

We even pretty much agree with his final comment:

“Let the traders worry about stocks bouncing around, I’m happy for my super fund to keep accumulating shares in solid companies as cheaply as possible for as long as possible. Never mind the gyrations, see the opportunities.”

As we say, maybe it’s the Queensland sun.

But Pascoe is close to spot on. Capital growth investing is no longer the realm of investors. It’s for traders who punt on short-term capital growth… and punters who bet on high-risk, high-growth small-cap stock plays.

If you’re an investor (someone buying for the long term who doesn’t want to sell) there’s only one stock type you should invest in… and that’s dividend-paying stocks.

That means buying shares in “solid” companies that are likely to keep racking up profits. And if the share price doesn’t do much, so what, you’ll still collect the dividend.

The capital growth stuff is for the punter who wants to make small short-term profits trading blue-chip stocks… or big medium- to long-term profits from small-cap stocks.

And as it turns out, the same approach should be used for the property market too. Forget capital growth. Housing investors need to realise that income is now more important…

The Northern Housing Glut

This brings us back to our Queensland observation.

If you’re a property investor who’s invested hoping for quick gains, you should act now to switch to an income-focused property portfolio… before it’s too late.

On the bus ride as we took the kids out to the theme parks, we went past some pretty swanky houses… lots of “marvellous water views”. Plenty of jetties… boats of all sizes.

Trouble is, after later reading through the local papers and property brochures it seems there are more swanky houses for sale than the market can ever absorb.

They were built on the promise that house prices always go up and there would always be demand for houses close to water. And the bigger the house and the closer it is to the water… the bigger the profit.

But now the Queensland property market is seeing what happens when a bubble pops. Contrary to popular opinion, prices don’t plateau at a high point waiting for wages growth to catch up. Prices fall.

The latest numbers from RPData show that. In Brisbane prices have declined 6.1% over the past year. And don’t forget, by then prices had already started to drop.

On the Gold Coast things are even worse…

The Benefit of Losses

Several of the estate agents we walked past made vendor losses a selling point. One told passers-by the vendor had paid $640,000 for an ocean-view apartment and was now selling for $420,000. (Although we dare say if anyone puts in an offer of $400,000 the vendor will take it).

Although we’re not sure what that marketing strategy does for the confidence of the buyer. But that’s their problem.

Interestingly, in its latest press release RPData makes a big point of looking at housing income returns:

“If you let your house, you receive rents in dollar terms. If you own your home, you save the market rent. This is the same as a business owning and occupying a building (it similarly saves on rental payments). The higher the market rent, the greater the saving (or ‘imputed rent’).”

Of course, while the home owner may save by not paying rent, they lose out on mortgage repayments. So adding imputed rent doesn’t give an accurate figure. Still, RPData says if you take into account rents, Brisbane prices are only down 1.6% over the past year.

That won’t be much comfort for the mega-mortgaged buyers who have seen prices fall at least 6.1% and then suffered another 6% or so loss on interest payments. But at least they’ve saved by not renting!

The bad news for Queensland is things are set to get worse. You see, Queensland has a bigger problem than other states. It has what you might call an “itinerant crisis”… migrants and investors who flocked to Queensland for sun… and profits.

Both caused property prices to rise and created a huge building boom.

The only problem is: easy come, easy go.

Let’s be honest, aside from resources and tourism, Queensland doesn’t have much of an economy. So when the proverbial hits Australia, Queensland is likely to suffer the most.

And because the population is full of migrants, there’s not much to keep them from moving on. Or worse, there’s not much to attract migrants in the first place.

That’s why property investors need to sort their portfolios out quickly. And not just Queensland investors. The whole of Australia is at risk of an “itinerant crisis”… as those who flocked here for the money and sun lose interest…

30-Year Boom Followed by 100-Year Slump

So the old tactic of borrowing as much as possible to make big capital gains won’t work.

Property portfolios need to be re-aligned for income. That means deleveraging – selling properties before prices drop further.

But even those investors won’t get off scot-free. Because the Aussie housing re-alignment will take years. In fact, given the size of the boom and over-investment in the Aussie housing market, we wouldn’t be surprised if Queensland house prices fell and stayed low for 30, 50 or even 100 years!

Such is the extent of the housing over-supply and an economy that has benefited from a resources boom that is set to end.

Yes. We’re afraid to say it. While Australia has sat pretty and basked in the sun of the resources boom, it has made the mistake of thinking it can last forever. And that has caused the economy to become lopsided and reliant on a single source of income.

Unfortunately, most Australians don’t realise it yet. They’re told the problems with the global economy are a “European thing” or an “American thing”… and that Australia will be fine.

It won’t. The slump in the resources states of Queensland and Western Australia is simply the beginning. The good news is, it’s not too late to do something about it… to protect the wealth you’ve built and prevent the losses you’ll make if you don’t act.

We’ll have more on this in the coming weeks.

Cheers.
Kris.

PS. While we were away, Slipstream Trader Murray Dawes filmed a short personal video outlining his trading approach to the markets. If you haven’t seen it yet, click here to go to the Slipstream Trader YouTube channel.


Queensland Housing’s 100-Year Slump

Take-Over Targets and Treasure Hunters

By MoneyMorning.com.au

If you invest in a big miner, like Rio Tinto or BHP, it already has rising prices, commodity shortages and ‘growing demand’ priced in. Their shares are down 23 per cent and 18 per cent this year. So far.

Commodities like tin, copper and uranium, have dropped 27 per cent, 35 per cent and 23 per cent this year too… Even though they’re still in short supply and high demand.

So how do you make money out of resources? Everything seems overpriced! You look for take-over targets and treasure hunters. Small-cap explorers that give you the chance to cash in on high commodity prices even if they’ve peaked.

Here’s why…

COPPER PRICE (DECEMBER 2008 – OCTOBER 2011) UP 166%

COPPER PRICE (DECEMBER 2008 - OCTOBER 2011) UP 166%
Click here to enlarge

Rio Tinto is the fourth largest copper producer in the world. It pumps out 800 million tonnes of copper a year… And if you bought Rio shares in November 2008, you’d have gained today about 16%. Even though the copper price jumped 166%!

Why? Because the market had already priced in the resource and demand.

But then there are treasure hunters. Companies that start out with nothing and trade for mere cents. They have nothing ‘priced in’ by the market. Because all they have is a patch of land and a drill.

Ventnor Resources, a rag-tag explorer, bought a dirt patch next door to Sandfire Resources proven copper reserve. It drilled a hole. Found something. And the share price sky-rocketed 226%…

Ventnor Resources (ASX:VRX) – A True Treasure Hunter

Ventnor Resources (ASX:VRX) - A True Treasure Hunter
Click here to enlarge

Source: Google Finance


And there are take-over targets…

Equinox Minerals was Australia’s largest copper producer. It got two take-over bids in April… $6.3 billion from Minmetals. And $7.69 billion from Barrick Gold. And its share price nearly doubled from $4.85 to $8.80 (an 81 per cent gain).

Equinox Minerals – Take-Over Target

Equinox Minerals - Take-Over Target

Source: Google Finance

The trick is finding these sorts of companies before they take off. If you’d like to know how to do that, we’ll show you how later this week.

Aaron Tyrrell
Editor, Money Morning

Related Articles

Three Gold Bubble Signals You Should Ignore

Manipulation on a Grand Scale

The Madness of Mad Men

Three Steps to Wealth: Leverage, Volatility and Risk

What China’s Secret Gold Cache Means for Aussie Gold Stocks

From the Archives…

What Debt Crisis?
2011-10-07 – Greg Canavan

Enjoy the Rally, It Won’t Last for Long
2011-10-06 – Greg Canavan

Why the Fed’s Actions Make Perfect Sense
2011-10-05 – Murray Dawes

Too Big to Bail
2011-10-04 – Murray Dawes

What Can We Expect Next From Commodities?
2011-10-03 – Dr. Alex Cowie

For editorial enquiries and feedback, email [email protected]


Take-Over Targets and Treasure Hunters

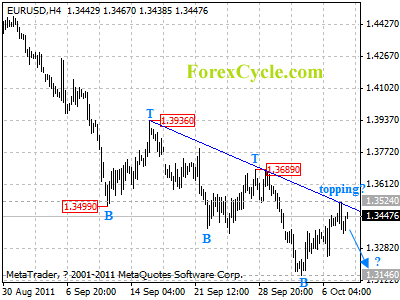
EURUSD pulled back from downtrend line

Being contained by the resistance of the downtrend line on 4-hour chart, EURUSD pulled back from 1.3524, suggesting that a cycle top is being formed. Now the fall from 1.3524 would possibly be resumption of downtrend from 1.4548, deeper decline towards 1.3146 is expected later today. On the upside, a clear break above the trend line will indicate that lengthier consolidation of downtrend is underway, then further rally could be seen to 1.3700 zone.

eurusd

Daily Forex Forecast

Weekly Forex Market Outlook (October 10-14)

Fundamental Forex Market Outlook for the Upcoming Week

The key fundamental economic events that can strongly influence the forex market this week feature the U.S, Canadian and Chinese Trade Balance data due out on Thursday, and the G20 Meetings which are scheduled for Friday and Saturday. Additional key economic releases due out this week are detailed further below, with the current market consensus expectations or the last result included in parenthesis whenever available.

Monday will be a Bank Holiday in the United States, Canada and Japan, and the day’s major economic data features ANZ Job Advertisements (last -0.6%). Tuesday’s key economic events include a speech by ECB President Trichet, UK Manufacturing Production (-0.1%) and Canadian Housing Starts (187K).

On Wednesday, the market will closely monitor Aussie Home Loans (1.1%), the UK Claimant Count Change (24.4K), and the FOMC’s Meeting Minutes.

Thursday will see the release of the Aussie Employment Report that includes the Employment Change (10.1K) and Unemployment Rate (5.3%), as well as the Chinese Trade Balance (17.1B), Canadian Trade Balance (-0.9B), the U.S. Trade Balance (-46.2B) and the closely watched U.S. Weekly Initial Jobless Claims (407K) data.

Friday’s schedule features Chinese CPI (6.1%), the first day of the G20 Meetings, U.S. Core Retail Sales (0.2%) and Retail Sales (0.5%), as well as the Preliminary University of Michigan Consumer Sentiment survey (60.2). Saturday will conclude the week with the final day of the G20 Meetings and the expected release of its latest communiqué.

Technical Forex Market Outlook for the Upcoming Week

EUR/USD:

Weekly Forecast: Higher

Resistance: 1.3450, 1.3494, 1.3520/24, 1.3566, 1.3586, 1.3689, 1.3720, 1.3743, 1.3796, 1.3936, 1.3972, 1.4103, 1.4147, 1.4258, 1.4279, 1.4327 and 1.4499/1.4503.
Support: 1.3384, .13362, 1.3333, 1.3241/44, 1.3145, 1.3055, 1.3000, 1.2968, 1.2873, 1.2733, 1.2643 and 1.2586.

200-day MA: 1.4056 and slowly rising.

14-day RSI: 38.3 and rising.

eurusd - forex chart

USD/JPY:

Weekly Forecast: Somewhat higher

Resistance: 76.88/77.06, 77.19/37, 77.71, 77.85, 78.02, 78.66, 79.05, 79.40, 80.00, 80.22, 80.82, 81.34, 81.76, 82.01/22, 82.77, 83.09 and 83.77.

Support: 76.50/69, 76.32, 76.25, 76.14, 76.10, 75.94, 75.00 and 70.00.

200-day MA: 80.31 and falling.

14-day RSI: 50.0 and flat.

GBP/USD:

Weekly Forecast: Higher

Resistance: 1.5632, 1.5644, 1.5664, 1.5685, 1.5705, 1.5714, 1.5745, 1.5839, 1.5867, 1.5883, 1.5912/19, 1.5951, 1.6000, 1.6037, 1.6081, 1.6130, 1.6204/06, 1.6252/59, 1.6332/47, 1.6434/52 and 1.6500/98.

Support: 1.5525/31, 1.5483, 1.5422, 1.5373, 1.5339/55, 1.5326, 1.5293, 1.5270, 1.5123, 1.5000, 1.4947, 1.4872, 1.4785/97, 1.4500, 1.4474, 1.4345 and 1.4229.

200-day MA: 1.6128 and flat.

14-day RSI: 42.0 and rising.

british pound sterling us dollar chart

USD/CHF:

Weekly Forecast: Lower

Resistance: 0.9277, 0.9294, 0.9300, 0.9313, 0.9327, 0.9339, 0.9368, 0.9774/83, 0.9971, 0.9997, 1.0000 and 1.0065.

Support: 0.9141/60, 0.9020, 0.9000, 0.8994, 0.8979, 0.8916/26, 0.8883, 0.8873, 0.8797, 0.8788, 0.8728, 0.8646, 0.8622, 0.8536, 0.8239 and 0.8000.

200-day MA: 0.8787 and falling mildly.

14-day RSI: 71.5 overbought and flat.

us dollar swiss franc forex chart

AUD/USD:

Weekly Forecast: Higher

Resistance: 0.9842/76, 0.9953, 0.9984, 1.0000, 1.0077, 1.0146, 1.0176, 1.0296, 1.0310, 1.0347, 1.0360, 1.0373/96, 1.0473, 1.0481, 1.0511, 1.0564/70, 1.0599, 1.0624, 1.0633, 1.0659, 1.0683/93, 1.0718/26, 1.0763, 1.0784, 1.0909, 1.1000/15, and 1.1064/79.

Support: 0.9732, 0.9689, 0.9667, 0.9651, 0.9620/27, 0.9536/41, 0.9500, 0.9462, 0.9386, 0.9330, 0.9220, 0.9077, 0.9000, 0.8870, 0.8858, 0.8632, 0.8550 and 0.8066/81.

200-day MA: 1.0376 and falling mildly.

14-day RSI: 39.7 and rising.

australian dollar usd forex chart

USD/CAD:

Weekly Forecast: Lower

Resistance: 1.0417, 1.0481/90, 1.0500, 1.0506, 1.0646/56, 1.0669, 1.0742, 1.0756, 1.0785, 1.0853, 1.0868, 1.1000 and 1.1101/23.

Support: 1.0322, 1.0255, 1.0233/36, 1.0208, 1.0139, 1.0088, 1.0057, 1.0030, 1.0008, 0.9939/1.0030, 0.9828/77, 0.9763/96, 0.9734/39, 0.9724, 0.9686, 0.9645, 0.9567, 0.9526, 0.9496, 0.9448/56, 0.9422, 0.9405/09, 0.9056 and 0.9000.

200-day MA: 0.9793 and rising mildly.

14-day RSI: 63.2 and falling.

canadian dollar us dollar forex chart

NZD/USD:

Weekly Forecast: Higher

Resistance: 0.7716, 0.7750/54, 0.7795, 0.7816, 0.7851, 0.7892, 0.7950/62, 0.8000/44, 0.8060/93, 0.8109/19, 0.8126/40, 0.8150/90, 0.8269/78, 0.8327/39, 0.8365/86, 0.8423, 0.8469/72, 0.8500, 0.8534/75, 0.8676, 0.8764, 0.8793 and 0.8841.

Support: 0.7672, 0.7626/35, 0.7605, 0.7549, 0.7523, 0.7504, 0.7500, 0.7453/67, 0.7426, 0.7404, 0.7342, 0.7321, 0.7189, 0.7115, 0.7000 and 0.6945/62.

200-day MA: 0.7955 and flat.

14-day RSI: 37.0 and rising.

new zealand kiwi us dollar forex chart

Get this report to your email by signing up for our newsletter!

Forex: Currency Speculators trim Dollar longs. Euro, Pound short positions rise

By CountingPips.com

The latest Commitments of Traders (COT) report, released on Friday by the Commodity Futures Trading Commission (CFTC), showed that large futures speculators remained bullish in favor of the US dollar against the euro and British pound while trimming dollar longs against some of the other major currencies. Non-commercial futures traders, usually hedge funds and large speculators, decreased their total US dollar long positions to $13.77 billion on October 4th from a total long position of $14.38 billion on September 27th, according to the CFTC COT data and calculations by Reuters which calculates the dollar positions against the euro, British pound, Japanese yen, Australian dollar, Canadian dollar and the Swiss franc.


EuroFX: Currency speculators slightly decreased their futures positions for the euro against the U.S. dollar for a seventh consecutive week. Euro positions declined as of October 4th to a total of 82,697 net short contracts from the previous week’s total of 82,473 net short contracts reported on September 27th. Euro positions are at their lowest point since June 8, 2010 when net contracts were on the short side at -111,945. The decline in the pace of the changes last week could perhaps indicate a short-term bottom for euro positions.


The COT report is published every Friday by the Commodity Futures Trading Commission (CFTC) and shows futures positions as of the previous Tuesday. It can be a useful tool for traders to gauge investor sentiment and to look for potential changes in the direction of a currency or commodity. Each currency contract is a quote for that currency directly against the U.S. dollar, where as a net short amount of contracts means that more speculators are betting that currency to fall against the dollar and net long position expect that currency to rise versus the dollar. The graphs overlay the forex spot closing price of each Tuesday when COT trader positions are reported for each corresponding spot currency pair.

GBP: British pound sterling positions declined lower for the sixth consecutive week to stand at the lowest level since June 2010. Pound positions decreased to a total of 68,724 short positions on October 4th following a total of 64,010 short positions as of September 27th.


JPY: The Japanese yen net contracts edged slightly higher, according to data on October 4th. Yen net long positions rose to a total of 43,462 net long contracts reported on October 4th following a total of 42,322 net long contracts that were reported on September 27th.


CHF: Swiss franc long positions declined for a sixth straight week and fell over to the short side against the US dollar for the first time since July of 2010. Speculators cut bets for the Swiss currency futures to a total of 1,109 net short contracts following a total of 2,424 net long contracts as of September 27th. The Swiss currency, usually a popular safe haven currency, has seen very little movement since the Swiss National Bank enacted a policy to fight the strength of the franc and maintain a peg against the euro at the 1.20 level.


CAD: Canadian dollar positions slightly rebounded off of the lowest bearish level of the year from the previous week. CAD net contracts rose to a total of 15,682 short contracts as of October 4th following a drop to a total of 20,550 short contracts reported on September 27th.


AUD: The Australian dollar long positions rebounded as of October 4th after declining sharply for three straight weeks. AUD futures positions rose to a total net amount of 12,911 long contracts following a total of 5,167 net long contracts reported as of September 27th. The September 27th level had marked the lowest level for Aussie positions since July of 2010.


NZD: New Zealand dollar futures positions fell for a third consecutive week and declined to the lowest level since the middle of April, according to the data reported on October 4th. NZD contracts decreased lower to a total of 5,566 net long contracts following a total of 9,591 net long contracts registered on September 27th.


MXN: Mexican peso contracts continued their decline and decreased for the ninth straight week to remain on a bearish path against the dollar. Peso positions declined to a total of 25,431 net short speculative positions as of October 4th following a total of 20,626 short contracts that were reported as of September 27th.

COT Data Summary as of October 4, 2011
Large Speculators Net Positions vs. the US Dollar

EUR -82697
GBP -68724
JPY +43462
CHF -1109
CAD -15682
AUD +12911
NZD +5566
MXN -25431


How to create a MT4 Trailing Stop EA

By Warren Seah

The launch of the MT4 platform for forex trading has made trading so much easier and accurate. Because of the MT4 trading platform and its accompanying MT4 Expert Advisor function, a trader’s job is made much easier as certain trading procedures can now be automated with mechanisms like MT4 EA. The degree of trading system flexibility has now risen as the mq4 language of MT4 can be used fashion out additional automated strategies. The consequence of this is that a trader would have time for other tasks like finding better trading strategies instead of just observing the market all of the time.

A number of advantages are attached to having one’s own MT4 trailing-stop EA. It helps to automate most of the tasks that would, otherwise, have been done manually. MT4 trailing stop EA assists a forex trader in the perfect execution of his trading strategy, and makes it possible for a trader to verify the workability of his trading strategy by doing back-testing against historical charts. It also helps him to think rationally when making trading decisions rather than to rely on emotions for decision making. There are more advantages of MT4 trailing-stop than the ones stipulated earlier. The MT4 Expert Advisor puts a trader in a position where he would be able to learn the essentials and develop appropriate trading strategies fitting for automation purposes.

When it comes to discussions about forex trade management and exit strategies, most retail traders do not take long to lose interest in such discussions. This is how MT4 expert advisors comes into the picture to solve the problems through automation. But a trader would still need to put in a minimal effort to fashion out his MT4 stop loss EA that would take care of all other things; entering and exiting forex trades at appropriate times. It would, however, cost some money to create the MT4 EA if the trader does not have any knowledge of programming. But MT4 stop loss is well worth paying for because of its usefulness. As some people would say, you have to invest a little money to make more money.

Traders’ communities provide another cheaper means of putting together a trade management EA. From these online communities, a trader can get expert views that they could use to put together a viable MT4 trailing-stop EA. Through these communities, retail traders would find it pretty easy to have their own MT4 trailing-stop EA developed and also make a little money by sharing with other traders in the community. You can easily learn from the experience of traders who are using stop loss in their forex strategy and seek their opinion on which exit strategy is best to use in the current market.

About the Author

Warren Seah

What if you just couldn’t trade forex effectively with a day time job?

I know how hard it can be to trade forex manually, but if you want to really be successfully trading your own unique manual system, you need to learn a single method that works amazingly well.

This method is simple to pick up and it works like an automated trade exit tool. Yes, you can now select the forex exit strategy and the tool will manage your trade and exit with profit. You can read how to do it in my free report here: Trailing Stop

Don’t give up hope, it’s NOT impossible. Mt4 Trailing Stop will expand your trading capabilities to greater trading success learn more by clicking the link.

Monetary Policy Week in Review – 8 October 2011

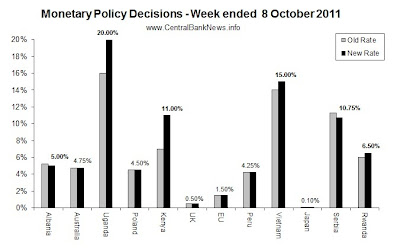
The past week in monetary policy saw 12 central banks reviewing monetary policy settings, with 6 adjusting interest rates. Those that changed interest rates were: Albania -25bps to 5.00%, Uganda +400bps to 20.00%, Kenya +400bps to 11.00%, Vietnam +100bps to 15.00%, Serbia -50bps to 10.75%, and Rwanda +50bps to 6.50%. Those that held rates unchanged were: Australia 4.75%, Poland 4.50%, UK 0.50%, EU 1.50%, Peru 4.25%, and Japan 0.10%. Also making news in monetary policy was the announcement from the Bank of England that it would add a further GBP 75 billion to its Asset Purchase Program (quantitative easing). Similarly the ECB announced a set of liquidity and asset buying measures in its monetary policy announcement.

Monetary Policy Week in Review

So it was a reasonably eventful week; of those cutting rates, it was basically countries with a close connection to the Eurozone; which is under severe pressure due to the sovereign debt crisis and rising risks of recession. Meanwhile those hiking rates were basically emerging African (and Asian) economies, which are relatively less connected to the EU quagmire and more exposed to the impact of still relatively high commodity prices and still strong domestic demand. Elsewhere the decision to stay put or implement other measures was driven by uncertainty surrounding global financial market volatility and economic outlook uncertainty.


Following are some of the key quotes of the week from the monetary policy setters:

  • Bank of England (held rate at 0.50%, expanded asset purchase program GBP 75B): “The pace of global expansion has slackened, especially in the United Kingdom’s main export markets. Vulnerabilities associated with the indebtedness of some euro-area sovereigns and banks have resulted in severe strains in bank funding markets and financial markets more generally. These tensions in the world economy threaten the UK recovery.”
  • Central Bank of Kenya (increased rate 400bps to 11.00%): The CBK “will revise the CBR further if inflation and exchange rate volatility do not abate.” also noting: “inflationary pressure has continued to increase and both the weakening of the shilling and its volatility poses additional threats.”
  • Bank of Uganda (increased rate 400bps to 20.00%): “This should be seen as a clear signal to bring inflation under control,” signalling a hard-line against Uganda’s double digit inflation; “However, should the upside risk to inflation continue in the months ahead, then monetary policy will be tightened further.”
  • National Bank of Serbia (dropped rate -50bps to 10.75%): “The Executive Board expects that inflation will continue to decline and that it will enter the target tolerance band in the first half of the next year. The future path of the key policy rate will depend on the achievement of projected inflation, and on the materialisation of risks, primarily those stemming from the international environment and fiscal policy at home.”
  • National Bank of Rwanda (increased rate 50bps to 6.50%): “the real economic growth in Rwanda is likely to exceed the 7 percent initially projected for the year 2011.  It is expected to reach 8.8 percent whereas the inflation forecast is at 8.2 percent by end December 2011.  Considering these projections, the Central Bank finds it appropriate to review its policy rate in order to keep the monetary aggregates at optimal levels to limit inflation pressures while continuing to support economic growth.”
  • Bank of Albania (dropped rate -25bps to 5.00%): “This serves the achievement of the inflation’s objective in middle-term periods and at the same time it offers the necessary monetary conditions to stimulate economic activities in the country. I believe that this measure will be transmitted at the defined level,”
  • Bank of Japan (held rate at 0-0.10%): “Japan’s economic activity has continued picking up.  Production and exports have continued to increase, although their paces have moderated after going through the recovery phase immediately following the quake-induced plunge… business fixed investment has been increasing moderately, and private consumption has been picking up on the whole.”  


Looking at the central bank calendar, next week is set to be a relatively quieter week with just 3 banks scheduled to meet. Also keep an eye out for the US FOMC (Federal Open Market Committee) meeting minutes from its 20 September meeting, likewise the Bank of Japan will also be releasing monetary policy meeting minutes this week.

  • IDR – Indonesia (Bank Indonesia) expected to hold at  on the 11th of Oct
  • KRW – South Korea (Bank of Korea) expected to hold at  on the 13th of Oct
  • MXN – Mexico (Banco de Mexico) expected to hold at on the 14th of Oct