PepsiCo Rises on Third-Quarter Earnings

PepsiCo Rises on Third-Quarter Earnings

by Jason Jenkins, Investment U Research
Friday, October 14, 2011

PepsiCo Inc.’s (NYSE: PEP) third-quarter profit rose four percent due to higher prices and rising sales of its snacks and beverages – especially overseas.

Wall Street seemingly approves of the third-quarter EPS and revenue numbers, which came in above analyst predictions. Here are the highlights that made everyone so giddy:

  • The company reported Wednesday that it earned $2 billion, or $1.25 per share, for the period ended September 3. That’s up from $1.92 billion, or $1.19 per share, a year ago.
  • Earnings were $1.31 per share. Analysts surveyed by FactSet expected $1.30 per share.
  • PepsiCo’s stock added $0.55 to $61.50 in premarket trading.
  • Revenue climbed 13 percent to $17.58 billion. That topped analyst expectations for $17.11 billion in revenue.
  • For the past five quarters, net income has increased 1.7 percent on average year over year.
  • PepsiCo has averaged revenue growth of 26.2 percent over the past five quarters.

The Current Climate for Multinationals

PepsiCo, like many multinational stocks, was recently trying to find the right mix during this period of global economic uncertainty. It found its recipe for success in this international economic environment by raising prices and promoting growth in emerging markets.

Many other multinational consumer brands – including McDonald’s (NYSE: MCD) and Nike, Inc. (NYSE: NKE) – increased prices in an attempt to offset their rising costs for ingredients, packaging and transportation. Also, to a larger degree, multinationals are reliant on emerging markets to bolster performance. Domestic consumption was stagnant due to the current U.S. economy coupled with a 9.1-percent unemployment rate.

Global Markets Crucial to 3Q Numbers

PepsiCo European markets reported a 37-percent revenue increase due to higher prices and the addition of Russian juice and dairy company Wimm-Bill-Dann. The combination of revenue for Asia, the Middle East and Africa rose 25 percent on increased prices and volume growth stemming particularly from emerging markets.

The Latin America Foods division, led by Brazil and Mexico, posted a 19-percent increase in revenue. Overall, global snacks volume increased by eight percent and worldwide beverage volume climbed four percent. As stated in its release, PepsiCo’s volume gains were driven by growth in emerging markets. For the full year, PepsiCo maintained its forecast for high single-digit earnings growth.

Investor’s Take

PepsiCo is definitely taking advantage of global demand from emerging economies, racking up annual revenue growth of about 24 percent in those same markets.

And with no clear view of how this market is going to work out, what you should be looking for is a formula to reduce risk – gaining the best possible return for the lowest amount of risk. PepsiCo has raised dividends 39 years in a row and its stock yields 3.4 percent.

The combination of international growth and dividend income could make Pepsi a solid play in this environment.

Good investing,

Jason Jenkins

Article by Investment U
Monetary Policy Week in Review – 15 October 2011

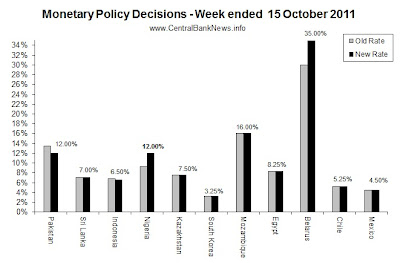
The past week in monetary policy featured monetary policy decisions from 12 central banks around the world.  Those that increased interest rates were: Nigeria +275bps to 12.00% and Belarus +500bps to 35.00%.  Meanwhile those that reduced interest rates were: Pakistan -150bps to 12.00%, and Indonesia -25bps to 6.50%.  Those that held interest rates unchanged included: Sri Lanka 7.00%, Kazakhstan 7.50%, South Korea 3.25%, Mozambique 16.00%, Egypt 8.25%, Chile 5.25%, and Mexico 4.50%.  The Monetary Authority of Singapore also eased monetary policy settings, noting that it would continue with a policy of modest and gradual appreciation of its currency.

Monetary Policy Week in Review


Following are some of the key quotes from the central banks that meet over the past week:

  • Central Bank of Nigeria (increased rate +275bps to 12.00%): The global economic horizon remains highly uncertain, with the signs getting more ominous as policy makers find it increasingly difficult to take the necessary economic decisions that may avert a new wave of  recession.”
  • Bank Indonesia (cut interest rate -25bps o 6.50%): “We are bringing the policy rate to a level that is more reasonable,” further noting “we saw the 6.75 percent rate as too high, unless we estimated inflation next year to be very high.”
  • Bank of Korea (held rate at 3.25%): “Based on currently available information, the Committee considers that, while emerging market economies have shown favorable performances, major advanced economies have exhibited signs of sluggishness. Going forward the Committee forecasts that the global economy will show a recovery, albeit a moderate one; nevertheless, the Committee judges that downside risks to growth have expanded.”
  • Monetary Authority of Singapore (eased policy): “Given the stresses and fragility in the advanced economies, the prospects for growth in Singapore’s major trading partners have deteriorated.  With the slowdown in demand, growth in the Singapore economy could fall below its potential rate of 3-5%.  Thus, core inflation should ease next year, although headline inflation could stay elevated in the near term reflecting the higher imputed rental cost of owner-occupied housing.
  • National Bank of Belarus (increased rate +500bps to 35%): “The move is next step in the consistent implementation of the general economic policy of the National Bank and the Government aimed at macroeconomic stabilization, reducing the pressure on the Belarusian ruble exchange rate and reducing inflation.  The National Bank jointly with the Government of the Republic of Belarus will continue the adoption of stabilization measures in the light of internal and external economic developments.”
  • State Bank of Pakistan (cut rate -150bps to 12.00%): “There is a decline in CPI inflation and government borrowing from SBP is lower than its end-June level. Led by consistent inflow of workers’ remittances the external current account position is comfortable though there has been some decline in SBP’s foreign exchange reserves. Importantly, concerns regarding  weak private sector credit growth and  falling real private investment expenditures remain along with a likelihood of rise in real interest rates.”


Looking at the central bank calendar, next week will see more emerging market central bank action, with the main event looking to be Brazil – last month Brazil unexpectedly cut interest rates, so the market will be watching that decision closely.  Other than policy meetings there’s also the Reserve Bank of Australia’s October meeting minutes, Ben Bernanke speaks in Boston, the US Fed puts its Beige Book Economic Survey report out, and the Bank of England publishes the minutes from its most recent meeting.

  • THB – Thailand (Bank of Thailand) expected to hold at 3.50% on the 19th of Oct
  • NOK – Norway (Norges Bank) expected to hold at 2.25% on the 19th of Oct
  • BRL – Brazil (Banco Central do Brasil) may cut 25bps from 12.00% on the 19th of Oct
  • PHP – Philippines (Bangko Sentral ng Pilipinas) expected to hold at 4.50% on the 20t of Oct
  • TRY – Turkey (Central Bank of the Republic of Turkey) expected to hold at 5.75% on the 20th of Oct

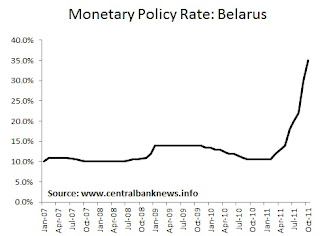
Belarus Central Bank Lifts Rate 500bps to 35.00%

Belarus Monetary Policy Interest Rate

The National Bank of the Republic of Belarus raised its refinancing rate by 500 basis points to 35.00% from 30.00%.  The Bank said [translated]: “The move is next step in the consistent implementation of the general economic policy of the National Bank and the Government aimed at macroeconomic stabilization, reducing the pressure on the Belarusian ruble exchange rate and reducing inflation.  The National Bank jointly with the Government of the Republic of Belarus will continue the adoption of stabilization measures in the light of internal and external economic developments.”

The latest move marks a continued string of aggressive rate increases, with the Bank previously raising the refinancing rate by 300bps to 30%, 500 basis points to 27% and 200 basis points to 22%.  The total amount of increases since the start of the year is now 2450 basis points.  Belarus reported consumer price inflation of 36.2% in the year to June, according to the National Statistic Committee, meanwhile the government is forecasting 2011 inflation of as much as 39%.  


The Bank also said in a separate announcement that interest rates on liquidity management operations would also increase, with the overnight deposit rate rising to 25% and the overnight credit rate rising to 50%.  The move “aims to enhance the impact of interest rate policy on the economy, restrictions on lending activity and stabilize the currency market.”

The USD-Belarussian ruble (BYR) exchange rate has doubled on the black market, rising to as much as 7,000 per dollar (approx. 6,000 in July), and currently trades around 8750 (5350 this time last month) against the US dollar, according to quotes from Yahoo Finance.

www.CentralBankNews.info

Banco de Mexico Keeps Interest Rate at 4.50%

The Banco de Mexico held its overnight interest rate target steady at 4.50%.  In its monetary policy statement the Bank noted: “the current monetary policy posture is conducive to achieve the 3.0% inflation objective.”  Further commenting: “However, we will remain alert to the prospects for world economic growth and its possible implications for the Mexican economy, which, in the context of great monetary slack in the principal advanced economies could as a result make it appropriate to relax monetary policy.”

The Mexican central bank also kept the overnight interest rate target steady at 4.50% at its August meeting.  Mexico reported annual inflation of 3.14% in September, compared to 3.42% in August, while inflation was 3.28% at the end of June, 3.4% April and 3% in March, and within the Bank’s inflation target range of 3% +/- 1%. 

The Mexican economy grew 3.3% (4.6% in Q1) year on year in Q2 this year, up 1.1% (0.5% in Q1) from the previous quarter, compared to GDP growth of 5.4% in 2010.  The Mexican peso (MXN) is down almost 10% against the US dollar so far this year, and the USDMXN exchange rate last traded around 13.26.

Banco Central de Chile Keeps Interest Rate at 5.25%

The Banco Central de Chile kept its monetary policy interest rate steady at 5.25%.  The Bank noted: “Domestically, output and demand show signs of moderation. In the case of output, the slowdown is more pronounced than was assumed in the Monetary Policy Report’s baseline scenario; the opposite occurs with demand. Labor market conditions remain tight. CPI inflation rates have hovered around 3% y-o-y, while core inflation measures remain contained. Inflation expectations are close to the target. “

Chile’s central bank previously also kept the monetary policy interest rate unchanged at 5.25% at its September meeting.  The Bank last raised its monetary policy interest rate by 25 basis points to 5.25% at its June meeting this year.  Chile reported annual consumer price inflation of 3.3% in September, compared to 3.2% in August, 2.9% in July, 3.4% in June, 3.3% in May and 3.2% in April this year; within the Bank’s inflation target of 2-4%.  


The Chilean economy grew 8.4% in the first half of 2011, driven by strong domestic demand; full year GDP growth is expected around 6.5%, while inflation is seen around 4% by the end of the year.  The Chilean Peso (CLP) has weakened about 9% against the US dollar so far this year, while the USDCLP exchange rate last traded around 499.

Have the Bears Taken Over?

By MoneyMorning.com.au

‘I have a feeling we are going to see lower prices before you could call the low of the bear market.’
Slipstream Trader, Murray Dawes 7 October 2011


Is Murray right?

Could be. A leading bearish indicator – we’ll show you in a minute – has reached a five year peak. When bearish indicators peak it suggests stocks could be heading for a fall.

This shouldn’t come as a surprise.

Since the April highs of this year, the Dow Jones Industrial Average has lost more than 6%. The S&P 500 is 8% worse off. And the S&P/ASX 200 is down more than 11%.

Data compiled for Bloomberg News showed ‘borrowed shares’ rose to 11.6% in September, almost 2% higher than July.

This is important because in order for short sellers to short sell, they must first borrow the shares. So knowing the amount of borrowed shares gives a good guide to how much stock is being short sold.

That should be enough to alarm the bulls. Because the larger the amount of short selling, the more ‘bearish’ the market outlook.

To put it in perspective, the 2% increase in short selling is the biggest increase since 2006. Bloomberg’s report found ‘US short sales are rising at the second-fastest pace on record after the 2008 financial crisis.’

And according to the New York Stock Exchange, short selling has jumped from 3.5% in July to 4.1%.

Some analysts don’t know which way to look


So, which way is the market headed?

Filippo Garbarino, a managing director at Frontwave Capital says, ‘The market is so undervalued right now, it’s kind of hard to take a short position. But at the same time given the economy, it is hard to be long’.

And then there’s this from Eden Chen, at Lightmark Capital, ‘It’s very difficult to say with certainty whether being long or short right now is a good idea because things can quickly change.’

In other words, they don’t know!

Anyone can see the market is trending down. But what you want to know is what you should do about it?

Using the technical information


Technical analyst, Murray Dawes, has been wary of the lack of market direction.

When discussing the technical aspects of the S&P 500, in his free weekly market update, Murray warned that if ‘…there’s a quick sell off from back under the 10-day moving average… we can get bearish again. But right now the market is holding well up above that 10-day moving average, it’s in a short-term uptrend.’

He added, ‘A move back under… 1230, that would be the area that I’m looking to enter with my short [trades]. That would be the perfect trading opportunity. Where we are right now is a bit of no man’s land.’

As for the ASX200, he says it could move higher. But don’t expect it to last long.

Murray says:

‘Last week I was saying that there was a chance that if the market did take off to the upside we could see even a move back up to the 200 moving average which is up around 4450…

‘[But] we have to be a little wary that the shift in momentum in the last week or two has been quite dramatic. This could carry on for a bit longer before falling over.’

In other words, this is a traders’ market… and a volatile market.

And that means there are plenty of opportunities to trade the market long or short.

Shae.
Editor, Money Weekend

P.S. To check out Murray’s latest free weekly market update on YouTube, click here…


Have the Bears Taken Over?

Three Tips to Help You Succeed in Trading

By Warren Seah

Trading can be a bit precarious. For so many, it’s an incessant accumulation of frustrations– the trade may not always go in your favor, you foolishly bought into some “expert’s” advice, you’re unsure whether you should close a losing trade or sustain it. It’s a business where your success will be nebulous. If you follow these five tips that I prescribe, however, you will have the upper hand.

Have Sufficient Capital

A general rule: You can never have too much capital to start with; you can, however, have too little. Think of trading as building muscle. You can’t effectively build muscle (wealth) without the right amount of body mass (capital.) Your efforts will be scrawny, weak. To start with, it’s best to have about $100,000. If you don’t have that, try for $50,000-75,000. Why this much? The more money you put in your trades, the more money you will get in return.

Manage your Risk

This is a biggie. Through the management of your risk, you will sink or swim. It’s here that you either grow the capital that you have or deplete it entirely. Unfortunately, many traders commit the latter. It’s Money Management 101. As a rule, you do not invest too much on one trade (too much would be as little as .) When you put all of your eggs into one basket, you’re bound to lose. Also, you might want to put a stop loss on your trades. This protects from massive loss that can literally render your account barren. This is a common tool of risk managements; if used, you will be grateful for its practicality.

Know What you’re Using

If you look on most traders’ charts, you will see a byzantine network of indicators and patterns, often packaged together as a convoluted, distorted mess. If asked how this helps them in their trading, many will struggle to find the answer. Do not overpopulate your chart with useless appendages and accessories. You won’t need them. For instance, a good indicator is a triangle chart pattern. It, as its name infers, finds patterns in trades (ie trends, the direction of the trade, the overall interest of other traders.) Triangle chart patterns will track the journey of a trend with the ascending, descending, and symmetrical triangles.

If used sparingly, indicators such as these will benefit the trader who seeks more clarity in his chart.

In closing, it always helps to have a trading plan or strategy. Adopt or create a trading style or method, test it out, make adjustments and alterations. If it can produce the results you want, don’t stray away from it. Deter human emotion from the trading process (fear, excitement.) This is a business, a precarious one. But, if treaded carefully, it can yield awesome results.

About the Author

Warren Seah

What if you just couldn’t trade forex effectively with a day time job?

I know how hard it can be to trade forex manually, but if you want to really be successfully trading your own unique manual system, you need to learn a single method that works amazingly well.

This method is simple to pick up and it works like an automated trade exit tool. Yes, you can now select the forex exit strategy and the tool will manage your trade and exit with profit. You can read how to do it in my free report here: Mt4 Expert Advisor

Don’t give up hope, it’s NOT impossible. Triangle Chart Patterns will expand your trading capabilities to greater trading success learn more by clicking the link.

The S&P 500 is Getting Close to a Top

JW Jones – www.OptionsTradingSignals.com

The past few months have been very difficult to navigate for retail investors and institutional money managers. The huge week to week price swings and increased volatility have made the current market conditions exceptionally difficult to maneuver. Day traders are about the only group of market participants that outperform during periods such as we have seen since the beginning of August.

Before I jump into the analysis, I would like to point out to readers that the S&P 500 Index (SPX) has rallied from 1,075 on October 4th to 1224.50 on October 14th. The S&P 500 has rallied almost 150 handles or 14% from the lows to Friday’s close in 10 calendar days. As an options trader and a market participant, I trade the market that I see, not the market that I want. With that said, ask yourself this question: Does a healthy financial construct rally 14% in 10 calendar days?

To put the recent price action into perspective, since the beginning of the year 2000 the S&P 500 would have had a poor track record on an annualized basis when compared to the past 10 calendar days’ trough to peak performance. Only in the years 2003, 2006, 2009, & 2010 would an investor have been able to best the previous 10 calendar days’ performance (Performance data courtesy of Wikipedia). The most amazing thing about the recent price action is that the S&P 500 Index is still underwater for the year even after rallying roughly 14%.

At this point two scenarios are likely to play out. One scenario involves a rally on the S&P 500 towards the key 1,250 – 1,270 resistance zone which is outlined on the chart below. The recent price action in the S&P 500 has been volatile and at this point it has gone nearly parabolic. The daily chart of the S&P 500 Index is shown below:

SPY Option Trade

The resistance level shown in the chart above outlines the key 1,250 – 1,270 resistance zone that will be tested if the S&P 500 can breakout above the 1,230 resistance level. However, it is critical for traders to recognize that probabilities are starting to favor the short side. Let me explain.

If the S&P 500 is able to rally into the 1,250 – 1,270 level it would represent a gain of less than 4%. The bears will vigorously defend the S&P 1,250 – 1,270 resistance zone and it is unlikely that price action will be able to take out that resistance zone on the first breakout attempt.

With only 4% upside, the odds of some sort of correction are favorable at this point in time. Whether the correction begins early next week or whether we have to wait until the key resistance zone is tested, sellers will step back into the driver’s seat in the not-so-distant future.

McClellan Oscillator

A few data points that exemplify the overbought status of the S&P 500 are shown below. The first indicator is the McClellan Oscillator that my trading buddy Chris Vermeulen pointed out to me.

Options and the McClellan Oscillator

50 Period Moving Average Momentum Chart

The momentum chart shown below courtesy of www.barchart.com illustrates the number of domestic equities trading above their key 50 period moving averages:

50 Period Moving Averages and Options

Both charts above are warning signs that this rally is starting to get a bit overheated. I would point out that the past two times the McClellan Oscillator and the momentum chart peaked a nasty selloff occurred shortly thereafter. The one point that I would like to make clear to readers is that each time both indicators peaked prices eventually went much lower.

The evidence would lead astute traders to believe a top was near. The more arduous details about the future of the S&P 500’s price action revolve around where the topping formation will be. Will the S&P 500 find resistance on a second test of the key 1,230 resistance level?

The other scenario would involve higher prices next week that eventually reach the key 1,260 – 1,270 area on the S&P 500. Will price work roughly 4% higher before confirming a top at the key breakdown level that initiated the selloff back in August?

Conclusion

I am of the opinion that a topping formation or pattern is likely near, but the location of the top is unknown to me presently. More importantly the forthcoming selloff resolution will be very telling about the current trend of the marketplace.

The most constructive price action that we could see would be a selloff that results in a higher low on the daily chart. If that type of price action plays out a new bullish run could begin. However, if we form a top and price action breaks down below recent lows it would not be surprising to see another lower low form which would put the trend squarely in favor of the bears.

The most important aspect of coming weeks will not necessarily be where a top forms, but if and when a selloff begins. Ultimately the depth, momentum, and ferocity of the selloff are more important than where the topping pattern begins.

At this point I have no purely directional trades on the books, but I am developing a laundry list of shorts that make sense. After all, volatility has declined quite a bit and puts are starting to get a whole lot cheaper!

In closing, a top is likely in the cards in the near future. However, the strength and momentum of the forthcoming selloff will tell the real story about the future direction of stock prices. The next few weeks should be quite interesting!!

Subscribers of OTS have pocketed more than 150% return in the past two months. If you’d like to stay ahead of the market using My Low Risk Option Strategies and Trades check out OTS at www.OptionsTradingSignals.com and take advantage of our free occasional trade ideas or a 66% coupon to sign up for daily market analysis, videos and Option Trades each week.

JW Jones – www.OptionsTradingSignals.com

This material should not be considered investment advice. J.W. Jones is not a registered investment advisor. Under no circumstances should any content from this article or the OptionsTradingSignals.com website be used or interpreted as a recommendation to buy or sell any type of security or commodity contract. This material is not a solicitation for a trading approach to financial markets. Any investment decisions must in all cases be made by the reader or by his or her registered investment advisor. This information is for educational purposes only.

Clean Country Living? Nope! Cities are Greenest

At the 2011 Take Lead Conference in Copenhagen, Philipp Rode talks about why Urbanization can actually be good for the environment.

Rode is the Executive Director of the London School of Economics Cities programme and a Senior Research Fellow of Economics and Political Science at the school. The focus of his current work is on Green Cities Strategies which includes writing part of the Green Economy Report for the United Nation’s Rio+20 Summit on Sustainable Development.

Legal information

Video courtesy of en.jyskebank.tv

Forex Market Outlook 10/14/11

It looks as though the European rescue plan is starting to take shape as a meeting of G-20 leaders is likely to produce a framework for the resolution.  It is then likely that whatever emerges will be discussed at a meeting next week of European leaders and if that is agreed to, then we could have the final resolution by early November as promised by Merkel and Sarkozy.

Some of the points of emphasis will be: what is the haircut in Greek bonds, that is, what percentage of private sector losses will be required.   This is important because this may lead to further bank losses that have high exposure to sovereign debt.  This leads to the second point, that the ECB needs to help re-capitalize the banks so that they can weather the potential losses.  There is also talk that the IMF will step in to provide capital, and the IMF in turn will receive capital infusion from emerging markets countries like China and Brazil.

So in reality, this is really more of a global collaborative effort as it doesn’t look like Europe has the juice to go it alone, and world leaders understand the threat that this poses to global economic health.

This comes as the ratings agency S&P looks to hasten the process by downgrading Spain’s debt for the third time in three years.  In addition, there was a no-confidence vote that took place in Italy, which PM Berlusconi survived.

Despite all of this uncertainty and hopefulness, the markets are in risk-taking mode to start the morning, lead by last night’s better than expected earnings report from Google.  This has driven stocks higher, and the correlative effects of Dollar weakness have been taking place.

However, the market has turned around a bit on the release of the US advance retail sales figures which were actually a lot better than expected, so this could be a case of markets not looking to be long risk ahead of the weekend.  The figure reported showed a gain of 1.1% vs. an expected .7%, which is definitely a plus for the economy.

So why have the markets sold off on that report?  Perhaps because it dampens the possibility of further Fed easing as the economic picture improves, or maybe it’s a case of “buy the rumor, sell the news”.

Other news from earlier today was that China’s CPI data came in as expected by slightly lower than last month, posting a reading of 6.1%.  If inflation begins to cool in China, then it could be a sign that the economy is slowing.  Or it cold also mean that they are ready to ramp up lending again.  The potential impact of the currency bill passed in the Senate here in the US to try to force China to re-value their Yuan is unknown at this time, as is the Chinese response to it.

CPI data in Europe also came in as expected at 3%, though the ECB doesn’t have room to move even if they wanted to go higher.  The obvious focus there is on the debt crisis.

The only thing else to watch this morning is the U of Michigan Confidence figure which comes out later, though I don’t think it will be a game-changer.  With the “Occupy Wall St.” movement and gridlock in government, it is hard to imagine anyone is confident right now.

However, it is times like these when it is usually best to dip your toe in the water.  Being a contrarian in the marketplace is a difficult but often times rewarding position to take.  If everyone is selling, someone has to be buying, right?

Just some food for thought.


Regards,

Mike Conlon,

Senior Forex Mentor

www.forexnews.com