Are Boomers to Blame for the Bust?

By MoneyMorning.com.au

Saw an article on the Sydney Morning Herald website this morning blaming Baby Boomers for the state of the economy… ‘Greed of boomers led us to a total bust’ it said.

We couldn’t believe our eyes…

Most… most… of the ‘boomers’ we know have worked hard all their lives, lived within their means and tried to pay off the debts they did accumulate (like house loans) as fast as they could.

Of course, credit cards were introduced in 1974… And, apparently – according to creditcards.com – Aussie Baby Boomers hold $150 billion in debt.

But does that mean, because Baby Boomers used the credit cards made available to them, that they’re the root of all the problems with today’s economy?

In our view, it’s the rise of the Welfare State and Easy Credit that have led us to where we are now.

But rather than face facts and accept this is the cause of the problem, the powers that be call for more welfare and credit…

That makes it hard for Aussie firms to invest in their business. The welfare state takes from the productive economy to support non-production. And easy credit distorts the economy by allocating resources away from capital spending and towards immediate consumer spending instead.

It’s partly why former Commonwealth Bank CEO and Future Fund chairman David Murray warns of Dutch Disease. This is where an economy relies too much on the resources sector to the harm of all others… except for the consumer sector.

In the short-term it provides a boost to the economy. Until all the credit’s used up. But in the long term it harms the economy and Aussie businesses. And eventually, even the consumer sector feels the pinch too…

And that’s bad news for stock prices. But, if you’re a short seller, it opens a window of opportunity for you in stocks that are on the way down.

The Most Short-Sold Stocks on the ASX Last Week By % Of Issued Capital Reported as Short Sold…

  1. Challenger Limited (ASX:CGF)
  2. Lynas Corporation Limited (ASX:LYC)
  3. Betashares Gold Bullion ETF (ASX:QAU)
  4. Foster’s Group Limited (ASX:FGL)
  5. Cochlear Limited (ASX:COH)
  6. Galileo Japan Trust (ASX:GJT)
  7. Vanguard US Total Market Shares (ASX:VTS)
  8. Billabong International (ASX:BBG)
  9. Paladin Energy (ASX:PDN)
  10. Atlas Iron Group (ASX:AGO)

Aaron Tyrrell
Editor, Money Morning

Related Articles

Three Gold Bubble Signals You Should Ignore

Manipulation on a Grand Scale

The Madness of Mad Men

Three Steps to Wealth: Leverage, Volatility and Risk

What China’s Secret Gold Cache Means for Aussie Gold Stocks

From the Archives…

Australia: The World’s Investing Casino
2011-09-23 – Kris Sayce

Why China’s Hidden Bad Debt is Bad News for Aussie Stocks
2011-09-22 – Kris Sayce

Contrarian Investors: Add This Sector to Your Buy List
2011-09-21 – Dr. Alex Cowie

Is This the Last Surprise in Bernanke’s Tool Box?
2011-09-20 – Kris Sayce

How to Maximise Your Returns in a Volatile Market
2011-09-19 – Kris Sayce

For editorial enquiries and feedback, email [email protected]


Are Boomers to Blame for the Bust?

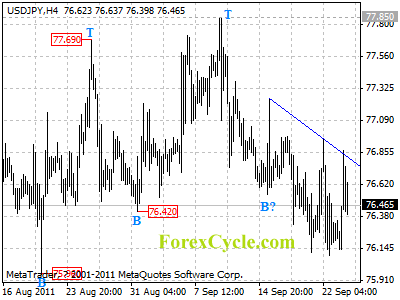
USDJPY stays below a downtrend line

USDJPY stays below a downtrend line on 4-hour chart, and remains in short term downtrend from 77.85. As long as the trend line resistance holds, downtrend could be expected to continue, and on more fall to test 75.96 support is still possible, a breakdown below this level could signal resumption of the long term downtrend from 124.16 (2007 high). On the other side, a clear break above the trend line resistance will indicate that the fall from 77.85 is complete, and lengthier consolidation of the longer term downtrend from 85.51 is underway.

usdjpy

Forex Technical Analysis

Weekly Forex Market Outlook (September 26 – October 1)

By CountingPips.com

Fundamental Forex Market Outlook for the Upcoming Week

The key fundamental economic events that can strongly influence the forex market this week feature the U.S. CB Consumer Confidence survey (46.4) due out on Thursday and Canadian GDP (0.3%) out on Friday.

Key economic releases due out this week are detailed further below, with the current market consensus expectations or the last result included in parenthesis whenever available.

Monday’s data features the results of the German Ifo Business Climate survey (107.0), and U.S. New Home Sales (296K), while Tuesday’s key data includes GBP Nationwide HPI, which is released from the 27th through the 30th (0.2%), and the featured U.S. CB Consumer Confidence survey.

On Wednesday, the market will closely monitor U.S. Core Durable Goods Orders (0.2%), as well as a speech by U.S. Federal Reserve Chairman Ben Bernanke. Thursday will see the release of U.S. Weekly Initial Jobless Claims (420K) and U.S. Pending Home Sales (-1.6). Kiwi traders will be watching NZ Building Consents (13.0%) out late in the session.

Friday’s important data includes this week’s highlighted Canadian GDP, the Swiss KOF Economic Barometer (1.46), and the New Zealand NBNZ Business Confidence survey (34.4). Saturday will then end the week with Chinese Manufacturing PMI (50.7).

Technical Forex Market Outlook for the Upcoming Week

EUR/USD:

Weekly Forecast: Higher, Short-Term Forecast: Lower

Resistance: 1.3566, 1.3586, 1.3720, 1.3743, 1.3796, 1.3936, 1.3972, 1.4103, 1.4147, 1.4258, 1.4279, 1.4327, 1.4499/1.4503, 1.4535/48, 1.4576, 1.4642/56, 1.4695, 1.4881, 1.4939 and 1.5144.

Support: 1.3517, 1.3500, 1.3494, 1.3458, 1.3418, 1.3384, 1.3333, 1.3000, 1.2968 and 1.2873.

200-day MA: 1.4045 and slowly rising.

14-day RSI: 33.4 and falling.

USD/JPY:

Weekly Forecast: Somewhat higher, Short-Term Forecast: Mixed

Resistance: 76.70, 76.88, 76.96, 77.06, 77.30/37, 77.71, 77.85, 78.02, 78.66, 79.05, 79.40 and 80.00, 80.22, 80.82, 81.34, 81.76, 82.01/22, 82.77, 83.09 and 83.77.

Support:  76.56, 76.32, 76.25, 76.14, 76.10, 75.94, 75.00 and 70.00 likely.

200-day MA: 80.63 and falling.

14-day RSI: 43.8 and falling.

GBP/USD:

Weekly Forecast: Higher, Short-Term Forecast: Lower

Resistance: 1.5499, 1.5577, 1.5632, 1.5685, 1.5705, 1.5745, 1.5839, 1.5867, 1.5883, 1.5912/19, 1.5951, 1.6000, 1.6037, 1.6081, 1.6130, 1.6204/06, 1.6252/59, 1.6332/47, 1.6434/52, 1.6500/98, 1.6616, 1.6720/1.6744, 1.6876 and 1.7040.

Support: 1.5483, 1.5422, 1.5373, 1.5343/55, 1.5326, 1.5293, 1.5123, 1.5000, 1.4947, 1.4872, 1.4785/97, 1.4500, 1.4474, 1.4345 and 1.4229.

200-day MA: 1.6123 and falling mildly.

14-day RSI: 30.4 and rising.

USD/CHF:

Weekly Forecast: Somewhat higher, Short-Term Forecast: Higher

Resistance: 0.9081, 0.9091, 0.9180, 0.9294, 0.9300, 0.9327, 0.9339, 0.9368, 0.9774/83, 0.9971, 0.9997, 1.0000 and 1.0065.

Support: 0.9000, 0.8994, 0.8979, 0.8918, 0.8883, 0.8873, 0.8797, 0.8788, 0.8728, 0.8646, 0.8622, 0.8536, 0.8239, 0.8000, 0.7992, 0.7805, 0.7768, 0.7708, 0.7606, 0.7500 and 0.7064.

200-day MA: 0.8804 and falling mildly.

14-day RSI: 71.2 overbought and rising.

AUD/USD:


Weekly Forecast: Higher, Short-Term Forecast: Lower

Resistance: 1.0296, 1.0310, 1.0347, 1.0360, 1.0373/96, 1.0473, 1.0481, 1.0511, 1.0564/70, 1.0599, 1.0624, 1.0633, 1.0659, 1.0683/93, 1.0718/26, 1.0763, 1.0784, 1.0909, 1.1000, 1.1010/15, 1.1064/79 and 1.1500.

Support: 1.0176, 1.0146, 1.0077, 1.0000, 0.9842/64, 0.9803, 0.9731, 0.9704, 0.9689, 0.9667, 0.9651, 0.9536/41, 0.9500, 0.9462, 0.9330, 0.9220, 0.9077, 0.9000, 0.8870, 0.8858, 0.8632, 0.8550 and 0.8066/81.

200-day MA: 1.0393 and rising mildly.

14-day RSI: 31.0 and falling.

USD/CAD:

Weekly Forecast: Lower, Short-Term Forecast: Higher

Resistance: 1.0322, 1.3047, 1.0360, 1.0372/79, 1.0490, 1.0500, 1.0506, 1.0646, 1.0669, 1.0742, 1.0756, 1.0785, 1.0853, 1.0868, 1.1000, and 1.1101/23.

Support: 1.0236, 1.0208, 1.0139, 1.0088, 1.0057, 1.0030, 1.0008, 0.9939/1.0030, 0.9828/77, 0.9763/96, 0.9734/39, 0.9724, 0.9686, 0.9645, 0.9567, 0.9526, 0.9496, 0.9448/56, 0.9422, 0.9405/09, 0.9056 and 0.9000.

200-day MA: 97.77 and flat.

14-day RSI: 70.3 overbought and rising.

NZD/USD:

Weekly Forecast: Higher, Short-Term Forecast: Lower

200-day MA: 0.7949 and rising.

14-day RSI: 26.9 oversold and falling.

Resistance:
0.7750/54, .07816, 0.7851, 0.7892, 0.7950/62, 0.8000/44, 0.8060/93, 0.8109/19, 0.8126/40, 0.8150/90, 0.8269/78, 0.8327/39, 0.8365/86, 0.8423, 0.8469/72, 0.8500, 0.8534/75, 0.8676.0.8764, 0.8793, 0.8841, 0.9000 and 0.9500.

Support:
0.7716, 0.7654/65, 0.7549, 0.7523, 0.7504, 0.7500, 0.7453, 0.7426, 0.7404, 0.7342, 0.7321, 0.7189, 0.7115, 0.7000 and 0.6945/62.


Forex: Speculators raise bearishness for Euro, Pound & other Major Currencies vs Dollar

By CountingPips.com

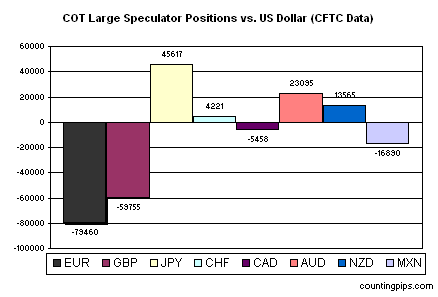
The latest Commitments of Traders (COT) report, released on Friday by the Commodity Futures Trading Commission (CFTC), showed that large futures speculators continued to add to their bets in favor of the US dollar as risk aversion was the dominant trading theme. Non-commercial futures speculative contracts, positions usually taken by hedge funds and large traders, decreased their long positions in the Swiss franc, Australian dollar and the New Zealand dollar directly against the US dollar while increasing bearish bets for the euro, British pound sterling, Canadian dollar and the Mexican peso, according to data on September 20th.

Japanese yen positions were the only currency bets against the US dollar that advanced last week.

EuroFX: Currency speculators continued to decrease their futures positions for the euro against the U.S. dollar for a fifth consecutive week. Euro positions dropped as of September 20th to a total of 79,460 net short contracts from the previous week’s total of 54,459 net short contracts on September 13th. Euro positions are now at their lowest point since June 8, 2010 when net contracts were on the short side at -111,945.


The COT report is published every Friday by the Commodity Futures Trading Commission (CFTC) and shows futures positions as of the previous Tuesday. It can be a useful tool for traders to gauge investor sentiment and to look for potential changes in the direction of a currency or commodity. Each currency contract is a quote for that currency directly against the U.S. dollar, where as a net short amount of contracts means that more speculators are betting that currency to fall against the dollar and net long position expect that currency to rise versus the dollar. The graphs overlay the forex spot closing price of each Tuesday when COT trader positions are reported for each corresponding spot currency pair.

GBP: British pound sterling positions sharply declined for the fourth consecutive week to the lowest level since June 2010. Pound positions decreased to a total of 59,755 short positions following a total of 26,193 short positions as of September 13th.


JPY: The Japanese yen net contracts rose for a second straight week as of September 20th from the previous week. Yen net long positions increased to a total of 45,617 net long contracts reported on September 20th following a total of 34,955 net long contracts reported on September 13th.


CHF: Swiss franc long positions declined for a fourth consecutive week as of September 20th. Speculators decreased bets on Swiss currency futures to a total of 4,221 net long contracts following a total of 5,493 net long contracts as of September 13th. The Swiss currency, usually a popular safe haven currency, has been stuck in neutral since the Swiss National Bank implemented a policy to fight the appreciation of the franc and maintain pegged against the euro at the 1.20 level.


CAD: Canadian dollar positions edged slightly higher after falling for two consecutive weeks but remained on the short side for a second straight week. CAD net contracts edged up to a total of 5,458 short contracts as of September 20th following a decline to a total of 6,303 net short contracts on September 13th.


AUD: The Australian dollar long positions declined for a second straight week as of September 20th after rising for four consecutive weeks. AUD futures positions fell to a total net amount of 23,095 long contracts following a total of 36,934 net long contracts reported as of September 13th. The latest speculators data marks the lowest level for Aussie positions since July of 2010.


NZD: New Zealand dollar futures positions fell to their lowest level since the middle of May, according to the data reported on September 20th. NZD contracts fell lower to a total of 13,565 net long contracts following a total of 17,664 net long contracts registered on September 13th.


MXN: Mexican peso contracts continued lower and declined for a seventh straight week to remain on a bearish front for a second straight week. Peso positions declined to a total of 16,890 net short speculative positions as of September 20th following a total of 1,209 short contracts that were reported as of September 13th.

COT Data Summary as of September 20, 2011
Large Speculators Net Positions vs. the US Dollar

EUR -79,460
GBP -59,755
JPY +45,617
CHF +4,221
CAD -5,458
AUD +23,095
NZD +13,565
MXN -16,890


Bull & Bear Cases for Gold, Silver and Stocks

After gold and silver got hit hard last week, some of you probably wonder if that was the end of the 10 year+ bull market for precious metals.
In this article, we will describe both the Bull & Bear Cases for Gold, Silver and Stocks and we will also make some interesting comparisons.
Let’s start off with the Bull case for gold.

Gold hit the red resistance line, which also halted gold’s rise in 2006 and 2008. I drew Fibonacci Retracement levels from the Bottom in 2001 to the “Inflation Adjusted Alltime High” around $2,300. We can see that the Fibonacci Levels have done their job in the past. Will we hit the 61.80% level again (and this hit the orange line, which is right between the red resistance line and the green support line)? That level comes in at $1,516 and is the July 2011 breakout level.


Chart courtesy stockcharts.com

Notice that the comparison with 1979 also gives us support at or near the low $1,500′s.

When we reached oversold levels on the RSI combined with a BPGDM Index below 50, it often marked a bottom for gold:


Chart courtesy stockcharts.com

When we look at the entire bull market of Gold since 2001, we can see that the 10 Months Exponential Moving Average was a good entry level. Right now, it is around $1,550. Price sometimes dipped slightly below this level, so once again, we might see the low $1,500′s.


Chart courtesy stockcharts.com

When we look at the Weekly chart of Gold, we can see that the 30EMA has often supported the Gold Price.


Chart courtesy stockcharts.com

Actually, the 150 Days EMA, which is a proxy for the 30 Weeks EMA, also provided support during the 1980 price explosion:

When we look at the following chart, we can see that the USD broke above the pink resistance line last week. Price is now also above the 200EMA, which acted as support and resistance in the past. This is a Bullish Development, and should be bad for precious metals and Equity Markets.

However, when we look at the gold price (2nd part of the chart), we can see that the 150EMA has not been broken to the downside yet.
For GDX (Market Vectors Gold Miners ETF) the 400EMA seems to be the level of importance. It has been tagged on Friday.
Silver looks much worse than Gold and Gold miners right now. That’s the reason why I haven’t touched silver at all since late April, when I expected Silver to crash. For the first time since 2008, the price has broken decisively below the 150EMA, which seems to be the level of importance (for both Gold and Silver).

Last but not Least, the SP500 also dropped below its 400EMA.

So unless we are about to see 2008 all over again, I think Gold and GDX are in the best position.
Silver is a broken parabola, and it takes time, a lot of time to reach new highs (if ever), as I have written several times.
The stock markets need to recover their 400EMA before they are in a favorable position.


Chart courtesy stockcharts.com


Chart courtesy stockcharts.com

I do have something positive to say about silver: Price is now 21.41% below its 50EMA. Whenever price fell more than 10% below its 50EMA during this bull market, silver was always at or near a bottom, EXCEPT for 2008. If we are about to see 2008 all over again, or if the commodity bubble burst last week, silver could drop another 50% from current levels, if not more…


Chart courtesy stockcharts.com

Here’s what could happen if we are about to see 2008 all over again (this is an updated version of a chart I published on July 20th)


Chart courtesy Prorealtime.com

Here’s another positive picture for silver, which I posted a while ago:

Silver Wheaton looks very bad at this point, as it is forming a Head & Shoulders Pattern:


Chart courtesy Prorealtime.com

As you probably know by now, I am fascinated by historical comparisons. Here’s my latest one: The gold price compared to the Shanghai Bubble:


Chart courtesy stockcharts.com

I calculated the Gold-to-10Year Yields, which got me the following chart:

The ratio hit a long term resistance line a couple of days ago, just like it was in the early 80′s.
It shows that gold has never been more expensive relative to bond yields.
On the other hand, low yields mean expensive bonds.
In my opinion, it shows that both gold and bonds have never been more expensive TOGETHER ever before.

I then decided to plot the Gold:10Years ratio together with the SP500:

Isn’t it interesting to see that bull markets in the Gold:10YR Yields ratio are in line with Bear markets in the SP500, and that Bear Markets in the Ratio are accompanied by Bull markets in Equity markets?

To end this article, I compared the Dow Jones index now with the Dow Jones in the ’70s:


Chart courtesy Prorealtime.com

The Total Return index shows a similar picture:

For more analyses and Trading Updates, visit www.profitimes.com !

Read Excerpts From Robert Prechter’s Newest Theorists in This Free Report

Bob Prechter has just released a FREE report — with urgent analysis from his August and September 2011 Elliott Wave Theorist market letters. It will help you put these uncertain markets into perspective so that you’ll be better positioned to both protect your investments when needed and prosper when opportunities arise.

Read your free report now.

Dear Investor,

“Lost decade.”

The phrase originally applied to Japan’s stock market. Yet in terms of depth and scale, it more accurately describes today’s markets and economy in the United States.

This became clearer than ever September 21, when CNNMoney ran an article titled “A Rough 10 Years for the Middle Class.” Given the data it reported, somebody’s rose-colored glasses must have substituted the word “rough” for the more honest “dreadful.”

Just when investors thought the stock market’s 50% drop in 2007-2009 was behind them, wham, the Dow dropped 2000 points within a short two-week period this summer. And since then, it’s a daily guessing game as to which way the market will go and how large the swings will be.

What does all this mean for you and your investments?

Bob Prechter has just released a FREE report — with urgent analysis from his August and September 2011 Elliott Wave Theorist market letters. It will help you put these uncertain markets into perspective so that you’ll be better positioned to both protect your investments when needed and prosper when opportunities arise.

Bob’s 30-plus years of market experience, in both bull and bear markets, can be an invaluable resource when the markets are volatile and investors are most vulnerable. This report offers is a unique opportunity for you to see what Prechter’s subscribers see.

Don’t wait! Prepare yourself today with Bob Prechter’s current market analysis.

Read your FREE report now.

But hurry, this report is only available until September 30.

About the Publisher, Elliott Wave International
Founded in 1979 by Robert R. Prechter Jr., Elliott Wave International (EWI) is the world’s largest market forecasting firm. Its staff of full-time analysts provides 24-hour-a-day market analysis to institutional and private around the world.

Top 10 Most Extreme Monetary Policy Moves of 2011

Here’s a listing of the top ten most extreme monetary policy moves in the year to date of 2011 (as judged by Central Bank News).  To be sure, there’s still another quarter of the year to go, and with heightened concerns about global growth and the ongoing European debt crisis the list could yet be expanded.  But for now, let’s look over some of the most extreme moves in the year so far in monetary policy:

  1. Belarus Financial Crisis
    The National Bank of the Republic of Belarus has surely set the record for interest rate increases this year, upping its rate a total of 1950 basis points this year to 30% and devaluing the Belarussian ruble, as the country dealt with an economic, financial, credit, and currency crisis.
  2. The Twist
    One of the most anticipated moves of the year was the US Federal Reserve’s $400B twist to its quantitative easing program where it plans to sell $400B of shorter term maturities and buy $400B of longer term securities to push down longer term interest rates.
  3. Swiss Franc Floor
    After a series of interventions and serious jawboning the Swiss National Bank finally announced a hard floor on the EUR/CHF exchange rate at 1.20 – the exchange rate moved over 1000 “pips” (basis points) following the announcement.
  4. ECB SMP and the Confidence Crisis
    In the wake of the US downgrade a confidence crisis began to grip markets, the ECB was rumored to be buying the debt of Greece, Portugal and Ireland, but not Spain or Italy. The ECB subsequently capitulated and signaled an expansion of its SMP (Securities Market Program) to include those countries and immediately bought record amounts (EUR 22B that week).
  5. Bank of Japan Earthquake Response
    Following the devastating earthquake and tsunami in Tōhoku, Japan, the Bank of Japan announced an initial 5 trillion yen expansion to its asset purchase program, and launched a 1 trillion loan program for financial insitutions affected by the quake. The Bank expanded the asset purchase program another 10 trillion yen in August to help sustain the recovery.
  6. Vietnamese Hyperinflation
    Vietnam has seen inflation surge past 20 percent this year (22.16% in July), and has announced a string of monetary policy moves to try reign in run-away prices, including 500 basis point increase in the refinancing rate (now 14.00%), reserve ratio hikes, and currency related adjustments.
  7. Brazilian Rate Reversal
    After raising the Selic rate 5 times this year by a total of 175 basis points to 12.50%, the Banco Central do Brasil’s Copom dropped the rate by 50 basis points back to 12.00%. This has lead some to speculate the trend of emerging market policy tightening may be starting to turn.
  8. Kiwi Earthquake Insurance
    Following the fatal earthquake in New Zealand’s 3rd largest city, the RBNZ “acted pre-emptively” by dropping the OCR by 50 basis points to 2.50%. It made reference to removing the “insurance [interest rate] cut” at its July meeting, however that was contingent on the global financial outlook and exchange rate…
  9. Joint Liquidity Operations
    In a brief statement, the ECB announced joint USD liquidity operations with the US Federal Reserve, Bank of England, Bank of Japan, and Swiss National Bank. While it didn’t explain why, most read it as a show of solidarity and cooperation, and an attempt to shore-up European bank liquidity.
  10. ‘Chindia’ Tightening
    Perhaps the most representative economies in the emerging market monetary policy tightening story were China and India – also two of the largest and most dynamic emerging markets. China chalked up 75 basis points of interest rate hikes, and 300 basis points in RRR hikes, while India upped its rate 200 basis points.

Charles Sizemore Quoted in Smart Money

By The Sizemore Letter

Charles Sizemore was quoted this week in the Wall Street Journal’s Smart Money:

Surveys show that a growing number of advisers and planners are dealing with market calamities differently than in the past, telling clients they can’t simply “buy and hold” stocks for years anymore and must make regular tweaks to their portfolios when the markets swing wildly. One strategy following this week’s drop: Buy high-quality stocks on the dip, says Charles Sizemore, a financial adviser in Dallas, Texas. In particular, Sizemore recommends scooping up blue chips with a long history of raising dividends. That way, if market volatility continues, “you’re being paid handsomely to wait it out,” he says.

Dividend-payers currently trading at low prices relative to earnings, says Sizemore, include Microsoft (MSFT), Intel (INTC) , Johnson & Johnson (JNJ) and Procter & Gamble (PG). These stocks can be particularly beneficial in the coming months and years if stock price gains are as meager as some economists and market watchers predict.

To read the full article, please see “The Surprising Advice From Advisers.”

South African Reserve Bank Keeps Repo Rate at 5.50%

The South African Reserve Bank [SARB] kept its monetary policy interest rate, the repo rate, on hold at 5.50%.  The Bank said: “Recent data have confirmed the fragile and uneven nature of the domestic economic recovery, and unfavourable forward-looking indicators are consistent with a downward revision of the Bank’s economic growth forecast. At the same time a number of exogenous factors have continued to put upward pressure on domestic inflation. This combination of declining growth and rising inflation poses a challenge to monetary policy going forward, and is a feature being experienced in a number of emerging markets.”

Previously the SARB also held the repo rate unchanged at its July meeting this year, the Bank last cut the repo rate by 50bps to 5.50% in November 2010.  South Africa reported annual inflation of 5.3% in August and July, 5% in June, 4.6% in May, and 4.2% in April this year, compared to its official inflation target range of 3-6%. South Africa’s economy grew 1.3% in the June quarter, while the SARB is forecasting 2011 growth of 3.2%.  The South African Rand (ZAR) has weakened by about 25% against the US dollar so far this year, with the USDZAR exchange rate trading around 8.31

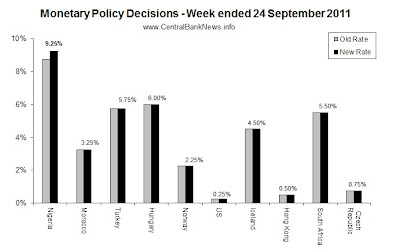
Monetary Policy Week in Review – 24 September 2011

The past week in monetary policy saw 10 central banks reviewing monetary policy settings, with just 1 (Nigeria +50bps to 9.25%) changing interest rates.  Those that held rates unchanged were: Morocco 3.25%, Turkey 5.75%, Hungary 6.00%, Norway 2.25%, USA 0.25%, Iceland 4.50%, Hong Kong 0.50%, South Africa 5.50%, and the Czech Republic 0.75%.  On required reserve ratios, Croatia increased its RRR by 100bps to 14.00%.  Of course the biggest news was the US Federal Reserve’s FOMC announcing ‘operation twist’, where it adjusted its quantitative easing program; switching $400B of shorter term maturities to $400B of longer term maturities.

Monetary Policy Week in Review


The theme of unusually high uncertainty and slowing global growth continued to weigh heavily on central bank interest rate decisions, and contributed to the large proportion of no-change decisions during the week. Following are some of the key quotes from the central banks’ monetary policy media releases over the past week:

  • Central Bank of Nigeria (increased 50bps to 9.25%): “Concerns remain about sustaining the current inflation trend. The anticipated high liquidity in the near future would have a bearing on inflation in the near future,” further noting “the fiscal stance continues to be expansionary. In addition there is the weight of structural factors such as the announced hikes in electricity tariffs and the expected removal of the petroleum subsidy.”
  • US Federal Reserve (held interest rate, adjusted QE): “The Committee intends to purchase, by the end of June 2012, $400 billion of Treasury securities with remaining maturities of 6 years to 30 years and to sell an equal amount of Treasury securities with remaining maturities of 3 years or less. This program should put downward pressure on longer-term interest ratesand help make broader financial conditions more accommodative.”
  • Central Bank of Turkey (held interest rate at 5.75%): “The Committee has noted that core inflation may continue to rise in the short-term. However, due to the slowdown in economic activity, it is expected that the second round effects of exchange rate movements would be limited, and thus the increase in inflation would be temporary. Accordingly, the Committee has indicated that inflation outlook for the end of 2012 is consistent with the 5 percent target.”
  • Magyar Nemzeti Bank (held interest rate at 6.00%): “In the Council’s judgement, Hungarian economic growth is likely to remain subdued over the next two years, with the level of output remaining below its potential throughout the period. Medium-term upside risks to inflation have fallen due to weak domestic demand. Inflation may fall back to 3% by the beginning of 2013, as the effects of cost shocks and increases in indirect taxes wear off.”
  • HKMA (held interest rate at 0.50%): “This time the Fed’s new policies will not have any impact on Hong Kong’s interbank (HIBOR) interest rate,”
  • South African Reserve Bank (held interest rate at 5.50%): “Recent data have confirmed the fragile and uneven nature of the domestic economic recovery, and unfavourable forward-looking indicators are consistent with a downward revision of the Bank’s economic growth forecast. At the same time a number of exogenous factors have continued to put upward pressure on domestic inflation. This combination of declining growth and rising inflation poses a challenge to monetary policy going forward, and is a feature being experienced in a number of emerging markets.”


Looking at the central bank calendar, next week there are five central banks scheduled to announce monetary policy decisions:

  • ILS – Israel (Bank of Israel) – expected to hold at 3.25% on the 26th of Sep
  • RON – Romania (Banca Nationala a Romaniei) – expected to hold at 6.25% on the 29th of Sep
  • TWD – Taiwan (Central Bank of the Republic of China) – expected to hold at 1.875% on the 29th of Sep
  • MNT – Mongolia (Bank of Mongolia) – expected to hold at 11.75% on the 29th of Sep
  • COP – Colombia (Banco de la Republica de Colombia) – expected to hold at 4.50% on the 30th of Sep