How to Earn a Second Social Security Check Every Month

 By DividendOpportunities.com

I’ve discovered a way to earn the equivalent of a second Social Security check every month.

Now, I don’t want to mislead you. This check isn’t from Uncle Sam. In fact, the government doesn’t have anything to do with it. (I think that’s good news considering all the debt problems the government is facing).

And you won’t be receiving one big check. Instead, you’ll see dozens of smaller ones in your mailbox — or brokerage account — each month.

Let me explain…

According to the Social Security Administration’s Monthly Statistical Snapshot, in June 2011 the average monthly benefit for the roughly 55 million Americans receiving a Social Security check was $1,079.

That month, I earned $1,387 from this alternative method. The month prior I earned $1,186. And the month before that saw $1,498. Like I said, I’ve discovered a way to earn the equivalent of another Social Security check each and every month.

And I only started to build this monthly income stream back in December 2009. So what’s the secret? What’s the key to earning a “second” Social Security check every month?

I call it my “Daily Paycheck” strategy. In short, I’ve been building a portfolio with the goal of earning a dividend or “paycheck” each and every day.

For my portfolio, I’m simply selecting solid and dependable income securities. And I’m focusing on those securities paying dividends frequently.

Roughly half of the portfolio — including holdings like the Reaves Utility and Income Fund (NYSE: UTG) — pay monthly dividends. On average, I receive 30 dividend distributions each month. So even on down days in the market, the daily income helps to mitigate any pain. And since I’m reinvesting the dividends, I am actually using the dividends I’m paid now to add to my holdings… increasing dividends in the future.

You might think this sort of strategy would pay you a lot in dividends… but do nothing as far as capital gains.

But the results of my study have said otherwise…

Even with my slow and steady approach, my portfolio has not only kept pace with the S&P 500, it is now outperforming the overall market.

I bought my first investments for The Daily Paycheck’s $200,000 real-money portfolio in December 2009. But I took my time putting my money to work. I wanted to spread out my market risk and carefully research each potential holding. Six months later, I still had more than 40% cash in the portfolio.

Now that I’m fully invested and the dividends are compounding, the entire portfolio is starting to take off. From the beginning of this year through July 14th (the date I last priced out my portfolio in my Daily Paycheck newsletter), the S&P 500 returned 5.2%. In that time, the “Daily Paycheck” portfolio returned 6.1%.

That may not seem like much of a difference, but the best news is that this return should only grow faster. Remember, I’m reinvesting dividends. That’s buying more shares and increasing the portfolio’s return automatically. The effect of compounding will just get larger.

Meanwhile, I’m doing all of this with about half the volatility of the broader market.

Now, this isn’t some get rich quick scheme. And the income isn’t as guaranteed as a “traditional” Social Security check.

But as a Baby Boomer myself, I am more than a little concerned about the uncertainty surrounding Social Security in the decades ahead. And the problems with U.S. debt haven’t done anything to calm my fears about the sustainability of the current program. But with a strategy like I use in my portfolio, I don’t think you have to rely on Social Security alone for your retirement income needs.

[Note: If you’re interested in starting your own “Daily Paycheck” portfolio, be sure to read the course we put together. It’s called 59 Checks a Month and it covers some of the rules — and stocks — I’ve used to build my portfolio. Visit this link to read now.]

Always searching for your next paycheck,


Amy Calistri
Chief Investment Strategist — The Daily Paycheck

P.S. — Don’t miss a single issue! Add our address, [email protected], to your Address Book or Safe List. For instructions, go here.

Disclosure: StreetAuthority owns shares of UTG as part of The Daily Paycheck’s $200,000 “real money” portfolio.  In accordance with company policies, StreetAuthority always provides readers with at least 48 hours advance notice before buying or selling any securities in any “real money” model portfolio.
Heavy News Day Coincides with Fed Testimony on Dodd-Frank

By ForexYard

Today’s market should be highly volatile and traders will want to be on guard as they traverse today’s investment landscape. The most impactful news of the day will come from both the United States and Europe which will be publishing a series of reports ranging from manufacturing, services, unemployment claims, housing and natural gas inventories. Fed Chairman Bernanke will also be giving testimony about the Dodd-Frank Act which regulates financial markets in the United States.

Economic News

USD – USD Halts Climb as Risk-Taking Surges

The US dollar (USD) has experienced a rather sudden about face this week. The EUR/USD was seen moving back towards 1.4270 yesterday while the GBP/USD inched just above 1.61. Data from the American economy was largely bullish, which may have helped spark some risk-taking among investors, pulling additional capital away from the greenback.

The potential for the passage of a deficit reduction plan proposed by a bipartisan group called the “Gang of Six” has also helped boost this week’s market optimism. With increased market volatility on today’s forecast this momentum may find additional weight as a long series of reports get published out of Europe and the United States throughout the trading day. Most importantly, the US economy will be publishing a string of reports concerning unemployment, manufacturing, housing, and natural gas storage.

Federal Reserve Board Chairman Ben Bernanke is also due to testify on the implementation of the Dodd-Frank Act today, which was passed to further regulate financial markets. Should today’s news foreshadow a continuation to this week’s bullish outlook, there is a possibility that more investment will get pushed towards the higher yielding assets like the EUR, leading to a weaker USD over the coming days.

EUR – Euro Zone Flash Manufacturing and Services Data on Tap

The euro (EUR) has been trading bullish these past several trading days on recent shifts in investor risk appetite. The EUR was able to get some relief yesterday after a surge in optimism led investors to begin taking on more risk and expanding their outlook for additional growth this year. The catalyst was strong earnings statements by several large firms, as well as stable growth in the American and Canadian housing markets.

The news has been positive for risk taking, as was much of the data released by the American economy ahead of Bernanke’s testimony later today. The EUR moved above 1.4260 against the USD before the market came to a close yesterday, but it continues to struggle against its regional currency counterparts, particularly the British pound sterling (GBP). With flash manufacturing and service data on tap today, forex traders should receive ample news to fill in part of the growth outlook which is missing for the month of July.

Today’s market should be highly volatile and traders will want to be on guard as they traverse today’s investment landscape. The most impactful news of the day will come from both the United States and Europe which will be publishing a series of reports ranging from manufacturing, services, unemployment claims, housing and natural gas inventories. Bernanke’s testimony will also likely have a heavy impact on forex values today as he is set to speak about legislation regulating the financial markets in the United States.

JPY – Japanese Yen Mixed as Traders Assess Risk Landscape

The Japanese yen (JPY) was seen trading with largely neutral results versus most other currencies yesterday following this morning’s less-than-surprising data reports by the Bank of Japan (BOJ). As was reported this week, regional growth in the Pacific has been only mildly better than forecasts, and in several instances worse. The Australian dollar (AUD) was seen in decline for the past two weeks after several data sets revealed an economic slump was underway; though it has regained some of those losses in the past two days.

This week’s news has so far strengthened the higher yielding Pacific currencies like the Kiwi and Aussie, fueled by improvements to fundamental data from the world’s leading economies and a general sentiment of risk appetite among investors. With this morning’s release of Japan’s trade balance data, many were expecting the island nation to begin addressing its growth outlook. As the JPY begins to take losses from external factors affecting its value, primarily a return of risk appetite, traders appear to be awaiting further news later today to more accurately gauge the direction that lies ahead for global risk sentiment. The JPY could be set to make gains if today’s reports come out worse than forecast.

Oil – Oil Price Shifts Mildly Higher as Traders Anticipate Growth

Crude Oil prices found support near $97 a barrel Wednesday as sentiment appeared to favor a mild growth in global industry alongside a potential uptick in demand for the black gold. Data releases out of the US and China this week have been driving many investors back into riskier assets as most reports suggested a surprise flattening out in growth among global industrial output and consumer spending.

As investors sought higher yields, the value of crude oil, which has been seen swinging widely all week, in fact rose to a weekly high of $98.35 a barrel. A sudden slump in dollar values due to this week’s earnings reports and housing data has helped lift oil values. The value of oil, therefore, found modest support and began to make strides. If this sentiment can persist, the value of Light, sweet crude may continue to gain through the rest of the week, targeting $100 a barrel.

Technical News

EUR/USD

After a gapping lower to start last week the pair moved below the 200-day moving average and on the subsequent rebound the EUR/USD found resistance at its 100-day moving average, a previous level the pair struggled to close below between the months of April and July. While the rebound higher was sharp the failure of the pair to move above the 100-day moving average and to close above the opening gap signals weakness in the pair. Initial support is found at last week’s low at 1.3870 followed by the rising trend line from the June 2010 low which comes in at 1.3750. A break here is significant as it would compromise the long term uptrend for the euro, exposing the 50% retracement level at 1.3410. To the upside last week’s high at 1.4290 is the first resistance followed by the falling resistance line from the May and July highs at 1.4490.

GBP/USD

The GBP/USD price collapsed only to find support at the 38% retracement level of the May to April move at 1.5780 while the rebound higher was capped at the neckline from the head and shoulders reversal pattern. Positive divergence is found on the RSI-14 as the price made a new low but the RSI did not. This signals a potential warning sign for sterling bears. Resistance is located at 1.6230 off of the falling trend line from the April high. Above this level the previously broken trend line from the May to April move at 1.6330 will come into play. To the downside a break of 1.5780 would signal a resumption of the downtrend and would target 1.5650 which has served as both support and resistance in October and in December of last year.

USD/JPY

The USD/JPY downtrend resumed with a vengeance last week as the pair broke below the 80 yen “line in the sand” and the support from May 5th at 79.55. This level has now turned into resistance as often happens to previously broken support levels. Only last week’s low at 78.46 and the bottom of the long term wedge from Sept 2004 at 77.60 stands in the way of the all-time low at 76.11.

USD/CHF

The Swissie has moved in one direction and one direction only. The pair made a halfhearted attempt close above its 50-day moving average and moved sharply lower from there setting a new all-time low at 0.8082 which serves as the initial support level. Any move higher may find resistance at 0.8275, the falling trend line from the February high which comes in at 0.8450, and 0.8550.

The Wild Card

Oil

The latest congestion pattern on the daily chart for spot crude oil prices has formed a triangle chart pattern. Resistance from the consolidation pattern comes in at $99, followed by $100 and $104.40. Forex traders should note that a break of the support at $95 would likely test the June low at $89.60.

Forex Market Analysis provided by ForexYard.

© 2006 by FxYard Ltd

Disclaimer: Trading Foreign Exchange carries a high level of risk and may not be suitable for all investors. There is a possibility that you could sustain a loss of all of your investment and therefore you should not invest money that you cannot afford to lose. You should be aware of all the risks associated with Foreign Exchange trading.

Central Bank of Brazil Lifts Selic Rate 25bps to 12.50%

The Banco Central Do Brasil increased the Selic interest rate by 25 basis points to 12.50% from 12.25% previously.  In its statement, Brazil’s Central Bank Monetary Policy Committee (Copom) said: “evaluating the prospective scenario and the balance of risks for inflation, the Copom decided, unanimously, at this moment, to raise the Selic rate to 12.50% p.a., with a neutral bias.”  The statement dropped the use of the words “prolonged period” in terms of adjusting monetary conditions, suggesting the Bank may be near an end to its tightening cycle.


Brazil’s central bank also raised the Selic rate by 25 basis points to 12.25% at the June Copom meeting this year.  Brazil reported an annual inflation rate of 6.71% in June this year, up slightly from 6.55% in May, and just out side the official inflation target of 4.50% +/-2% (2.5-6.5%).  The Brazilian government is forecasting economic growth this year of 4.5-5%, compared to GDP growth of 7.5% during 2010.  The “BRIC” emerging market economy grew 1.3% q/q in the March quarter, placing annual growth at 4.2%.

The Brazilian central bank also made headlines earlier this month when it announced further measures to discourage dollar shorting in order to cap a persistent rally of its currency, the Real.  The central bank will require that banks with short US dollar positions hold 60% of the value of short positions greater than $1 billion in non-interest bearing deposits at the central bank.  The Brazilian Real has appreciated 20% against the US dollar over the past two years.

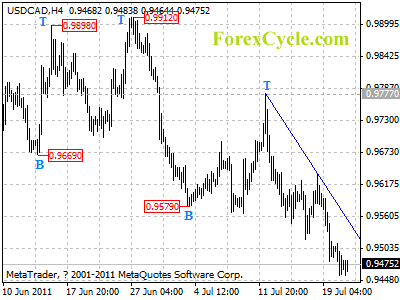
USDCAD stays below a trend line

USDCAD stays below a falling trend line on 4-hour chart, and remains in downtrend from 0.9777. further decline to test 0.9444 support could be seen later today, a breakdown below this level will indicate that the long term downtrend from 1.0852 (2010 high) has resumed. Resistance is at the downtrend line, only a clear break above the trend line could indicate that the fall from 0.9777 is complete.

usdcad

Daily Forex Forecast

Dombrovskis on Plan to Join Euro in 2014

July 21 (Bloomberg) — Latvia’s Prime Minister Valdis Dombrovskis discusses the country’s plan to adopt the euro in 2014. Dombrovskis spoke with Bloomberg News during an editorial board meeting in New York today. (This is an excerpt of the full interview. Source: Bloomberg)

Daily Wrap: 7/20/2011

Discouraging economic news from the housing sector was offset by positive earnings results, but it wasn’t enough for the markets to hold on to yesterday’s gains. Existing home sales took a tumble in June, down 0.8 percent, marking a 7-month low, according to the National Association of Realtors.

Crowd Behavior moves Gold, Silver and SP 500…not the News!

David Banister- www.MarketTrendForecast.com

How many times have you scratched your trading head wondering why gold or silver were either rallying hard or dropping hard on seemingly bearish or bullish news? How about the general stock market represented by the SP500 Index? Has it ever rallied when the headlines were horrible or tanked when the news seemed good? Well, welcome to crowd behavioral dynamics and investing!

At my TMTF service, I use Elliott Wave Theory combined with a few other indicators like sentiment gauges and Fibonacci relationships to forecast the coming bottom and top pivots in Gold, Silver, and the SP 500 indexes in advance. In doing so, I often ignore the day’s headlines completely and rarely if ever use them to forecast the next movements in the precious metals or broad stock markets.

Let me give some examples of why you should learn to ignore economic indicators, headlines, and talking heads on CNBC and elsewhere and focus on crowd behavioral patterns. Learning to scale in long when everyone is getting bearish and taking profits when everyone is universally bullish is much easier if you follow Elliott Wave Theory, and apply that theory correctly. If the matter between your ears is unabashedly biased, it will not work… one must be objective and open minded to change to survive these volatile markets.

Recently with Gold, we had a major drop from $1557 to $1482 over brief window of time. When I last wrote about Gold several weeks ago publicly, I presented a bullish and a bearish case. I had said Gold must close over $1551, otherwise it may have a truncated top and correct hard. Sure enough, a few days later Gold hit $1557 intra-day and could not get over $1551 on that close. Within days it collapsed and dropped below $1500. How did I know this in advance? Crowd Behavioral Patterns are repeated throughout the markets over and over again and again. Here is the original chart I sent out many weeks ago showing the possible drop:

Gold did end up dropping to the 20 week Exponential moving average at $1480 range, and as it did I noticed a clear “ABC” weekly pattern. Now this is an Elliott Wave pattern that can warn you of an imminent bottom in Gold in this case. In late June, after this major correction I wrote up another chart and showed a potential bottom coming in Gold around 1480, and then on July 5th I confirmed the Bull views on Gold were coming back into play, which you can see with the June 29th chart I did below for my TMTF subscribers:

We were able to adjust our views from short term bearish to moving back to bullish and still catch the big swing in Gold. The precious metal rallied from $1480 ranges to $1610 recently, and now is likely to go through a minor correction to $1568 or so. All of this is the crowd’s action together pushing positions into overbought stages of hysteria, and back to oversold stages of pessimism…I simply track those patterns and try to forecast the next move ahead of the crowd running in or out.

Another sample is Silver as it collapsed from $49 down to $32-$33 per ounce not long ago. After the dust settled I sent out a chart and told my TMTF subs we would likely see Silver trade in the $34-$41 range for quite a while, before mounting another attack back towards $50. Right now I see Silver soon running to $45-$47 per ounce once it takes a breath. Below is the original early June silver chart I sent to my TMTF subscribers: We had an ABC strong rally which we forecast at TMTF in late August 2010 ahead of time, and once those rallies are over it takes quite a while to work off the sentiment.

Silver has indeed consolidated as forecast for about 7 weeks now between 34-41, having recently hit $40.80 and backed off. I expect Silver to break out over this range soon and attack $60 by year end as possible, but certainly $46-$50 by the fall. Last Wednesday I finally went bullish again based on crowd patterns and told my subs to go long at $37 as you can see below in the chart sent out then with a target of $46 likely coming. The herd of investors had formed yet another ABC weekly pattern, and it was time to go long.

Finally we look at the SP 500 which I forecast on a regular basis as well using Elliott Wave Theory and other indicators. This past week or so we saw a huge drop in the SP 500 and broader markets supposedly on Italy concerns and Eurozone issues. Although I am well aware of these issues, they are used to explain what just happened in the stock market, but not forecast it. Late last week I sent out the chart below to my subscribers and said as long as 1294/95 pivot holds, I remain very bullish on the markets. The SP 500 hit 1295 and has since rallied 31 points in a few days catching everyone off guard. That is Crowd Behavior 101 if I ever saw it!

The bottom line is understanding that the precious metals and broader markets tend to move based on major swings in sentiment from optimistic to pessimistic. The collective psyche of the herd is the most important because we can have periods of very bad news where the market will continue to rally, and also periods of seemingly great news when the market is dropping. The perception of the news of the day and how the crowd decides to react is more important than the news itself!

If you’d like to try the TMTF service and take advantage of a coupon as well, go to www.MarketTrendForecast.com and check us out. You can also sign up for an occasional but somewhat infrequent free reports.

The Profit Protection Tool No One Wants You to Know About

call optionsNote from Managing Editor Sara Nunnally: It’s a good day when Smart Investing Daily uncovers a tool the bigwigs don’t want you to know about. And we only had to look in our own backyard to find it.

This week’s guest article comes from Zach Scheidt, editor of Taipan’s New Growth Investor. One of the biggest myths about long-term investing is that you can only go long by buying and holding stocks.

That’s just not true.

Zach explains one strategy that can boost your portfolio returns while decreasing risk of losses.

It’s part of our new”Smart Investment Strategies” edition of Smart Investing Daily. We want to link your investment questions to our investment experts. And we’re inviting you to send us your investment questions. Your topic could be featured in our weekly Smart Investment Strategies article.

Email us at [email protected], and enjoy this first edition that can really give you an edge in the markets.

More Income, Less Risk…

Looking to get a little more out of your investment portfolio? Who isn’t, right?

Today I want to tell you about a strategy many hedge funds use to make and protect profits. Using this tool (which is available to nearly every investor but very rarely used by individuals), the funds are able to create additional income from stocks they own — while at the same time, limit the amount of risk for their overall portfolio.

Sound too good to be true? This is no gimmick. It takes a little work, and just like with any tool, you have to invest a little time to learn to use it properly.

But when it’s used well, the returns can add up quickly.

Institutional investors would probably rather you didn’t spend your time learning how to create this additional income. They would prefer you look at them with reverence and believe that they have an edge that isn’t available to you as an individual investor.

But it’s not true. During my time as a hedge fund manager, I learned how to use a number of tools that can increase investment returns and manage risk more effectively. But none of these strategies are off-limits to smart investors with a personal brokerage account.

Ready to take a look at how this tool boosts income and cuts risk? Let’s jump in!

Covered Calls — A New Growth Investor Strategy

Today we’re going to look at how covered calls can be an excellent strategy for a portfolio of stocks that you already own.

Let’s say that in September 2010, you took my recommendation to buy Allied Nevada Gold Corp. (ANV:AMEX), and you picked up 200 shares at $22.64. Today, those shares trade close to $40 per share.

A 75% gain in less than a year is an impressive return. If you’re like me, when you start seeing that kind of gain, you start to think about how you can protect those profits. The”covered call” strategy is a great way of preserving those profits and capturing additional gains on this trade, even if the stock declines.

To explain how this strategy works, let me first explain how a”call option” works.

(Don’t forget to sign up for Smart Investing Daily and let regular editors Sara Nunnally and Jared Levy simplify the market for you with our easy-to-understand articles.)

Call Options — The Right to Buy

A call option is a contract between a buyer and a seller — and typically represents an agreement on 100 shares of stock. The call option gives the buyer or owner of the option the right but not the obligation to buy 100 shares of stock at an agreed-upon price.

There are three key points of information that a call option covers:

  1. Security — What stock is actually covered by the contract?
  2. Strike price — At what price is the contract actionable?
  3. Contract Date — When can the contract be exercised?

So if you are convinced that a $50 stock (XYZ) is going to rise sharply between now and the end of the year, you might buy a December $60 call. One call option would give you the right to buy 100 shares of XYX at $60 through the third Friday in December.

(Typically, options can be exercised through the third Friday of their contract date. This is also called the expiration date.)

If the stock rallies to $80, you are still able to buy that stock for $60. After all, that’s in the terms of the contract. If you are wrong, and the stock drops to $10, the only thing that you lose is the cost of the option.

You can see why aggressive traders like to buy call options. If your market calls are correct, you can make a lot of money in a very short amount of time. But today we’re not talking about buying call options — we’re actually talking about selling them… That’s how the covered call strategy works.

Selling Calls Against Our Stock Position

Back to my example of Allied Nevada Gold Corp… As I write, the September $40 calls are trading at about $3.

What this means is you can sell someone the right to buy ANV shares from you for $40 per share. When you sell that right, you collect an additional $3 per share. If you have 200 shares, you could sell two contracts and receive $600 for offering this right to another trader.

This is what a”covered” call means… It means that you own enough stock to be able to fulfill your contract with the options buyer. In other words, if you promised someone they could buy three bags of oranges at $3 a piece, you’d better have three bags of oranges when your buyer comes calling.

But let’s get back to ANV.

If ANV trades higher from here, you are still obligated to sell your shares at $40. But you get to keep the $3 per share you received when selling the call. That $3 is equal to an extra 13% from your original purchase price last year.

Of course, if ANV finishes below $40 on the third Friday of September, you get to keep your stock as well. In fact, at that point, you might turn around and sell December calls in much the same way, and collect more income for the same stock position.

Steady Returns Can Add Up Impressively

Covered call positions were some of our best moneymakers at the long/short fund I managed. We would typically buy a few thousand shares of different stocks that we believed had a good chance of trading higher (or at least not trading lower), and then we would sell covered calls against that stock.

Over a period of two months, a typical call option will give you only a modest percentage return. For instance, if you were to buy ANV today at $40, and sell the $40 calls at $3, you would be locking in a 7.5% return over the next 60 days. That sounds a bit boring, right?

But what if you could generate 7.5% during every 60-day period over the course of a year? The compound annual returns would add up to 54%! And this is in a stock portfolio that actually holds less risk than a typical account that doesn’t use covered calls.

The covered call strategy is just one of the hedge fund tools that I am teaching subscribers to my New Growth Investor to use. These hedge fund tools offer plenty of ways for investors to cut back on their risk, add to returns, and create a stockpile of wealth — even in a turbulent market!

Wall Street institutions may think that they’ve got a lock on the smart investing market. But my goal is to make sure that individual investors are able to trade on a level playing field and understand how to use all of the tools available to protect and grow wealth.

Publisher’s Note: Zach’s track record through the first half of the year is incredible… an average closed position worth 86.5%. To see what other tricks our former hedge fund boss has up his sleeve, follow the link.

Article brought to you by Taipan Publishing Group. Additional valuable content can be syndicated via our News RSS feed. Republish without charge. Required: Author attribution, links back to original content or www.taipanpublishinggroup.com.

{loadposition sidarticles}

{jtagstpg} {authorstpg}

Other Related Sources:

  • The Secret Tactic of a Hedge Fund Manager
  • Buying Gold Future Call Options… Notes For Beginners (Like Me)
  • Are SPY Options Signaling a Market Rally?