ADRs: An Easy Way to Invest in International Stocks

An Easy Way to Invest in International Stocks

by Carl Delfeld, Investment U Senior Analyst
Monday, June 27, 2011

As interest in investing in overseas markets has grown, so has interest in foreign stocks listed on US exchanges. These are known as American Depository Receipts or ADRs for short. Let’s learn a bit about how they work, the benefits to you as an investor.

ADRs which are certificates issued by a U.S. bank representing shares in a foreign stock that is traded on a U.S. exchange. Sounds complicated but ADRs are actually designed to make investing in overseas companies easy.

They are not some new fangled financial invention. JPMorgan created the first depositary receipt in 1927 for UK retailer Selfridges. There are now almost 2,000 ADRs from over 80 countries listed on NYSE, AMEX or NASDAQ exchanges.

But, as we shall learn, not all are equal.

The growth of ADRs during the last 25 years has been impressive. ADRs now account for more than 15 percent of the value of the entire U.S. stock market.

In America alone, the level of investment in foreign equities exceeds $2 trillion, reflecting 100-fold growth since 1980. One good example is British Petroleum (BP). In many ways, it is more an American than British are. It is the largest producer of oil and gas in the U.S. and over the past five years has invested more than $30 billion in U.S. energy projects. In addition, Americans own around 40 percent of BPs shares.

Foreign companies like ADRs because they get more U.S. exposure, allowing them to tap into the wealthy North American equities markets to raise capital and broaden share ownership at the same time.

Here is a quick primer on ADRs.

What are the benefits of ADRs?

  1. Denominated in U.S. dollars and depositary bank will convert any dividends or other cash payments into U.S. dollars before sending them to you
  1. Offer a cost-effective way to buy shares in a foreign company and avoid foreign taxes on each transaction.

However, keep in mind that ADRs do not eliminate the currency and economic risks that go along with investing in another country. For example, dividend payments in euros would be converted to U.S. dollars, net of conversion expenses and foreign taxes and in accordance with the deposit agreement. This has been a welcome feature for the last few years, as the U.S. dollar has declined relative to most major currencies but it could go the other way as well.

Are All ADRs equal?

It is important that investors realize that there are three different types of ADR issues which have different SEC reporting requirements:

  • Level 1 – This is the most basic type of ADR where foreign companies either don’t qualify or don’t wish to have their ADR listed on an exchange. Level 1 ADRs are found on the OTC market. Level 1 ADRs also have the loosest requirements from the SEC.
  • Level 2 – This type of ADR is listed on an exchange or quoted on Nasdaq. Level 2 ADRs have slightly more requirements from the SEC.
  • Level 3 – The most prestigious of the three, this is when an issuer floats an offering of ADRs on Nasdaq or the NYSE.

Once an ADR is priced and sold on the market with its price is determined by market forces just like an ordinary stock. ADRs tend to follow the general trend of the home country shares, but this is not always the case. Sometimes they can be a bit more expensive than the dollar value of their home shares.

Are ADRs still Growing?

As global trading platforms have become more sophisticated with lower trading costs, most U.S. institutional investors now invest in foreign shares directly from overseas exchanges. In addition, the costs and legal burdens of listing foreign shares as US exchange-listed ADRs has also become a burden.

This has led to 83 foreign firms delisting from the NYSE since 2007 including Germany’s Deutsche Telekom, insurer Allianz and Daimler as well as U.K.-based Cadbury and British Sky Broadcasting, France’s Axa, Mexico’s Telmex, Spain’s Repsol and India’s Satyam Computer Services. Nasdaq reports that 51 foreign firms have delisted over this period as well.

Many of these companies have moved their listings to the lower cost and less regulated OTC market. I refer to these companies as “Pink Sheet Blue Chips.”

ADRs remain the easiest way for investors to tap the growth of international companies but not all are equal. Pay careful attention to where they are listed and trading volume to avoid any surprises.

Good investing,

Carl Delfeld
E-Mini Trading: Trading in “Barbed Wire”

By David Adams

One of the toughest times to initiate an e-mini trade is when the market is going sideways. During these periods of time the Average True Range on the YM contract is very low and the market movement is cramped and indecisive. On the other hand, millions of e-mini contracts exchange hands during these low volatility periods, for inexplicable reasons. The thesis for this article is a simple one; what should an e-mini trader do, or not do, when the market has entered a “barbed wire” phase?

I am the first to admit that the single most frustrating period of trading occurs when the market trades in a very tight range. To make matters worse, it is not uncommon for the e-mini market to become range bound for extended periods of time. This trading is typified by very slow market movement edging one tick to the positive side, a couple of ticks to the negative side, and then return two ticks to its original starting position. During these periods of time it seems the market might never move again, which we know is untrue. A careful look at the volume during these periods will indicate that active trading and is still underway, absent the large volume traders. Generally speaking, the smart money is on the sidelines when the action is range bound.

Often times during these congested periods of trading it is common to see reasonably long shadows, or wicks, on the channel candlesticks. (Hence the name barbed wire.) To my amazement, the individuals in my trading room often times become excited about potential trades during periods of barbed wire. (These are times when I envision myself as a complete failure.) I can think of no lower probability trade than one that originates in a barbed wire channel. Still, a great number of smaller traders initiate trades in the channel in the hopes of a breakout or breakdown. As we will discuss, most breakouts and breakdowns originating in a barbed wire channel are destined to fail, though they attract a decent number of traders prior to the breakdown.

Let’s talk about breakouts and breakdowns from a range bound market for a moment. It is not unusual to see an attempt at a breakout or breakdown from a channel and the movement out of the channel can appear initially to be very robust. This rapid movement out of the channel will attract a good number of smaller traders. Unfortunately, the majority of these channel breakouts fail in short order and return to the channel, leaving a good number of small traders deeply disappointed. The same can be said for both breakouts and breakdowns. The channel sometimes seems to be a black hole, because it often stymies breakouts and breakdowns and sucks the price movement back into the channel.

On the other hand, these false breakouts and breakdowns create one of the few good trades in the channel. One of the trades I enjoy taking with relatively low risk is entering a breakout or breakdown out of the channel in the opposite direction of the price action. In my mind, I am relatively sure in most cases that the market action will quickly return to the channel and I can pocket 8 to 10 YM points with very little risk. On this particular trade though, I run a very tight stop. The reason I run such a tight stop is because there is a remote possibility that the market may indeed breakout and I do not want to participate on the wrong side of such a breakout or breakdown. But I would say that a true breakout or breakdown out of a channel is a rare event and I make this trade with a high level of confidence. I let the little guys drive the price action well out of the channel and then take advantage of the ensuing price fade back into the original barbed wire channel. After a number of these failed breakouts, it is a good idea to be wary of an actual strong move onto the channel and trade accordingly. Let’s face it, the channel will not go on forever, and as time passes the likelihood of a very real breakout increases.

In summary, we have talked some about barbed wire channel formations and generally recommended that traders sit on their hands during these periods of time. We have noted that most of the breakouts and breakdowns out of the channel tend to fail, so it is generally a bad idea to get excited and initiate a trade when the market breaks out of the channel. On the other hand, I have mentioned that I often trade the fade back into the channel after a failed move out of the channel.

About the Author

Real Live Trading Doesn’t Lie. Spend several days in my trading room and see if you can benefit from a fresh and unique view on trading e-mini contracts. Sign up for your free trading experience by clicking here

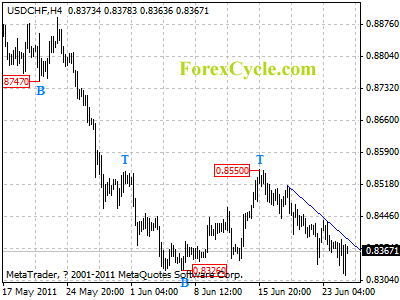
USDCHF broke below 0.8326 previous low

USDCHF broke below 0.8326 previous low and reached as low as 0.8315. Resistance is at downtrend line on 4-hour chart, as long as the trend line resistance holds, downtrend from 0.8550 could be expected to continue, and next target would be at 0.8200 zone. However, a clear break above the trend line resistance will indicate that lengthier consolidation of the long term downtrend from 1.1730 (2010 high) is underway, then further rally could be seen to 0.8650.

usdchf

Forex Forecast

Forex: Large Currency Speculators decrease Dollar shorts. Yen longs rise

By CountingPips.com

The latest Commitments of Traders (COT) report, released on Friday by the Commodity Futures Trading Commission (CFTC), showed that large futures speculators decreased their short positions against the US dollar as of June 21st. Non-commercial futures positions, those taken by hedge funds and large speculators, were overall net short the US dollar by $17.05 billion against other major currencies as of June 21st, according to a report published by Reuters. The data is a decline from the total short position of $25.14 billion registered on June 14th, according to the CFTC COT data and calculations by Reuters which calculates the dollar positions against the euro, British pound, Japanese yen, Australian will dollar, Canadian dollar and the Swiss franc.

This week’s notable changes were Japanese yen positions rising to their highest level since March while Canadian dollar positions fell to their lowest level since September 2010.

EuroFX: Currency speculators decreased their net long positions for the euro against the U.S. dollar for a second straight week. Euro futures positions declined to a total of 29,771 long contracts as of June 21st following a total of 49,894 long positions on June 14th.


The COT report is published every Friday by the Commodity Futures Trading Commission (CFTC) and shows futures positions as of the previous Tuesday. It can be a useful tool for traders to gauge investor sentiment and to look for potential changes in the direction of a currency or commodity. Each currency contract is a quote for that currency directly against the U.S. dollar, where as a net short amount of contracts means that more speculators are betting that currency to fall against the dollar and net long position expect that currency to rise versus the dollar. The graphs overlay the forex spot closing price of each Tuesday when COT trader positions are reported for each corresponding spot currency pair.

GBP: British pound sterling positions declined over to the short side as of June 21st after previously improving for three straight weeks. Pound contracts decreased to a total of 11,360 net short positions as of June 21st following a total of 11,226 long contracts on June 14th.


JPY: The Japanese yen net contracts rose for a third consecutive week to a total of 32,594 net long contracts reported on June 21st following a total of 24,768 net long contracts on June 14th. This is the highest total for yen positions since March 22nd when contracts totaled 34,525.


CHF: Swiss franc long positions decreased for a third straight week as of June 21st. Franc positions fell to a total of 11,813 net long contracts following a net of 13,287 long contracts on June 14th.


CAD: The Canadian dollar positions decreased last week and fell to the lowest level since September of 2010. CAD positions decline to a total of 2,204 long contracts on June 21st following a total of 18,855 long contracts on June 14th.


AUD: The Australian dollar long positions fell on June 21st after rising higher for four consecutive weeks. AUD contracts decreased to a total net amount of 54,571 long contracts as of June 21st. AUD positions had totaled 67,670 net long contracts on June 14th.


NZD: New Zealand dollar futures positions dipped last week after rising for four consecutive weeks and to the highest level all year. NZD contracts declined to a total of 18,849 long positions as of June 21st from a total of 19,218 long contracts on June 14th.


MXN: Mexican peso net long contracts decreased for a fourth straight week to the lowest level since September 2010. MXN contracts fell to 41,423 net long contracts as of June 21st from a total of 48,163 long contracts as of June 14th.


COT Data Summary as of June 21, 2011
Large Speculators Net Positions vs. the US Dollar

EUR: +29771
GBP: -11360
JPY: +32594
CHF: +11813
CAD: +2204
AUD: +54571
NZD: +18849
MXN: +41423


How to Spot Trading Opportunities — complimentary 47-page eBook

Elliott Wave International has released a free 47-Page eBook, How to Spot Trading Opportunities. Created from the $129 two-volume set of the same name, it’s available free until July 6. Learn more.

Dear Trader,

What if you could look at a chart and see the potential trading opportunities?

Elliott Wave International (EWI), the world’s largest market forecasting firm, has just released a free eBook to teach you exactly that. How to Spot Trading Opportunities features 47 pages of easy-to-understand trading techniques that help you identify high-confidence trade setups. Senior EWI Analyst Jeffrey Kennedy will show you how some of the simplest rules and guidelines have some of the most powerful applications for trading.

Created from the $129 two-volume set of the same name, this valuable eBook is offered free until July 6.

Don’t miss out on this rare opportunity to learn how to find opportunities in the markets you follow.

Download How to Spot Trading Opportunities now.

About the Publisher, Elliott Wave International:
Founded in 1979 by Robert R. Prechter Jr., Elliott Wave International (EWI) is the world’s largest market forecasting firm. Its staff of full-time analysts provides 24-hour-a-day market analysis to institutional and private around the world.

Professional Traders Who Are Serious At Making Profits Know Exactly How To Use Forex Signals

By Cedric Welsch

The forex market is complex and volatile. Both beginning and advanced traders benefit from forex signals. Signals are suggested trades based on set parameters, like entry price, stop loss, or take profit.

A forex signal service is not a managed account. It is up to the end user to manage parameters and to make the actual trades. The signal service provides traders with information and suggestions. The user analyzes the numbers and acts. Providers usually stick to one or two pairs of currency. Different services also cater to different trading types. A long-term trader, for instance, might choose a different signal provider from a day trader.

Signals are delivered in a variety of ways. They can be delivered through a chat room or forum. They can also be delivered through email, text message, or Tweet. Some providers even send them through a specially customized pager.

A good program fits the needs of the user. First, it fits the user’s budget. Services can either be free, available through a subscription, or available as a one-time purchase. Second, it alerts users the right way, at the right time. If a user works full-time, for instance, he or she may choose email alerts. The alert can come directly to the user’s inbox at work, allowing the user to act on trades during the day. Good programs always come with a trial period or a money-back guarantee.

Before committing to a service, it’s important to know some facts. Most importantly, know the track record of the expert trader or the robot who is generating the alerts. Know this before handing over any money for a service. Also, know how much can be risked per trade. For long-term success, do not risk more than three percent of the account balance on any trade.

Signal services are either automated or deployed by a live trader. Automated services are best for beginners. They are also good for people who want to be in the forex market but do not have a lot of time to commit to analysis. With minimal effort, they keep traders up-to-date with the market and show any interesting deals that are available.

Live trader services are good for advanced traders. Live signals are sent by a broker or by another trading expert. Many times, these individuals operate within a chat room or forum. This allows traders to watch them make trades in real time.

Low-maintenance doesn’t mean no-maintenance. Users should still follow market events and indicators. They should also adjust their stop loss and take profit settings daily. However, for the most part, forex signals give investors the chance to make maximum money with minimal effort.

About the Author

It is about time that beginning traders do forex research in a way that would much professionals.
The debilitating impact of scams is just unacceptable, that is why traders need a forex scam review.

Financial Lessons from an African Dictator

Financial Lessons from an African Dictator

by Rich Checkan, Investment U Contributor
Friday, June 24, 2011: Issue #1542

[Editor’s Note: Richard Checkan is one of the smartest investment minds I know. The Vice President of Asset Strategies International, Rich has often contributed unique moneymaking insights to Investment U. His specialty: building wealth using gold, silver and other hard assets. Today’s piece is one of his most provocative… and potentially valuable. ~ Garrett Baldwin]

Core holdings.

These represent your emergency finances. Your ace in the hole – the gold and silver (and maybe some platinum) that you hope you never have to use, but thank the heavens you have if you do. They are your bridge across social, political and economic chaos. And the world is full of chaos.

With Libya now looking like America’s third war in little more than a decade, it’s hard to imagine what the people of Tripoli are doing in order to make ends meet with the country burning around them. I was reminded of the importance of core holdings recently when I saw a Financial Times article about Libya’s beleaguered dictator, Col. Moammar Gadhafi.

The article explained that Gadhafi had only one hope of financing his war against the insurgents who were threatening to topple his regime. He couldn’t borrow the money. He couldn’t even access funds Libya had moved abroad. His accounts were frozen worldwide…

Gadhafi Saved By Libya’s Core Holdings in Gold

His only source of funds was his “core holdings” – the gold that he had stored at the Libyan Central Bank. While most central banks store their gold in London, Switzerland, or New York City, this is not the case with Libya. Gadhafi had always insisted that Libya’s gold be stored at the Libyan Central Bank in Tripoli.

We’re not talking about some coins or bars tucked away in a safe-deposit box, by the way. Libya’s gold holdings rank in the top 25 in the world. It is estimated that the bank is sitting on roughly 144 tons of the world’s oldest and best form of money. At today’s prices, that is $6.5 billion worth of the yellow metal. That may only represent a few minutes worth of government spending in this country; but in Libya, it’s enough to finance a war.

So while no legitimate business or government will loan Gadhafi money now, or even trade with him, his hoard of gold may be the answer to his financial needs. He can use it to acquire currency, arms, food and other supplies for his military.

Wealth Insurance: Core Holdings of Gold and Silver

As I read the article, I was struck by this real-world example of the message we have preached so many times: When markets are volatile, you need some “core holdings” of gold and silver. There is simply no better “wealth insurance” than having precious metals as part of your portfolio.

  • We saw the value of gold as emergency money when the Vietnamese refugees fled South Vietnam in the 1970s.
  • We saw it repeated when South Korea emerged from the Asian currency crisis several years ago. Gold helped them rebound faster than most other countries from the Asian flu.
  • We saw it in this country when the stock market tumbled. In many cases, margin calls could only be met by the liquidation of gold and other precious-metals holdings (which, by the way, maintained their value while paper assets were crumbling).

Time and time again, we have seen the value of gold as wealth insurance. Granted, almost every cause is nobler than that of Libya’s dictator. In good times and bad (and for good guys and bad), throughout history the role gold can play in solving a financial emergency is well-documented.

A Liquid Store of Value for Financial Emergencies

Simply put, gold is a store of value, in a liquid form, for a financial emergency that you pray you never have. You buy it and you hold onto it regardless of price fluctuations. If you have a financial emergency, you sell the gold to meet those obligations. That’s what it is there for.

And successful investing begins by conceding that – to a degree – uncertainty will always be your companion. That’s why it’s critical that you have a sound strategy that does more than just “diversify.”

The Investment U Asset Allocation Model provides a sound philosophy that helps you invest in an array of domestic and foreign stocks, bonds and precious metals. Doing this has allowed us to survive, prosper and build our wealth during the longest bear market since the Great Depression.

And precious metals are an important part of your portfolio. You don’t need an African dictator to remind you of that…

Good investing,

Rich Checkan

Editor’s Note: For more information about core holdings, email Rich Checkan at [email protected] or call 800.831.0007. When you write or call, be sure to ask for a free subscription to ASI’s weekly alerts and monthly newsletter, Information Line. They won’t cost you a penny.

With Oil Falling, Now’s the Time to Strike

With Oil Falling, Now’s the Time to Strike

by Matthew Carr, Investment U Research
Friday, June 24, 2011

What a rough month for oil…

Oil was already on a slide – down 16 percent in two weeks. Then the International Energy Agency (IEA) announced it’s releasing 60 million barrels of oil from its Strategic Petroleum Reserve. On top of Federal Reserve Chairman Ben Bernanke stating that U.S. economic growth is slowing. The two pieces of news stepped up the shelling of crude prices.

West Texas instantly slid four percent. And the speculative benchmark Brent fell even further.

But that’s okay.

Because this is a tremendous window of opportunity for investors. Don’t run away from the oil sector – embrace it…

Despite High Oil Prices, Exploration and Production Increasing

In its most recent Global E&P Spending Survey, Barclays Capital reports that worldwide oil exploration and production (E&P) spending will top $500 billion in 2011. An historic high-water mark. And a 16 percent increase over last year.

Despite high oil prices, the world still needs the commodity.

The U.S. Energy Information Administration (EIA) estimates world oil consumption will top 88.4 million barrels per day this year – a 1.7-million-barrel-per-day increase over 2010. Of course, of that per day increase, China accounts for 700,000 barrels.

We all know economic expansion drives oil demand. China’s economy will grow another 9.6 percent this year. And its oil demand will increase another 550,000 barrels per day in 2012.

Chewing on all that information for a moment, we can already see that the IEA’s 60 million barrel release doesn’t even cover a day’s worth of oil. Especially when you factor in that the plan is to release two million barrels per day over a 30-day span.

Oilfield-Service Companies at a Bargain Price

So, armed with all of this, and crude’s retreat, it’s time to snag some oilfield-service companies at a bargain price. Let’s look at two companies:

  • Oceaneering International, Inc. (NYSE: OII)

Oceaneering International provides remote operating vehicles (ROVs) and subsea services for offshore oil and gas, specializing in deepwater plays. Revenue in its ROV, subsea products and inspection divisions all increased in the first quarter compared to 2010.

The good news is, the offshore rig count in the United States is double what it was a year ago. The Gulf of Mexico is slowly returning and deepwater drilling will continue to pick up.

But the real story is the dramatic shift in rigs drilling for oil compared to natural gas. The number of U.S. oilrigs is up 71 percent – from 574 to 984. Meanwhile, the gas rig total continues to decline. And instead of the lion’s share of rigs drilling for natural gas, the majority are now focused on oil.

As with anything, the higher the demand, the higher the price. So day rates for rigs actually now top what they were during the 2008 drilling boom.

  • Helmerich & Payne (NYSE: HP)

Helmerich & Payne’s fleet utilization is at 85 percent, averaging $25,640 per day. More importantly, it has a squadron of FlexRigs, which demand a higher day rate, and are required for working shale plays.

So, don’t run and hide from the pullback in prices right now in the oil sector. Take the opportunity to get in.

Good investing,

Matt Carr

Obama Gives OPEC Dissenters the Finger, Crude Oil Prices Could Lower

crude oil pricesFor the past two days, I’ve been driving…

I recently won an auction for a mustang — a gorgeous strawberry roan we’re calling Aesop Rye. I spent all of Wednesday towing all 1,000 pounds of him, plus the 3,500-pound trailer.

The trip was grueling, and we made plenty of pit stops along the way. But surprisingly, one of the things that didn’t bother us as much was the price of gas.

In Milwaukee, Wis., gas prices are running between $3.60 and $4. The farther south we went, the cheaper gas prices got. In Oklahoma City, just north of where we picked up Aesop, gas was going for $3.23 — more than 10% cheaper!

And gas prices could be falling even more in the next few days.

It’s all because of the big news in the crude oil sector this week. President Obama said he would release crude oil from emergency reserves. Obama, with the International Energy Agency, will put 60 million barrels of crude oil on the market.

This should send crude oil prices lower.

And gas prices will tick down right along with oil.

But talk about awkward timing… Crude oil was down to $92 a barrel earlier this week. Why didn’t the president do this last month when crude oil prices were above $113? The question is, “Why now?”

One reason could be to pressure OPEC.

The disastrous OPEC meeting last week ended in a huge split between its members over whether or not they should raise crude oil production. Saudi Arabia normally holds sway over the group, but this time, it ran up against stiff opposition.

No surprise… The reason Saudi Arabia wanted to boost production was because of demand… in six months. This has nothing to do with any supply issues right now. In fact, we’re still oversupplied with oil. Crude oil prices are still above $90 a barrel, though, and it’s campaign season.

Time to turn on the taps.

But here’s the thing.

OPEC countries willing to boost their quotas are mostly friends with the West. Saudi Arabia is an example. But those against the bump up in production are not. Like Iran and Venezuela.

That Obama chose now to release crude oil from our Strategic Petroleum Reserves is like giving the finger to the OPEC members who voted against increasing oil production.

How this move will affect those OPEC “mavericks” who voted against the increase in production? From The Daily Ticker:

For true conspiracy theorists, the thinking goes like this: When the Fed downgraded its estimate of the U.S. economy and 2012 employment Wednesday, the White House went into panic mode. In order to get Bernanke’s dour outlook off the front page, Obama announced the Afghan troop withdrawal followed by this morning’s release of strategic petroleum reserves, which, of course, was reportedly done after close consultation with the Saudis and has the added goal of putting pressure on Iran.

Lower crude oil prices mean fewer social programs in these oil-producing countries. Fewer social programs mean social unrest. It means uprisings and revolution.

You’ve heard the term: Arab Spring.

The young activists in places like Egypt would be more like the rebels in Libya if governments crack down hard on uprisings, and don’t have the money to buy their way out of revolution.

Oil prices are a double-edged sword, especially for those economies that need crude profits to keep the peace. High oil prices face pressure from the rest of the world. Low oil prices mean pressure from unhappy citizens.

By the way, if you think the Arab Spring will just be contained within the Middle East, then you might want to take a look at this report Justice Litle released about the dangers of political unrest and crude oil shocks. I think it’s very relevant right now. Click here to read the report.

More oil headed to the market lowers prices, and this news is already doing some damage to the price of oil… By 1:30 p.m. Eastern Time, crude oil prices had fallen 3.78%, down to $91.80 a barrel.

That’s also rotten luck for Apache Corp. (APA:NYSE) and Suncor Energy (SU:NYSE) that I talked to you about on Monday last week. Both were down significantly yesterday, but made up some of those losses at the end of the day.

This makes sense for oil companies, just like it does for crude oil-producing countries.

Of the full 60 million barrels from the emergency plan, the U.S. will release 30 million barrels from its Strategic Petroleum Reserve. This will happen over the span of a month.

But that might not have any effect on the demand six months, when Saudi Arabia suggests expects a rebound.

No… This short-lived symbolic finger won’t do much more than irritate a number of oil producers in the middle of a blossoming Arab Spring.

As for APA and SU, let’s set some tight exit points just in case this emergency plan weighs down crude oil companies.

Keep your exit point right around $114 for APA for now. Shares ended at $117.41 on Thursday. A drop to $114 would test a key support level. A breakdown below that means even more pain. A further drop to $110 could be in the mix if support at $114 breaks.

Here’s what that looks like.

Apache Chart

For SU, the situation is a bit tighter. Share prices closed at $38.11 yesterday, down 1.12%. Prices have been rounding over for the past four months. If SU doesn’t find support at current prices, a drop to $35 could be in the stock’s future.

That’s an 8% loss. Not huge, but not insignificant, either.

I’ll talk more about these two companies on Monday, but for now, I’m going to catch up on some well-earned sleep.

Editor’s Note: Don’t forget to take a look at the report from Justice Litle I mentioned earlier. If you think things have quieted down in the Middle East, don’t be fooled. The cracks are there, and the OPEC conflict could burst them wide open.

When that happens the pain won’t be limited to those living in the Middle East. But Justice’s report shows you how to protect any assets of yours that might be at risk. Click here to read the report.

Article brought to you by Taipan Publishing Group. Additional valuable content can be syndicated via our News RSS feed. Republish without charge. Required: Author attribution, links back to original content or www.taipanpublishinggroup.com.

{loadposition sidarticles}

{jtagstpg} {authorstpg}

Other Related Sources:

  • Fighting Arab Nations Are Costing You Hundreds at the Gas Pump
  • Saudi Arabia Prepares for a Crude Oil War
  • Oil Prices Slump on U.S. Demand Outlook
  • Global economy: Soft intermediate stage – not a hard landing

    Global economy has hit a soft spot in growth says analysts from Jyske Bank. However the slowdown is temporary they believe.

    The world´s economies suffer from rising oil prices, the earthquake in Japan, interest rate hikes and the dept crisis in Europe.

    In this broadcast senior macro analyst Tina Winther Frandsen comments on the latest analysis of the global economy from Jyske Bank.

    Read the analysis in its full length here.


    Legal information

    Video courtesy of en.jyskebank.tv