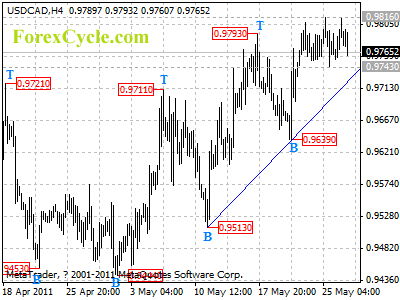
USDCAD moved sideways

USDCAD moved sideways in a narrow range between 0.9743 and 0.9816. The price action in the range is treated as consolidation of uptrend from 0.9444. Further rise is still possible and next next target would be at 0.9900. Support remains at the uptrend line from 0.9513 to 0.9639, only a clear break below the trend line could indicate that lengthier consolidation of uptrend is underway, then pullback to 0.9650-0.9700 area could be seen.

usdcad

Forex Signals

China Expresses Interest in Portugal Bonds

By James McKee

Europe has been experiencing a great deal of trouble financially despite having taken austerity measures upon itself, and this has resulted in a drop of the value of the Euro against the USD on the online forex exchange. The European economy at large needs a good deal of help, and to date that help has come from European nations helping one another. The United States is not in a position to lend money and most other nations are in the same spot, it seems like everyone is broke…but not China. China is flush with cash due to a symbiotic trading relationship with the United States, and while China is no longer looking to buy as much debt from the US they are looking for other investments. Since Europe is closer to China geographically than the US it makes more sense to keep that region as stable as possible.

It has long been known to China that the United States would rather crawl ever deeper into debt than pay off their debts to China and others. This continual cycle of debt and more debt has caused the US economy and USD to slump against those else where in the world. Such a scenario has remained on the horizon for the United States for some time now and in all likelihood there is going to be no shortage of excuses; however, China it seems has heard enough. The voiced interest on the part of China in buying European debt was enough to cause the Euro to bounce back against the US dollar. While this is all well and good for Europe a shift in China’s economic interests could spell out serious trouble for the USD in the short and long term.

This all spells out trouble overall for the USD on the online forex exchange and more than likely there is going to be a grab for Chinese money. In order to begin paying off its debts the United States needs to make a TRUE effort to do well by its investors and walk the walk. The time for talking has been over for a long time now and austerity measures are the least of what the United States must do to make things right with China and other investors…there has to be change and it must come now. China and the rest of the world have heard enough excuses and are beginning to turn their focus elsewhere.

About the Author

Author is a Forex trader and financial analyst residing in Denver, Colorado. To stay up to date on all the latest developments in the financial world and beyond be sure to check out the online forex trading regularly.

What Does a Fractal Look Like?

And What Does It Have to Do with the Stock Market?

By Elliott Wave International

If the word ‘fractal’ comes up at all in conversation, that conversation is probably being held in a mathematics department. However, anyone who is interested in the Wave Principle and how it applies to the stock market may have stumbled across the phrase “robust fractal.” If you want to know more about what it means in that context, here’s an excerpt from Elliott Wave International’s primer on fractals that explains the connection.

* * * * *

Excerpted from The Human Social Experience Forms a Fractal
by Robert R. Prechter

In the 1930s, Ralph Nelson Elliott discovered that aggregate stock market prices trend and reverse in recognizable patterns. In a series of books and articles published from 1938 to 1946, he described the stock market as a fractal. A fractal is an object that is similarly shaped at different scales.

Although Elliott came to his conclusions fifty years before the new science of fractals blossomed, he took a step that current observers of natural processes have yet to take. He explained not only that the progress of the market was fractal in nature but discovered and described the component patterns. The patterns that Elliott discerned are repetitive in form but not necessarily in time or amplitude. Elliott isolated and defined a number of patterns, or “waves,” that recur in market price data. He named and illustrated the patterns. He then described how they link together to form larger versions of themselves, how they in turn link to form the same patterns at the next larger size, and so on, producing a structured progression. He called this phenomenon The Wave Principle….

The Stock Market as a Robust Fractal
A classic example of a self-identical fractal is nested squares. One square is surrounded by eight squares of the same size, which forms a larger square, which is surrounded by eight squares of that larger size, and so on.

A classic example of an indefinite fractal is the line that delineates a seacoast. When viewed from space, a seacoast has a certain irregularity of contour. If we were to drop to ten miles above the earth, we would see only a portion of the seacoast, but the irregularity of contour of that portion would resemble that of the whole. From a hundred feet up in a balloon, the same thing would be true.

Photo of Madeira coastline, near Sao Jorge, by Plane Person (source: Wikimedia Commons)
Scientists today recognize financial markets’ price records as fractals, but they presume them to be of the indefinite variety. Elliott undertook a meticulous investigation of financial market behavior and found something different. He described the record of stock market prices as a specifically patterned fractal yet with variations in its quantitative expression. I call this type of fractal, which has properties of both self-identical and indefinite fractals, a robust fractal. Robust fractals permeate life forms. Trees, for example, are branching robust fractals, as are animals, circulatory systems, bronchial systems and nervous systems. The stock market record belongs in the category of life forms since it is a product of human social interaction.

How Is the Stock Market Patterned?

Idealized Wave Development and Subdivisions

Figure 1 shows Elliott’s idea of how the stock market is patterned. If you study this depiction, you will see that each component, or “wave,” within the overall structure subdivides in a specific way by one simple rule: If the wave is heading in the same direction as the wave of one larger degree, then it subdivides into five waves. If the wave is heading in the opposite direction as the wave of one larger degree, then it subdivides into three waves (or a variation). These are called motive and corrective waves, respectively. Each of these waves adheres to specific traits and tendencies of construction, as described in Elliott Wave Principle (1978).

Waves subdivide this way down to the smallest observable scale, and the entire process continues to develop larger and larger waves as time progresses. Each wave’s degree may be identified numerically by relative size on a sort of social Richter scale.

Want to Know More About Fractals and the Stock Market? Then read the whole special report, called “The Human Social Experience Forms a Fractal.” It’s free of charge, so long as you are a member of Club EWI, which gives you access to many free reports that explain Elliott wave analysis and the Wave Principle.

This article was syndicated by Elliott Wave International and was originally published under the headline What Does a Fractal Look Like?. EWI is the world’s largest market forecasting firm. Its staff of full-time analysts led by Chartered Market Technician Robert Prechter provides 24-hour-a-day market analysis to institutional and private investors around the world.

Dollar Weaker on Interest Rate Speculation

The U.S. dollar was down 0.7 percent in mid-day trading in New York today on reports that first quarter growth was less than expected. The latest employment news also indicated that 424,000 new unemployment benefit claims were filed last week exceeding predictions by more than 10,000.

The weaker-than-expected results gave rise to increased speculation that the Federal Reserve will continue to lag other Central Banks with respect to interest rate increases. Last month, the European Central Bank lifted the benchmark lending rate by a quarter point to 1.25 percent thereby ending a stretch of nearly two years of holding the line on rates. The Fed has maintained its record low 0.25 percent rate even longer and few expect an increase prior to the end of the year.

ECB President Jean-Claude Trichet added to the dollar’s troubles earlier today when he noted that the Bank was particularly concerned that rising commodity prices could lead to inflation and that the Bank would continue to monitor prices. Readings on this vary, and while it may not mean that rates will necessarily rise at next month’s meeting, it is clear that inflation is near the top of the Governing Council’s list of concerns.

At the very least, it is widely accepted by market observers that the ECB will move to raise interest rates long before the Fed makes a similar move. This reading of the situation – combined with the weaker U.S. employment and consumer spending data – is why the euro has gained ground on the dollar today. This advance comes despite concern over the fate of the shared currency in light of the European debt crisis.

Euro Still Dogged by Credit Crisis

Even as the euro gains on the dollar, it continues to lose against other currencies. In May alone the euro has lost nearly five percent to the yen on fears that the situation in Greece could deteriorate to the point that billions in debt could require restructuring. This really is unchartered territory and no one can say with certainty how markets will react should investors be forced to extend maturity dates or accept lower payouts as part of a restructuring.

Not helping matters is the growing public backlash against the so-called austerity programs ordered by the European Union and the International Monetary Fund in return for emergency funding. Greece has been plagued by large riots since government spending cuts were first announced and now opposition parties in Spain have said they will refuse to support the government in its attempts to trim the deficit.

Scott Boyd is a currency analyst and a regular contributor to the OANDA MarketPulse FX blog

Forex Update: US GDP rises by 1.8% in 1st Quarter, Jobless Claims increase. Dollar on defensive

By CountingPips.com

The second estimate GDP report for the first quarter of 2011 showed that the US economy grew at a rate of 1.8 percent, according to today’s release by the U.S. Commerce Department.

The GDP number came in slightly below expectations but matched the first estimate released last month by the Commerce Department. Market forecasts were expecting the GDP to advance by 2.2 percent for the quarter following the fourth quarter of 2010’s economic growth which registered an increase by 3.1 percent..

Consumer spending was revised lower in the first quarter to show a 2.2 percent increase on an annual basis. This is a decline from the first estimate that showed consumer spending rose by 2.7 percent.

Exports increased by 9.2 percent in the first quarter following a rise by 8.6 percent in the fourth quarter. Imports were higher by 7.5 percent in the first quarter after declining by 12.6 percent in the fourth quarter.

The third estimate for the GDP data will be released on June 24, 2011.

Jobless claims rise more than expected

U.S. jobless claims increased by more than expected in the week that ended on May 21st, according to a release by the U.S. Labor Department today. Weekly initial jobless claims rose by 10,000 workers to a total of 424,000 unemployed workers. The 4-week moving average of unemployed workers decreased by 1,750 workers from the previous week to a total of 438,500.

Market forecasts were expecting jobless claims to number 404,000 workers following the prior week’s 414,000 revised number of claims.

Meanwhile, workers seeking continuing claims for unemployment benefits for the week ending May 14th decreased for the week. Continuing claims fell by 46,000 workers to a total of 3,690,000 unemployed workers. The 4-week moving average of continuing claims rose by 7,750 workers to a total of 3,742,250.

US Dollar lower in Forex Trading while Stocks higher

The US Dollar has been on the defensive in forex trading today against most of the major currencies today after the GDP report. The dollar has been losing ground today versus the euro, Japanese yen, British pound sterling, Australian dollar, Swiss franc and the New Zealand dollar while showing a slight gain against the Canadian dollar.

The US stock markets have had a winning session so far today with the Dow gaining by approximately 35 points, the Nasdaq increasing by over 20 points and the S&P 500 up by around 7 points.

In commodities, oil has traded lower by approximately $1.17 to $100.15 per barrel while gold futures have lost $7.10 to trade at $1,519.50 per ounce at time of writing.

What a Late Night in France Taught Me About the Bond Market

bonds_currencyTuesday night, at the close of our editorial meeting at a gorgeous chateau in rural France, we opened up a few bottles of Medoc and relaxed in the library.

The meetings were inspiring. Great ideas were flowing just as quickly as the wine. We ate some amazing meals made for us by Pierre and Chantal, and spent most evenings out on the lawn in the setting sun. In Courtomer, it doesn’t set until 10:30.

At the end of the evening, though, a few of us sat down and started talking. Nothing was out of bounds: What we thought of the Israeli-Palestinian situation after President Obama called for Israel to return to the 1967 borders… what kids today think of society… and what people are missing in the bond market.

I was sitting across from Joey McBrennan, co-editor of Taipan Daily. Joey is an expert when it comes to bond investing, and he’s been saying the same thing we’ve been saying here at Smart Investing Daily.

Long-term U.S. government bonds are one of the worst places to put your money.

But Joey was quick to say that most investors think that all bonds are the same. This is not true. A three- or four-year bond from a small city that pays its bills is not the same as a 10- or 30-year Treasury bond from the U.S. government, with rates falling like mad.

From our conversation, I picked three key factors for investors to keep in mind when it comes to looking at bonds.

Shorter Is Better

Right now, the U.S. dollar is still under fire. The Federal Reserve’s plan of printing money and keeping interest rates low is putting pressure on prices. Americans are paying more for things like eggs and milk and bread.

This is inflation… and it’s growing.

Inflation eats away at your money, making it worth less. It’s like termites… Sometimes you don’t even notice termites until your house starts to crumble. But they’ve been there, munching away right under your nose.

When it comes to bonds, shorter terms are better right now. A term under five years, for example. Shorter terms sometimes mean less exposure to inflation.

Pick “Necessities” Bonds

Now, Joey knows that there are a lot of choices in the municipal bond market. Not all bonds should be placed in the same basket. Some are more attractive (with lower risk) than others because they deal with municipal necessities.

Things like water and sewer bonds fall into this category. For most citizens, buying water and using sewage services is an obligation. This money goes to the city or town. That’s why these types of bonds have lower risk. People have to pay their water bill.

It was getting late at the chateau, and Joey was on a roll. “People need their water,” he said. It’s a simple yet very true statement. Water is a necessity, and bonds for water and sewers can offer good yields.

Find Small Communities

But again, not all municipal bonds are equal, because not all municipalities are equal. The amount of money a big city needs to raise for projects is completely different from a small community. And smaller communities might have an easier time of paying investors back.

Smaller towns have a better track record of paying their bills on time. This might be because they’re not chained to big pension funds or other money-draining obligations. Joey thinks these small communities feel more of a commitment to their residents.

“They treat their budgets like responsible elected officials that care about their neighbors,” he said.

There could be thousands of these kinds of towns looking for investors to buy their bonds.

Buy Bonds, Don’t Buy Bonds

The article I wrote on Monday last week told you not to buy bonds… Specifically, long-term government bonds.

But even experts tend to lump all types of bonds together, and investors might be missing some opportunities for safe investments. These opportunities can be found in the short-term municipal bond market.

Bonds that deal with necessities like water, that are a five-year term or less, and that come from small, responsible communities could give you a lot of safety for your portfolio.

Editor’s Note: Buying municipal bonds isn’t the only way to escape the inflation pressures facing the bond market. The key is to find investments that thrive with inflation. Joey’s municipal bond argument is great for protecting your portfolio, and the tax benefits are really great, but finding opportunities to grow your wealth as inflation climbs is a powerful chance at true safety.

Here’s a detailed letter that can show you the difference between safe investments and investments that thrive.

Article brought to you by Taipan Publishing Group. Additional valuable content can be syndicated via our News RSS feed. Republish without charge. Required: Author attribution, links back to original content or www.taipanpublishinggroup.com.

{jtagstpg} {authorstpg}

Other Related Sources:

  • Do Not Buy Government Bonds
  • Municipal Bonds Back in Fashion? Looks Like Time to Sell
  • Muni Fund Ride Isn’t Entirely Bad News
  • Euro Gains on Chinese Interest while Gold Falls $10

    printprofile

    The FX markets have calmed following the sharp price moves seen in the Asian session as traders await US economic data later. The euro and equities are higher spurred by Chinese interest in Portuguese bailout debt and dollar block currencies.

    The Nikkei finished the day up 1.48% following a Financial Times report citing Chinese interest in the Portuguese debt auctions from the European Financial Stability Facility. The euro was a prime beneficiary of this move and the currency is trading higher today across the board. The report helped to put the Greek debt crisis on the back burner and turn the focus on global reserve managers and FX diversification which had previously been a catalyst for the euro. The EUR/USD easily took out the 1.4130 resistance in the Asian session, moving as high as 1.4194 from 1.4081 before settling at 1.4170. A breach of today’s high and the EUR/USD could add another 1.5 cents as the next resistance level lies at 1.4350 off of last Friday’s high and the 50-day moving average.

    Sterling is weaker versus the euro but higher against the dollar as the rebound in equities has kept both the dollar and sterling lower. The EUR/GBP traded higher at 0.8693 from 0.8652. Cable is up at 1.6310 from 1.6271. Cable’s gains have been capped today at the previous trend line rising off of the January lows. A break of this level could take the GBP/USD higher to 1.6515.

    Dollar bloc currencies are up with the New Zealand dollar bid as the Kiwi rose to a high of 0.8111 where the NZD/USD failed to break above the high from earlier in the month. Next resistance for the pair lies at 0.8215 off of the double top pattern in 2008. AUD/USD is up as well but still remains locked in a consolidation pattern with resistance at 1.0710 and support at 1.0430.

    Commodities are notably softer with crude oil down at $100.75 and silver shedding $2.20 after earlier reaching a 2-week high. Spot gold prices are also lower by$10 on the day. Resistance is at $1,532 followed by the all-time high at $1,576. Support comes in at $1,503. The pullback in oil and metals is surprising given the sharp gains in Asian equities as well as the euro. Perhaps this indicates bearish positioning ahead of the US preliminary GDP and weekly unemployment claims later this afternoon.

    Read more forex trading news on our forex blog.

    Return to the “Risk-On” Trade in Asia Boosts the NZD and Commodities

    Source: ForexYard

    In Asian trading the dollar block currencies and commodities were noticeably higher with Asian bourses climbing, signaling a potential rebound in the “risk-on” trade.

    Economic News

    USD – Dollar Mixed After Durable Goods Report

    The greenback was mixed yesterday following weaker than expected core durable goods orders, -1.5% on consensus expectations of a gain of 0.7%. The March output was revised higher to 2.5% from a previous 1.3%. Initially the report fed into a bout of USD buying but the negative tone dissipated with the euro eventually reaching 1.4117 before closing back at 1.4081. Earlier in the day the EUR/USD dipped to its daily low at 1.4013 following disappointing German consumer numbers. Interestingly enough, yesterday’s low coincides with the neck line of a potential head and shoulders pattern.

    This morning the dollar was on its back foot with a return of the “risk-on” trade as Asian bourses made strong gains. The Nikkei was up 1.4% while commodities such as silver and spot crude oil were also making strong gains. The gains in Asian trading may be due to a Financial Times report citing Chinese interest in the Portuguese bailout debt auctions from the European Financial Stability Facility. A separate report stated China may look to invest 1.5% of its FX reserves in New Zealand assets and 2% in Australian assets.

    Today traders are expecting a more positive result from US GDP numbers. The second of three US GDP releases, the preliminary data is forecasted to show a growth rate of 2.2% in Q1 versus 1.8% from the advanced GDP report. US weekly unemployment claims are also expected to improve slightly. Should today’s US economic data be released above market forecasts, this may help to build on this morning’s gains in Asia while keeping the dollar on its back foot.

    EUR – Euro is Bid in Asia

    Yesterday the euro was flat versus the dollar but traded noticeably lower against the Swiss franc and the British pound. The spillover from the Greek debt crisis is more apparent in the crosses as dollar strength may only be transitory given the loose monetary policy the Fed maintains. Yesterday the EUR/CHF hit an all-time low at 1.2269 while the EUR/GBP dropped to a 10-week low at 0.8632.

    This morning the euro received some much needed support on the heels of Chinese FX diversification reports with the 17-nation currency coming off its lows across the board. German import prices are expected to rise albeit at a slower pace than the previous months. Follow through price increases in the German economy due to rising commodity prices may bring the inflation story back to the front of the FX market headlines. A surprise in this data release and traders may be forced to focus back on the interest rate differentials between Europe and the States while putting the European debt crisis on the back burner.

    NZD – Asian Bourses Trade Higher as Kiwi Soars

    The Asian trading session got off to a strong start today on the back of renewed sovereign buying interest. Both the New Zealand dollar and the Australian dollar were sharply higher following the report China may look to invest 1.5% of its FX reserves in New Zealand assets and 2% of its reserves in Australian assets. This has helped the NZD/USD surge today and is the FX market’s strongest performer out of the G-10 currencies.

    Versus the Australian dollar the Kiwi has put in significant technical damage. The AUD/NZD has fallen from its early May high at 1.3700 and this morning has cracked the psychological support level of 1.3100. In overnight trading the pair plunged lower, breaking the previous support at 1.3190 which should now serve as initial resistance. Further support is found at 1.3040. A more long term target for the AUD/NZD may be found between the January low at 1.2775 and the 61.8% retracement level from the 2010 low to the May 2011 high at 1.2740.

    Oil – Spot Crude Oil Prices Surge

    Spot crude oil prices rebounded after commodity prices have been subdued following the early May sell-off. Crude prices surged to close above $101 following the weekly US crude oil inventory report showed increased demand from oil refineries. While the headline inventory number was higher than expected, the bullish refinery data was more than enough to bring crude oil bulls back into the market. The price of spot crude oil rose to $101.54 from $98.77 on strong demand in the New York trading session.

    Since the sell-off in early May spot crude oil prices have been consolidating and have formed a triangle pattern on the daily chart. Despite yesterday’s almost $3 appreciation in the commodity, the price declines in May were so sharp that crude oil prices still have until $102.60 before the commodity is even testing a breakout to the upside. Support comes in near yesterday’s low at $97.80.

    Technical News

    EUR/USD

    Momentum continues to shift to the downside with weekly stochastics falling sharply. Initial support was found at the 100-day moving average and the next major levels that come into play are between 1.3910 and 1.3860. The former is the 50% retracement level from the January to May move. The latter is a previous support level from mid-March. A breach here would target 1.3675 where the 200-day moving average and the 61.8% retracement levels coincide. This morning the EUR/USD took out the 1.4130 resistance level and new resistance is found at 1.4290 followed by the 50-day moving average at 1.4350.

    GBP/USD

    Cable has received a bounce the last two days off of the rising trend line from the May 2010 low and has encountered resistance at 1.6320 from the broken trend line off of January low. A move higher would test 1.6515. Support is found at the 200-day moving average at 1.5935 which coincides with the March low.

    USD/JPY

    Weekly stochastics are rising, indicating longer term momentum is swinging to the upside. The daily chart’s 14-RSI is also moving steadily higher confirming the short term bullish run. The USD/JPY has already retraced 38% of the April to May move lower and a rebound in the pair could continue further. The 50% and 61.8% retracement levels stand out as potential targets, coming in at 82.55 and 83.25 respectively. Before these retracement targets, near term resistance comes in at 82.20 followed by 82.80. The rising trend line off of the May low should prove to be supportive with significant support at this week’s low at 81.30.

    USD/CHF

    The weekly high at 0.8890 coincided with the trend line falling off the February high. Since then the USD/CHF has moved lower and could target 0.8660 from the previously broken lower channel line from the October 2010 low. A breach here would target the swing low at 0.8553

    The Wild Card

    AUD/NZD

    The AUD/NZD has fallen from its early May high at 1.3700 and this morning has cracked the psychological support level of 1.3100. In overnight trading the pair plunged lower, breaking the previous support at 1.3190 which should now serve as initial resistance. Further support is found at 1.3040. Forex traders may use a more long term target for the AUD/NZD which can be found between the January low at 1.2775 and the 61.8% retracement level from the 2010 low to the May 2011 high at 1.2740.

    Forex Market Analysis provided by ForexYard.

    © 2006 by FxYard Ltd

    Disclaimer: Trading Foreign Exchange carries a high level of risk and may not be suitable for all investors. There is a possibility that you could sustain a loss of all of your investment and therefore you should not invest money that you cannot afford to lose. You should be aware of all the risks associated with Foreign Exchange trading.