ECB Rates and Federal Reserve Policy

Source: ForexYard

The highlight of this week’s trading will be Thursday’s ECB Minimum Bid Rate. Traders will be expecting an initial increase of 25 bp and wording from the ECB that this week’s adjustment to the interest rate is not just a one off increase but the start of normalizing European monetary policy which would continue to benefit the euro. However, given last Friday’s strong non-farm payrolls data, today’s speech by Fed Chairman Ben Bernanke in Atlanta will carry extra significance. Should Bernanke come out with a more hawkish tone, this could be the beginning of a turnaround for the dollar.

Economic News

USD – Non-Farm Payrolls Data Supports US Economic Recovery

The jobs report for March showed a gain of 216K jobs on expectations of 191K new jobs added. The report was further supportive as the February numbers were revised higher to 194K from 192K. The unemployment rate surprisingly dropped to 8.8% from 8.9%. Also showing improvement was the ISM Manufacturing PMI which came in above expectations at 61.2 with economists forecasting only 61.1.

It is difficult to deny the improvement shown in the US economy. Five consecutive months of job growth boasts well for the economic recovery. The pickup in labor market conditions should now begin to influence the Federal Reserve and the wording in the Fed’s next statement could contain a more upbeat tone, emphasizing the labor market’s improvement in contrast to the consistent stubbornness of unemployment that is typically highlighted.

Given last week’s group of Fed members that came out in in favor of tightening US monetary policy and scaling back the Fed’s $600B quantitative easing program, Friday’s strong jobs data will bring to the forefront the debate for policy normalization in the US. Thus today’s speech by Fed Chairman Ben Bernanke in Atlanta will carry extra significance in the FX markets. Should Bernanke come out with a more hawkish tone, this could be the beginning of a turnaround for the dollar.

EUR – ECB Interest Rate Decision

Expectations are running high for the ECB not to disappoint the markets with an interest rate increase at this Thursday’s ECB meeting. ECB President Jean-Claude Trichet and other members of the ECB have taken huge strides to prepare markets for an increase in EU interest rates.

On Thursday ECB Governing Council member Nout Wellink stated his backing for winding down of ECB support and liquidity provisions. He highlighted the risks of continuing to print more money and a loose monetary policy. Last Monday Trichet continued with his hawkish rhetoric, highlighting inflationary data that continues to come in above the ECB’s target of below 2%.

Markets currently expect the ECB to increase interest rates on April 7th and it appears that the ECB has put its mandate for price stability ahead of the concerns for the indebted peripheral nations of Greece, Ireland, and Portugal.

While a 25bp increase may already be priced into the euro, there may be further room for euro appreciation should the ECB continue to pre-commit to interest rate hikes. A signal of further interest rate increases during the accompanying ECB press conference would be a catalyst for the euro. However, a change in US interest rate expectations is a risk to the 17-nation currency’s appreciation.

In early overnight trading the EUR/USD moved above the first resistance level at 1.4280 but quickly pulled back below to 1.4230. A target for future gains in the EUR/USD may be found at the January 2010 high at 1.4580. A move above this level would cause a significant shift in long term momentum, potentially triggering gains to the November 2009 high at 1.4270. To the downside, support comes in at last week’s low at 1.4020, followed by 1.3860.

JPY – Yen Weakness Continues

The sell-off in the yen versus the dollar and the euro continued on Friday and may extend further into this week’s trading. Talk of a renewal of the carry trade has added momentum behind the yen’s recent decline that began after the coordinated intervention by the G7 in the FX markets. Also supporting yen weakness has been a rebound in global equity markets following the selling that occurred after the geopolitical unrest in Libya and the natural disaster in Japan.

A catalyst for further declines in the yen would be higher relative yields. The ECB is expected increase interest rates by 25 bp this week and market watchers will be keying in on potential for further ECB rate hikes. Following last week’s hawkish comments by multiple Fed members and a strong non-farm payrolls report, a reevaluation of US monetary policy would continue to keep the yen on its back foot.

USD/JPY resistance is found at last week’s high of 54.70, followed by the trend line falling off of the June 2007 high which comes in at 85.40. The September 2009 high of 85.90 may also come into play with a significant resistance level at the May 2010 low at 88. Support is found at the 200-day moving average at 82.90 followed by a retracement objective to 81.50.

OIL – Crude Prices Up on Improved Economic Outlook

Crude oil prices surged to a 2-1/2 year high near $108.50 a barrel last week on stronger-than-expected U.S. jobs growth in March and weakness in the dollar.

The Labor Department said non-farm payrolls rose by 216,000 compared with economists’ estimates of a rise of 195,000. The February figure was revised upward to 194,000 from an estimate of 192,000, while the unemployment rate fell to a two-year low of 8.8% from 8.9% a month ago.

A weaker U.S. dollar tends to boost the price of dollar-priced commodities as it lowers the price to holders of other currencies and reduces the value of the currency oil producers receive for their product.

Looking ahead, traders are advised to watch carefully the global stock markets and the major economic indicators which will be published from the U.S. in order to predict the next movement in oil prices.

Technical News

EUR/USD

The pair has recorded much bullish behavior in the past several days. However, the technical data indicates that this trend may reverse anytime soon. For example, the 8-hour chart’s Stochastic Slow signals that a bearish reversal is imminent. Going short with tight stops might be a wise choice.

GBP/USD

The daily chart is showing mixed signals with its RSI fluctuating at the neutral territory. However, the 8-hour chart’s RSI is already floating in the overbought territory indicating that a bearish correction might take place in the nearest future. When the downward breach occurs, going short with tight stops appears to be the preferable strategy.

USD/JPY

There is a fresh bearish cross forming on the daily chart’s Slow Stochastic indicating a bearish correction might take place in the near future. The downward direction on the 8-hour chart’s RSI also supports this notion. Going short with tight stops might be the right strategy today.

USD/CHF

The pair has been range-trading for a while now, with no specific direction. The Daily chart’s Slow Stochastic is providing us with mixed signals. All oscillators on the 4 hour chart do not provide a clear direction as well. Waiting for a clearer sign on the hourlies might be a good strategy today.

The Wild Card

Oil

Crude prices rose significantly in the last month and peaked at $108.70 a barrel. However, the 8-hour chart’s RSI is floating in overbought territory suggesting that a recent upwards trend is losing steam and a bearish correction is impending. This might be a good opportunity for forex traders to enter the trend at a very early stage.

Forex Market Analysis provided by ForexYard.

© 2006 by FxYard Ltd

Disclaimer: Trading Foreign Exchange carries a high level of risk and may not be suitable for all investors. There is a possibility that you could sustain a loss of all of your investment and therefore you should not invest money that you cannot afford to lose. You should be aware of all the risks associated with Foreign Exchange trading.

E-Mini Trading: Consolidation Patterns and Channels

By David Adams

Trading in a channel means many things in e-mini trading because trading channels come in all sorts of shapes, directionality, and length. There are also some semantic issues when discussing channels or consolidation patterns. For example, what I consider a retracement is often called a flag, in technical jargon. Nonetheless, it is a consolidation. There are also short sideways periods when the market takes a breather before resuming a trend. And finally, there are longer periods of range bound consolidation or channels which present some difficult trading issues.

As a day trader, it is important to identify which type of pattern you may be entering. Has there been a definite uptrend or downtrend in the market and the price action has started to move sideways? Or has the trend taken a short breather and retraced upwards or downwards (depending on whether the movement is to the upside or the downside) and there are indications that it may resume its initial trend? Or, has the trading range been narrow and easily defined for several hours?

The purpose of this article is to discuss the last type of consolidation channel. Short sideways movement and retracement patterns are all very tradable and will be the subject and other articles, as there are lengthy discussions needed to truly understand these patterns. On the other hand; long, range bound channels will be the topic of our discussion today. My thesis on these long range bound channels will be fairly straightforward; generally speaking, they are a black hole that will happily suck money from your trading account.

Long periods of market action in a defined channel should be an indicator to most traders that the market is in near equilibrium. It is also not unusual to notice that the volume in these extended channels is often light. Yet I watch traders on a daily basis pound away at these narrow channels hoping the market will break out to the upside or to the downside. It rarely does. As a matter of fact, though trading channels often have a plethora of small breakouts, which sends the retail traders into a near buying or selling frenzy, they usually and casually retrace back into the original channel, leaving the retail trader with a loss or, at least, in a very unfavorable position relative to their breakeven point.

That being said, the trading action inside these channels sometimes appears logical and rhythmic, following what seems to be a predictable serpentine pattern bouncing off the resistance and support that are the channel parameters. Again, these patterns entice many inexperienced traders and to entering trades inside the channel. Most of the action inside a trading channel, or range bound consolidation pattern is random in nature. Traders who enter a trade inside the channel often learn a harsh lesson in the randomness of channel trading. In short, I avoid trading inside a channel and wait for better opportunities, trades with higher probability for success.

There are a large number of articles I read before writing this article. Most were published by trading educators extolling the virtues of channel trading, so I must assume that my position on channel trading is a minority opinion. On the other hand, I have been fortunate enough to trade with some of the best traders in the world and they avoid trading in channels at all costs. Quite simply, the risk reward ratio is not particularly favorable and at some point the price action will break out of the channel. If you are on the right side of the breakout or breakdown, you will have a wonderful day. On the other hand, if you’re on the wrong side of the breakout or breakdown, your day will be less than wonderful.

In summary, we have pointed out there are various types of channels and some are good candidates for trades, while the extended sideways consolidation-type pattern offers little for most traders. Further, I have stated that trading in extended channels is a low probability proposition and I avoid trading these patterns.

About the Author

Real Live Trading Doesn’t Lie. Spend several days in my trading room and see if you can benefit from a fresh and unique view on trading e-mini contracts. Sign up for your free trading experience by clicking here

Identify Buying Conditions

By Taro Hideyoshi

In my earlier articles, we have learned indicators, chart patterns, money management and other pieces of successful trading. In this article, let us review those pieces and puzzle them together in order to find conditions we prefer for entering a trade.

Although we talk about conditions for buying or buy triggers in this article, you can apply them for short selling.

The very first thing to do when you are making a decision to enter a trade is to evaluate overall market. When you want to go buy, it is better to enter a trade while market is going up. Sometimes some stocks may go up while market is going down. Those stocks may hover in positive territory for a while, but overall negative market conditions will erode price surges.

When you pick a stock to buy, choose a leading stock in an industry sector that is a current market leader. For example, you see the banking industry currently serve as a market leader, so you target to analyze stocks in this sector to find the prominent stock and place it in your watch list.

Do not forget to check out the fundamental even you are technical traders. When you found a prominent stock, you have to check the company’s fundamental health especially when you intend to hold a position for days or longer.

At this point if your target stock looked good, it is time to open the chart and analyze it technically. The price should have formed a base or is in uptrend. When the price breaks out, make sure it has strong volume.

Take a look at moving average (MA), is the price below or above the MA? If you want to go long, the price should be trade over MA and heading up (not too far from MA).

Also look at your indicator, if you want to go long but the relative strength index (RSI) is in overbought zone. It is not safe to buy. It is better to buy when RSI is in oversold zone and hooking to the upside.

In conclusion, here are the conditions to buy or buy trigger list. You should check against the list when you trade.

1) Evaluate market condition
2) Find a stock that is a leading company in a leading industry
3) Check the company’s fundamental
4) Analyze the chart to find the entry point when all indicators output the same signal

About the Author

Taro is an experience trader who trades in stocks, futures, forex. He strongly focuses on technical analysis, trading systems and money management.

If you would like to find more articles on MetaStock Tutorials, MetaStock Formulas, Trading Systems and Money Management. Please go to MetaStock Trading System.

Daily Market Review for the 04.04.2011


AUD/USD

Time: 08.30 Rate: 1.0385

Daily Time frame

Strategy: Short

As was mentioned on the 31st of March the pair made an upward movement from 0.9705 without retracement, in the opening of the trade the week continued to increase and got to point D of the ABCD movement in 1.0420 the area is used as a strategy for retracement of at least 38.2% Fibonacci (1.0150).

As can be seen by the graph bellow:


Potential trade

Short under the trade period of Asia 1.0380.

Stop: 1.0510 – over the 161.8% Fibonacci of the last downward movement.

First target: 1.0250 – 23.6% Fibonacci of the upward movement.

Second target: 1.0150 – 38.2% Fibonacci of the upward movement.


EUR/JPY

Time: 09.00 Rate: 119.80

Strategy: short

Daily Time Frame

The pair fulfilled without retracing the goals assigned to it in the previous reviews and continued itself up, the next important resistance level is 122.00-121.80 the retracement of 50% of the big downward movement and 161.8% Fibonacci of the range (green area).

In addition, the final target of the highest range (about 900) pips is situated in the area of 125.00.

As can be seen by the graph bellow:


4 hour time frame

The pair is situated in a major momentum movement that brought the RSI indicator which is situated in the over bought for a long time, in the breakdown of the broken red line, the indicator of the pair is expected to stop the upward movement and to create one third retracement of all the upward movement from the bottom.

As can be seen by the graph bellow:


Potential Trade:

Short after arrival to 122.50-121.80 (blue area) and half of the broken red line which is down in the RSI indicator.

Stop: 122.60

First target: 119.00

Second target: 116.50


RISK DISCLAIMER

Forex trading involves high risk. Before any trade, you should consider carefully the investment objectives and the level of risk. The data sent by mail is not necessarily real-time data or precise. Real-Forex is not liable for the losses resulting from the utilization of the data. Real-Forex (Finnocorp Trading Solution Ltd

.) is not liable for losses or damages as a result of reliance on the information provided by e-mail or on the overall data, quotes, charts, signals buy / sell. It is hereby clarified that the investor must be aware of risks involved in trading in financial markets, which is a form of investment that may contain potential risks.

Real-Forex team

Trade like the pro’s with a true ECN Forex broker


Don’t Just Trade In Forex By Chance, Trade Based On Knowledge

By Cedric Welsch

The Forex Trading business is one of the hottest markets to invest in. The most lucrative traders on the market typically have their hands in foreign currency exchange. Smart investors have found profits rolling in after watching this market for trends and making strategic moves. It’s all about the right buy and the right sell at the right time. Watching the rise and fall of world currencies, anyone can see emerging trends. Smart investors can use those trends to see incredible profit. Even as the world trudges through an economic crisis, the Canadian Loonie is a great example of a smart investment with a great track record.

It wasn’t long ago when the United States backed every dollar of its wealth with gold. Money was a tangible item when the gold standard ruled the day. When it dissolved, the most powerful economies in the world began to value their currencies against each other. Without a palpable item like gold or silver to back up wealth, currency confidence dropped but the greatest stride forward was a renewed world economic system that could operate more efficiently than eve .

Most of us remember when the U.S. and Canada were right on par, dollar for dollar. We had parity in 1975 and as Canada began to emerge as a power-player in the world economy parity came back in 2007, capping a five year run on the back of a burgeoning demand for Canadian exports. Forex trading experts jumped on the opportunity to profit from the rising value of the Loonie.

This is a great example of why the Forex Trading business is a lucrative market to invest in. Speculators who paid attention to international trade saw a growing demand for the energy, grains and metal coming out of Canada. This is the key to investing smart in the currency market. Smart investors watch the trends. Canada was on a steep incline of efficiency and trade surplus in its export of copper, gold, wheat oil and its chief export, uranium. Those who kept a careful eye on the foreign trade could see the demand for such products by powerful economies like the United States, India and a rapidly developing China.

The investors who could see these trends knew that Canada’s currency was on the rise. Having the word’s eighth largest economy, Canada had comparative advantage in the uranium market, allowing them to produce uranium more cost-effectively than the world average. All the pieces fit together. Demand for Canadian exports was high, a streak of improved production created a large supply and as a result, Canada’s economy became stronger and the Looney grew dramatically in value. Anyone watching these trends could have investing in these floating exchange rates, and some of them made a fortune. The Forex Trading business is full of stories as profitable and easy to track as this one.

About the Author

Accumulating currency news trading info is a must for every trader.
Acquiring forex broker review opinions is one good example to this.

Why Many Investors Are Struggling To Make Money In 2011

By James Woolley

At the time of writing we are coming to the end of the first quarter of 2011, and it appears as if investors are finding it difficult right now. You only have to visit some of the investing forums to see evidence of this. So why is 2011 proving to be such a challenging year for investors so far?

Well for a start there is the obvious fact that the markets are trading lower than they were earlier in the year. This means that most mid and large cap stocks will have fallen in line with the overall markets. Plus it has also been the case that many smaller stocks have fallen quite a lot as well, which doesn’t always happen.

There will be a lot of traders and investors who will have minimized their losses by using tight stop losses or selling most, if not all of their stocks at the first sign of a downturn. There will be others who are in it for the long run and continue to hold good quality growth stocks despite the recent downturn. However many investors will have banked a few losses or seen their overall portfolio take a hit.

The fact is that you really get to separate the really good investors from the average or poor ones whenever the overall market falls. Anybody can make money in a bull market when most stocks keep on rising because you could be invested in pretty much any mid or large stock and still make decent amounts of money.

However I have noticed that a lot of pretty good investors have not fared too well in 2011. This is most probably because there is an awful lot of unrest around the world at the moment. We have had the Japanese tsunami which has caused major problems in Japan, and there are the obvious problems in Libya and a few other middle eastern countries. All of which makes it very difficult to predict where the markets are headed.

Before all these problems there was an optimistic feel about the markets. Companies were reporting much better earnings and the major economies were starting to look a lot better. However these unforeseeable events have certainly dented this optimism and we now find ourselves at the mercy of world events to a large extent.

So it is easy to see why 2011 has been such a difficult year to make money for many stock market investors. It is not going to get any easier either in my opinion because even if the markets do not fall very much from now on, we are still heavily influenced by events around the world, and unfortunately no-one can possibly predict how they will turn out at this precise moment.


About the Author

Click here to read a full review of the Portfolio Prophet ETF software, and to read all about Zecco Trading, one of the leading online stock brokers.

Big Forex Trading Profits ‘ Use Good Strategies To Earn This

By Cedric Welsch

If you want to be a player in the Forex market, you are not alone. Many investors have been able to use Forex trading for maximum profit, and you can easily get your own piece of the pie. Trading in the market is an excellent way to make your money work for you. There are numerous strategies that you can use to maximize the profits that you earn. Before you lay any of your money down though, it is a good idea to have your, “battle plan,” already mapped out.

Before investing your money, you should watch the market for a good 2 weeks or so, at the very least. Make investment choices using the ideas that you already have, but don’t put any real money down. Play and trade with imaginary money, and see how well you do. Learn whether the strategies you are planning to use are likely to bring you the returns you desire. You should also watch general trends. Is it in an upward or downward slope?

Choosing your currency pairs ahead of time is a good idea as well. Different pairs will have different ask spreads, along with different bid spreads, the volatility will also be different. The reason you choose your currency pairs in the beginning is because the pair that you choose, might dictate the trading strategy, or “battle plan,” you finally decide to implement.

Next you should decide what kind of trader you would like to be. Some people have had great success with technical trading. If you are a technical trader, you will likely use different indicators to try and predict price fluctuations electronically. Other traders have done well with news trading. News traders, as the name indicates, trade based on information they’ve learned by following World news and events. They also use tools called Forex Trading Calendars. These calendars document when a news event occurs that will likely affect price changes.

Sometimes the Forex market can be intimidating to a newbie because of the math that can be involved with trading. You might come across terms like moving averages, stochastic, and movements in the market, etc. If you feel nervous about these terms, you should take a little more time learning the market before you start investing.

Either take a beginners course, or study on your own for at least 6 months before you start investing. If you study like this, you will find the this type of investment to be an easy and quick way to make money, and you will be able to use Forex trading for maximum profit.

About the Author

Better and reliable fx news is irreplaceable to forex success.
Including broker forex review with that news reading should be wise.

FOREX: Large Currency Speculators trim USD Shorts. GBP, JPY positions fall.

By CountingPips.com

The most recent Commitments of Traders (COT) report, released on Friday by the Commodity Futures Trading Commission (CFTC), showed that futures speculators decreased short positions of the US dollar against the other major currencies. Non-commercial futures positions, those taken by hedge funds and large speculators, were overall net short the US dollar by $27.77 billion against other major currencies as of March 29th. This is a decline from the total short position of $29.82 billion on March 22nd, according to the CFTC data and calculations by Reuters which calculates the dollar positions against the euro, British pound, Japanese yen, Australian dollar, Canadian dollar and the Swiss franc.

This week’s notable changes included Japanese yen positions declining sharply after two straight weeks of increases, British pound sterling positions falling back towards the short side after a gain last week and Australian dollar positions rising to the highest level in over a year.

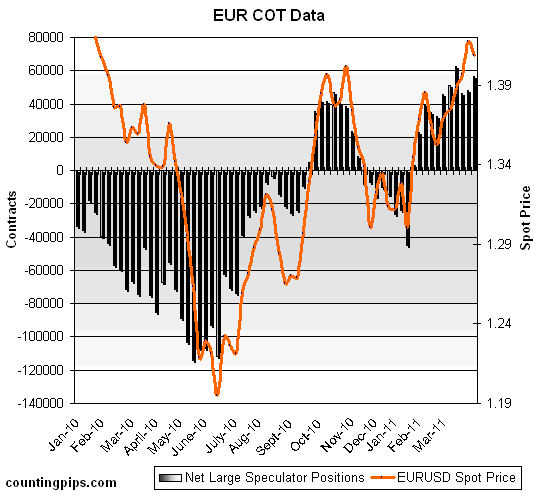
EuroFx: Currency speculators increased their net long positions for the euro against the U.S. dollar for second consecutive week. Futures positions in the euro rose to a total of 56,630 long positions as of March 29th following a total of 48,353 long positions on March 22nd.

euro cot

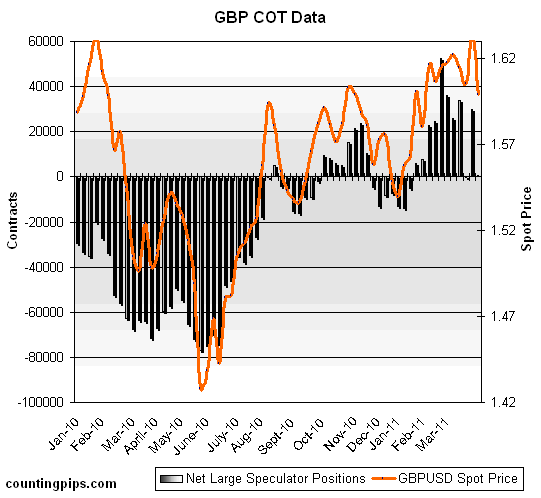
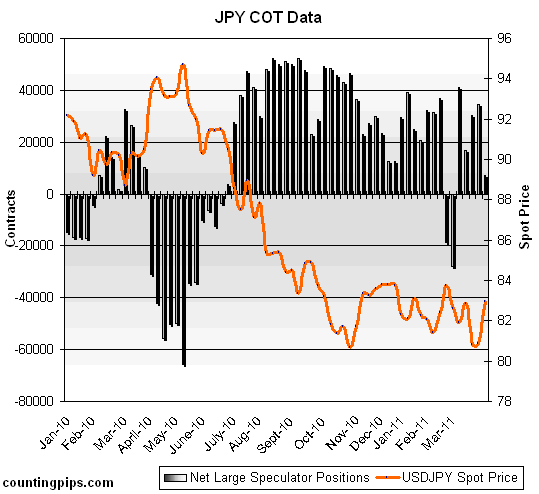
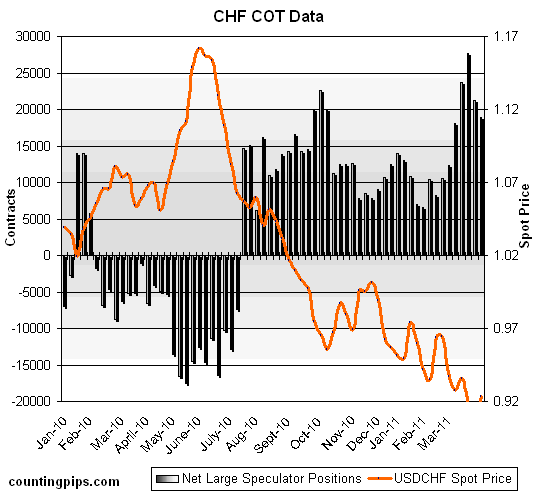
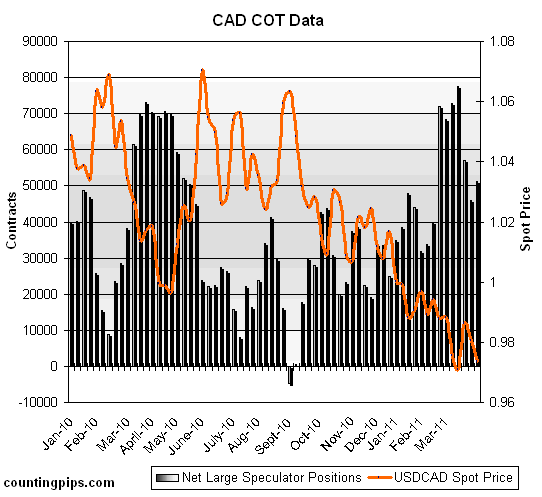
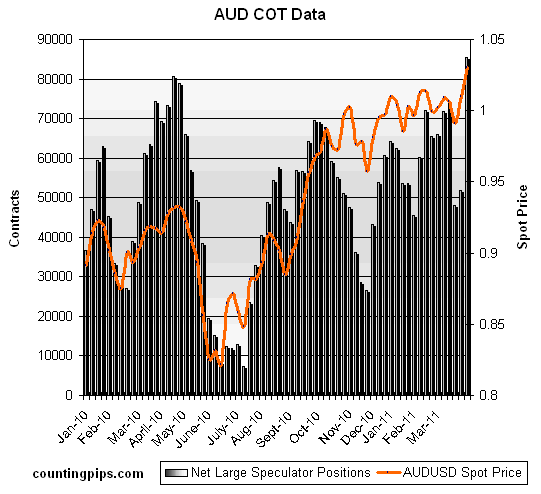
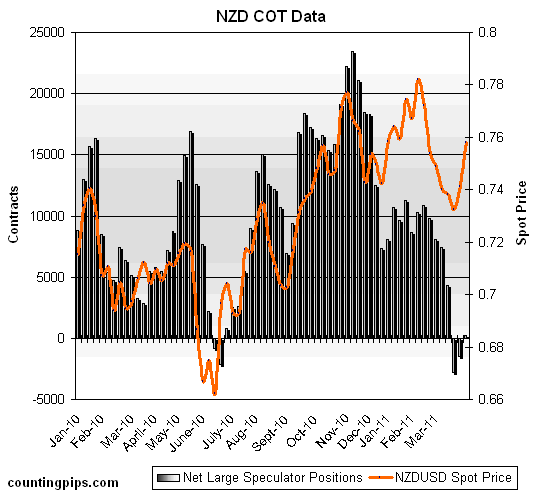
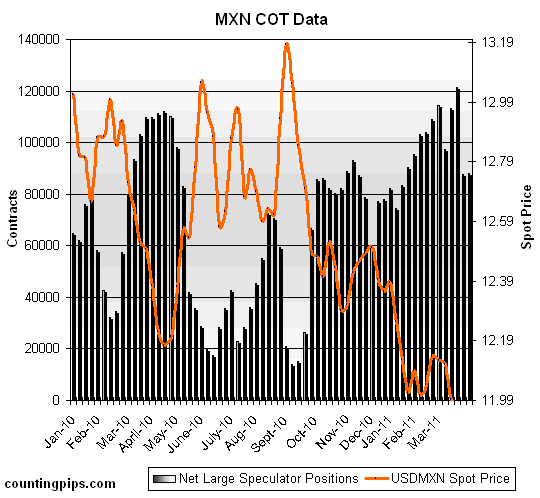
The COT report is published every Friday by the Commodity Futures Trading Commission (CFTC) and shows futures positions as of the previous Tuesday. It can be a useful tool for traders to gauge investor sentiment and to look for potential changes in the direction of a currency or commodity. Each currency contract is a quote for that currency directly against the U.S. dollar, where as a net short amount of contracts means that more speculators are betting that currency to fall against the dollar and net long position expect that currency to rise versus the dollar. The graphs overlay the forex spot closing price of each Tuesday when COT trader positions are reported for each corresponding spot currency pair.

GBP: British pound sterling bets fell as of the March 29th data release. GBP fell to a total of 743 long contracts as of March 29th after registering 29,724 long contracts on March 22nd.

GBP cot, british pound sterling GBPUSD

JPY: The Japanese yen net contracts fell sharply after advancing for two straight weeks. Yen contracts dropped to a total of 7,052 long contracts following a total of 34,525 net long contracts reported on March 22nd.

USDJPY, JPY COT Data

CHF: Swiss franc long positions fell for second straight week as of March 29th. Franc positions declined to a total of 18,957 net long contracts as of March 29th following a net of 21,301 long contracts on March 22nd.

USDCHF, CHF COT Data

CAD: The Canadian dollar positions turned higher after a decline for two consecutive weeks. CAD positions rose to a total  of 51,245 contracts as of March 29th. CAD net contracts had declined to a total of 45,977 net long contracts as of March 22nd.

USDCAD COT Data

AUD: The Australian dollar long positions jumped sharply higher last week to the highest level in over a year. AUD contracts totaled a net amount of 85,565 long contracts as of March 29th after AUD positions had totaled 51,734 net long contracts on March 22nd.

AUDUSD, AUD COT Data

NZD: New Zealand dollar futures positions edged slightly higher for a second consecutive week. NZD contracts increased to a total of 239 long positions as of March 29th from a total of 1,482 short contracts on March 22nd. NZD contracts had fallen for five consecutive weeks through March 15th.

NZDUSD, NZD COT Data

MXN: Mexican peso long contracts fell to almost unchanged from the previous week at a total of 88,075 net long contracts on March 29th. MXN positions had totaled 87,548 long contracts as of March 22nd. The MXN positions on March 15th had represented the highest level in over a year.

MXN, USDMXN COT Data

COT Data Summary as of March 29, 2011
Large Speculators Net Positions vs. the US Dollar

EUR: +56,630
GBP: +743
JPY: +7,052
CHF: +18,957
CAD: +51,245
AUD: +85,565
NZD: +239
MXN: +88,075

Further COT Resources from around the web:

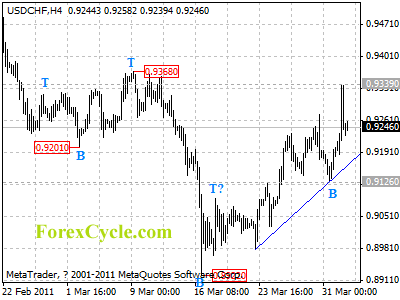
USDCHF’s upward move extended to 0.9339

USDCHF’s upward move from 0.8922 extended to as high as 0.9339. Support is at the rising trend line on 4-hour chart, as long as the trend line support holds, uptrend could be expected to continue and next target would be at 0.9400 zone. However, a clear break below the trend line will indicate that a cycle top is being formed, and the uptrend from 0.8922 is complete, then deeper decline towards 0.8922 previous low could be seen.

usdchf

Forex Signals

Forex Trading Calculator ‘ Just What You Need To Target Profits

By Cedric Welsch

If you invest on the Forex market to earn a steady stream of income it is important to invest in a quality Forex trading income calculator to monitor your investment. Many investors set income goals each year in hopes of not only meeting these goals, but exceeding them. If you set annual income goals you must be practical. Most investors with experience in the Forex market will base their goal on the current condition of the market. Know how to set your monthly and annual goals and why an income calculator is beneficial and step up your investment portfolio.

The primary purpose of the calculator is to calculate how many PIPS you must make on a daily basis to achieve the amount you set as your annual goal. Most advanced calculators will factor in casual losses and a quality calculator should not assume you will make the same amount of PIPs on a daily basis. Allowing some wiggle room in the calculations is extremely important.

The basic calculation tool will ask your annual goal amount and will simply calculate the number of PIPs you need per day. More advanced calculators will ask how many weeks you trade on average per year, how many days per week you dedicate to trading, dollars per pip, and lots per trade. With the advanced features of a calculation tool you can come to a more accurate calculation based on your own trading schedule and trading portfolio. Failing to tailor the calculations to your portfolio could cause you to miss your goal by thousands even if you are averaging the pip per day figure.

There are several different calculators available on the Internet. Some of these computer tools are available for free download while others will charge you for use. Be aware that free calculators can be developed and distributed by anyone who knows how to computer program. If you choose to use a free tool be sure to do your research to ensure accuracy. There should be a number of reviews are pretty much every calculator on the Internet. Figure out the general consensus of the tool and see if it is accurate and reliable.

Forex trading can be a wonderful opportunity to earn extra income. If you have been trading full-time or part-time and you are ready to set goals sit down and review your trading trends. Set a realistic goal and access a Forex trading income calculator to help you achieve your goal.

About the Author

Better and reliable fx news is irreplaceable to forex success.
Including broker forex review with that news reading should be wise.