David Rodriguez from DailyFx talks about the Major Forex Currencies & Trends

By Zac, CountingPips.com

Today, I am pleased to share a forex interview and market commentary on this week’s major events and forex trends with quantitative analyst at DailyFx.com, David Rodriguez. David’s specializes in statistical studies in currency trading markets and algorithmic trading systems for the Managed Accounts Programs offered by parent company, FXCM.

* What do you think in the very short term is the main theme (or themes) in the Forex markets?

The major theme is thus far whether financial ‘risk’ markets can continue to hit lofty highs or whether an early-week pullback is the start of a larger correction. Given record correlations between the US Dollar and the US Dow Jones Industrial Average, Gold, Crude Oil, and other key risk barometers it will be critical to watch the next moves.

* The ECB followed through with its interest rate increase last week for the euro zone with more likely to come over the year. Portugal also looks likely that it will need a bailout for its debts. Do you think we could see these lingering sovereign debt issues put a dent in the European currency’s strength going forward?

The lack of market reaction to the Portuguese bailout suggests that markets had already discounted the arguably inevitable bailout for the Euro Zone’s 18th largest economy. Yet the key risk for the euro is whether sovereign debt crisis contagion will spread to similarly-indebted Spain. Initial estimates for Portugal’s bailout leave the amount of loans necessary roughly at the same capital outlay for Ireland. Yet as the Euro Zone’s fourth-largest economy, Spain would likely stretch EFSF and ESM funds beyond their limit and truly threaten stability in the single currency zone.

* The Japanese Yen showed a bit of strength at the end of last week after the recent steep selloffs. Do you feel this is likely due to profit-taking in the short-term? Do you think Yen weakness has more room to run over the long-term?

The Japanese Yen’s correlation to broader market ‘risk’ remains as high as ever. Thus we will need to watch for the next moves in the US S&P 500 and broader ‘risk’ to gauge whether the JPY can continue to recover across the board. The most recent pullback in stocks has led to similar corrections in the USDJPY, and we can expect similar declines if the S&P 500 continues lower.

* The UK consumer price index was on the economic release schedule this week and failed to live up to estimates of the annual inflation rate reaching 4.4 percent. With higher consumer prices in the UK, do you feel the bank of England is likely to be next in line to raise interest rates?

The Bank of England has expressed little real concern on rising CPI inflation, and a below-forecast print effectively sunk GBP interest rate forecasts. Overnight Index Swaps now predict that the Bank of England will raise interest rates by a relatively meager 58 basis points in the coming 12 months—down significantly from the 85bps priced in last week. The sharp correction has been a major source of recent GBP weakness and could continue to weigh on the British Pound going forward.

* The Australian dollar has continued on its spectacular run, especially against the US dollar. Do you feel this currency keeps going higher or do you see anything that could potentially take the wind out of its sails?

The key for the Australian Dollar remains whether broader ‘risk’ continues higher. That is, the currency remains strongly correlated to speculative capital flows and whether or not equity indices continue to hit fresh highs will likely decide whether the currency can set further record peaks.

* The US dollar has continued on its bearish path against the other major currencies. Looking out on the horizon over the medium to long-term, what do you see that could be a catalyst for change in sentiment of the dollar?

The US Dollar has been sold across the board on record-low interest rates and strong financial market risk sentiment. If suddenly the US Federal Reserve sees the need to tighten monetary policy and raise rates, the Greenback could recover significantly. Yet this seems unlikely at this point, and the Dollar’s more likely savior would come on a substantial correction in broader financial market risk appetite.

Thank you David for taking the time for participating in this week’s forex interview. To read David’s latest currency analysis and trading strategies you can visit DailyFx.com.

Declining Price of Commodities Pulls Down on Stock Market

Source: ForexYard

The most pressing concern in the commodities market lately has been a fear that the global economy cannot sustain sufficient growth with oil prices reaching above $100 a barrel. Investors witnessed the price of oil drop from as high as $113 last week to around $106.50 this morning. But adding into this downturn was a weakness in raw-materials prices seen over the last two trading days that inflicted pain on the stock market yesterday as commodity-linked companies felt losses as a result of this decline.

Economic News

USD – US Dollar Suffers as Fed Budget Balance Falls Short of Expectations

The US dollar’s short-term bullish run seems to have met resistance following the release of the US Federal Budget Balance yesterday at 19:00 GMT. The EUR/USD fell to as low as 1.4377 by mid-day on Tuesday as risk aversion in the global economy helped spur growth in both the USD and JPY. However, a report which showed the federal deficit shrinking much less than expected halted the greenback’s movement and pushed the EUR/USD back towards 1.4480 by yesterday’s close.

Risk aversion present in the market was initially driving the USD higher yesterday morning. Towards the end of trading, however, the greenback had shifted into a bearish posture whereas other safe havens, such as the Swiss franc and Japanese yen, continued to soar.

Economic optimism in the United States also appears to have waned these last several days as the IBD/TIPP report came in at its lowest point since July 2008. Technical pressure also appears to be weighing on the buck as many investors have added momentum to this latest downtick.

Today’s retail sales figures out of the United States may help the USD regain some of its lost strength from yesterday’s budget balance data, but risk aversion appears to be moving out of favor with the greenback. Traders may want to anticipate a continuation of the dollar’s recent slump, especially considering the economic data on today’s calendar appears to be expecting a decline in American output and optimism.

EUR – EUR Bullish Despite Weak ZEW Readings

The euro continues to make gaping strides against its currency rivals despite poor fundamentals arriving from out of the euro zone. The ZEW economic data out of Germany and the broader region both disappointed market watchers yesterday, falling significantly short of forecasts.

Regardless of these negative figures, the EUR soared against the British pound (GBP), reaching upwards of 0.8916 this morning before settling near 0.8906. Against the US dollar, the euro reached upwards of 1.4480 as of this morning. Inflation appears to be on track in the euro zone, which could help explain the steady growth of the 17-nation currency.

This morning’s inflationary figures from Germany and France may help the euro hold its recent gains, though the added weight will likely be insignificant for day traders. The afternoon’s publication of Industrial Production data could carry a slightly higher impact than it has in the past.

The persistent nuclear crisis in Japan, and rapidly climbing oil prices, has many investors concerned about industrial output figures around the globe. Europe is no exception. Should the data fall short of expectations the EUR may see a minor corrective blip, though few are expecting a reversal in value any time soon.

JPY – Unwinding Carry Trades Fuel JPY Growth

The Japanese yen appears to have maintained its steady growth from yesterday due to heightened risk aversion in the global market. A dip in US stocks yesterday, along with growing pessimism about Japan’s nuclear crisis, have helped push many investors into safe haven assets such as the yen and Swiss franc.

The island currency has gained roughly 1% against the US dollar since yesterday, and has reached towards 83.50 from the 85.50 mark touched last Wednesday. Injecting momentum into the yen’s bullishness was an unwinding of carry trades yesterday as investors felt over-exposed in the US dollar and decided to buy back into the JPY and CHF. Traders may want to watch for any additional shifts such as yesterday’s, especially considering that no impactful news will be published from Japan today.

Crude Oil – Stock Market Decline Pulls Down on Crude Oil Prices

A disconnect between oil prices and the US dollar were felt by investors yesterday. The greenback came tumbling down after a bearish report on the Federal budget balance was released, but oil prices also fell around $3 a barrel yesterday as speculators assessed weakness in the black gold’s recent bullish run.

The most pressing concern in the commodities market lately has been a fear that the global economy cannot sustain sufficient growth with oil prices reaching above $100 a barrel. Investors witnessed the price of oil drop from as high as $113 last week to around $106.50 this morning. Adding into this downturn was a weakness in raw material prices seen over the last two trading days that inflicted pain on the stock market yesterday as commodity-linked companies felt losses as a result of the decline.

At the moment, little news appears to be sufficient to bring oil prices back higher, though a turn-around in the global stock market could help fuel the growth needed to bring oil prices back into a bullish posture. Traders will want to watch the global equity markets to get a feel for where oil prices may go in the days ahead.

Technical News

EUR/USD

The Stochastic Slow on the daily chat has formed a bearish cross, indicating that downward movement is likely to occur today. This theory is supported by the Relative Strength Index on the 8-hour chart, which is currently in overbought territory. Going short may be the wise choice today.

GBP/USD

The GBP/USD has gone bearish yesterday, and currently stands at the 1.6255 level. The daily chart’s Slow Stochastic supports this currency cross to fall further today. However, the 4-hour chart’s Stochastic Slow signals that a bullish reversal will take place today. Entering the pair when the signs are clearer seems to be the wise choice today.

USD/JPY

The pair has been range-trading for a while now, with no specific direction. The Daily chart’s Slow Stochastic providing us with mixed signals. All oscillators on the 4 hour chart do not provide a clear direction as well. Waiting for a clearer sign on the hourlies might be a good strategy today.

USD/CHF

This pair has recorded much bearish behavior in the past several days. However, the technical data indicates that this trend may reverse anytime soon. For example, the 8-hour chart’s RSI signals that a bullish reversal is imminent. An upward trend today is also supported by the daily chart’s Stochastic (slow). Going long with tight stops may turn out to pay off today.

The Wild Card

EUR/GBP

Technical indicators are providing us with strong signals that this pair is likely to face a downward pressure today. A bearish cross on the daily chart’s Slow Stochastic and the Relative Strength Index (RSI) on the 8-hour chart are just two examples showing a likely downward correction will occur. Forex traders have an excellent opportunity to short their positions at a great entry price, before the correction takes place.

Forex Market Analysis provided by ForexYard.

© 2006 by FxYard Ltd

Disclaimer: Trading Foreign Exchange carries a high level of risk and may not be suitable for all investors. There is a possibility that you could sustain a loss of all of your investment and therefore you should not invest money that you cannot afford to lose. You should be aware of all the risks associated with Foreign Exchange trading.

Daily Market Review for the 13.04.2011

EUR-USD

Time: 22:30 Rate: 1.4483

Strategy: short

Daily time frame

The price completed the upward movement on the level of 1.4530 by the harmonious patter AB=CD, and the resistance of the upper side of the parallel upward channel (fragmented red). We believe that the upward movement will stop in this area, and the price will retrace the continuous last upward movement (CD), as between the level of 1.4330 to 1.4200.

As can be seen by the graph bellow:


4 hour time frame

The price ranges in an upward parallel channel (fragmented red), and stops in its upper side on the level of 1.4520. The break out of the price at this level, and the price will get to the level 1.46. We believe that the movement will break down the level of 1.4437, and from there will downtrend for retracement of third until two thirds of the last continuous upward movement (broken blue line).

Potential trade

Short

Enter:  1.4430

Stop: 1.4530

Target: 1.4330

As can be seen by the graph bellow:


GBP-USD

Time: 22.50 Rate: 1.6250

Strategy: short

Daily time frame

As was mentioned in the daily market review of yesterday the price stopped and retraced a third of the last continuous upward movement. We believe that the price will continue to retrace this movement toward the level of 1.6110.

As can be seen by the graph bellow:


4 hour time frame

As was mentioned in the daily market review of yesterday the price is on its way toward the level of 1.62 in the first stage, and if this level will break the second target is 1.6110 (see daily time frame)

As can be seen by the graph bellow:


Important news for the 13.04.2011

Time: 11.30 GBP Claimant count change

Time: 15.30 USD core retail sales m/m  

Time: 15:30 USD Retails sales m/m

Time: 17.30 CAD BOC monetary policy report


RISK DISCLAIMER

Forex trading involves high risk. Before any trade, you should consider carefully the investment objectives and the level of risk. The data sent by mail is not necessarily real-time data or precise. Real-Forex is not liable for the losses resulting from the utilization of the data. Real-Forex (Finnocorp Trading Solution Ltd

.) is not liable for losses or damages as a result of reliance on the information provided by e-mail or on the overall data, quotes, charts, signals buy / sell. It is hereby clarified that the investor must be aware of risks involved in trading in financial markets, which is a form of investment that may contain potential risks.

Real-Forex team

Trade like the pro’s with a true ECN Forex broker

Upturn Seen On EEI Corporation

EEI Corporation, yuchengco, ron acoba, inverted head and shoulders, stock market trading, daily stock picks

If any of you guys missed the recent run-up in the market particularly in the property stocks, don’t fret. You see, there are a lot of technically sound issues nowadays. An example of which is the Yunchengco-led EEI Corporation or simply EEI in the Philippine Stock Exchange. 

EEI has been showing signs of a possible bullish reversal since it has been bottoming into an inverted head and shoulders pattern for about 2 and a half months now. Notice in the chart above that the right shoulder is almost completed. Hence, if EEI is able to move past the formation’s neckline at  PHP3.80, it then could aim for its upside target of PHP 4.30. EEI’s shares, however, has been trading really thin (no volume). For a valid breakout, therefore, to occur, a move past the PHP 3.80 resistance should then be supported by a spike in volume. Otherwise, you might get whipsawed. Say you’re able to buy on breakout at PHP 3.85, given the computed upside target, you could potentially have a return of about 11.68%.

Caveat.

More on LaidTrades.com

Gold Aiming For $1,650 Per Ounce!

gold, XAUUSD, commodities, commodities market, commodities trading, inverted head and shoulders continuation, ron acoba

Bling! Bling! Who wants to join the global gold rush? Just recently the price of gold set a new all-time high at $1,476.22 per ounce. Despite trading at this level, it appears that is some more upside on gold. 

As you can see from its daily chart, XAUUSD or gold has recently broken out from an inverted head and shoulders continuation pattern. Now, if you project the height of the pattern from the point of breakout, an upside target of $1,650.00 could be determined. Presently, though, it is already trading at an overbought condition. Given this, it could move sideways for awhile or retrace a bit back at the neckline of the pattern before it aims for $1,650.00. The previous neckline resistance should now play as a support that could launch it towards the said target. A break, however, of this support could bring it back to around $1,400.00. Nonetheless, its overall bias remains bullish given its present trend.

More on LaidTrades.com

Crude Oil Sets A 2-Year High!

Last April 1, I mentioned that WTI Crude Oil, as for my technical analysis, could be forming a n ascending triangle pattern (kindly check here) and upon break out, it could reach an upside target of 115.00 USD. Shortly after I posted it, the triangle’s resistance was cleared out as the buying pressure strengthened. From the $106.94 breakout point, crude oil closed at a 2-year high of $113.07 last Friday which means people will now be paying additional 5% for their automobile’s gasoline. I may be wrong but based on the bullish triangle pattern and the strong price closing, it could still hit $115.00. I prefer not. On the downside, in case the crude oil price drops, the current support is the 2-month uptrend. If that breaks, the next support could be the triangle’s resistance.

More on LaidTrades.com

Red Flag On Alliance Global Group, Inc.

alliance global group inc., AGI philippine stocks, symmetrical triangle, bearish breakaway gap, andrew tan, ron acoba, daily stock picks, stock market trading

Warning! The shares of Andrew Tan-led Alliance Global Group, Inc. or AGI in the Philippine Stock Exchange could slide further given their recent price action. Let me show you how. 

Well, AGI had been consolidating within a symmetrical triangle for a little four months. All along I thought that it was setting up for another bullish because of its run-up during the previous year. It was even one of the few issues, along with San Miguel Corporation (SMC), which held their ground when the general market made a correction following 2010′s stellar performance. However, it appears that AGI’s luck has changed when it broke down from the said symmetrical triangle pattern. In fact, its breakdown was more pronounced when it made a bearish breakaway gap. Given this and the fact that AGI has failed to fill the gap within three days suggests that it would continue to fall further. If it does, it could fall down to its downside target of around PHP 9.80 (computed by projecting the height of the triangle from the point of breakout.

On the fundamental side, AGI sold some of its treasury shares and secondary shares that were owned by its subsidiary, Megaworld Corporation. All in all, it raised PHP 9.73 billion at PHP 11.16 per share which will be mainly infused in the development of new projects for the newly acquired Fil-Estate Land (GERI). Majority of those which bought AGI at a discount quickly took profits since at that time it was still trading at around PHP 12.00. At present, AGI is still trading slightly higher than the discounted price at PHP 11.16. Therefore, some of the institutions that got it at that price could still make a quick buck by selling it. This in turn would weigh on the price of the stock at least in the near term.

More on LaidTrades.com

Buying Opportunity On Ayala Land, Inc. (ALI)

ayala land inc., ALI philippine stocks, cup and handle, ron acoba, jaime zobel de ayala, daily stock picks, stock market trading

“Float like a butterfly, sting like a bee.” Just Like what happened in the Thrilla In Manila, Ayala Land, Inc. or ‘the ALI’ of the Philippine Stock Exchange appears to have found its second wind after faltering for about seven months now.

You see, ALI had been trading on a downward slope since it peaked at PHP 18.70 back on September 9, 2010. It gradually fell and even marked a low of PHP 13.70 this February. Luck, however, turned to its favor when it rebounded from the said low and eventually broke free from its seven-month downtrend line. All along, it was in fact bottoming into a bullish complex cup and handle pattern.

Three trading days ago, ALI broke out from the mentioned cup and handle formation. Now, if we project the height of the cup from the point of breakout, we would get a target price of just above PHP 18.00. With the RSI, though, in the overbought territory already, ALI could lay off for awhile before it continues its ascent. Therefore, any dip in its prices as long as it stays above PHP 16.00 could be taken as a buying opportunity.

More on LaidTrades.com …

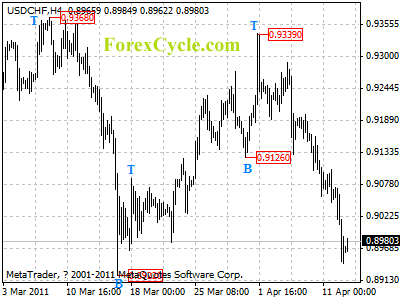
USDCHF’s fall extended to 0.8942

USDCHF’s fall from 0.9339 extended to as low as 0.8942. The pair is now facing 0.8922 previous low support, a breakdown below this level will confirm that the long term downtrend from 1.1730 (Jun 1, 2010 high) has resumed, then the following downward move could bring price to 0.8500 area. Resistance is at 0.9050, only break above this level could indicate that lengthier consolidation of long term downtrend is underway, then further rise could be seen to 0.9200 zone.

usdchf

Daily Forex Forecast