My Forex & Stocks Update: Still favoring long Stocks and Commodities

By Chris Vermeulen, thegoldandoilguy.com

So far in 2011 the equities market has made some sizable whip saw type moves that even veteran traders have had difficulty being on the right side of the price action. The year started out with equities being very overbought and extended making is virtually impossible for a low risk trader to buy on pullbacks. This was primarily due to the fact that there were no real pullbacks other than for a day or two which was immediately followed by prices continuing to grind higher.

In March, we finally had the pullback everyone was waiting for which we caught 4% of the sell off using an inverse ETF. Then we saw the bottom a few days later and caught a 3% gain from near the lows during a rally higher. So as you can see there have been three trends in the SP500 so far this year and we are about to see another sizable move unfold in the coming week.

In the past 8 sessions we have seen the market pullback slightly and the big question everyone is asking is do we get long or do we short here? Below are my thoughts and analysis….

US Dollar Index – Daily Chart
The dollar is still in a very strong down trend. As long as it continues to fall we should see higher stock and commodity prices. I do feel as though there is more downside for the dollar but its nearing an end. Stepping back and looking at the longer term chart of the dollar is very clear that it is getting oversold and sizable bounce should take place. If we see the dollar breakout of this falling wedge and start to rally you will want to be short stocks and commodities.

SPY ETF (SP500 Index Fund) Daily Chart
When comparing the Dow Jones Industrial Average and the Russell 2K indexes it is rather obvious that both have performed well this year and have broken above the February highs. The DOW was strong because it has it is exposed to energy stocks and with oil rocketing higher, it has helped those energy based stocks lift the index higher. The Russell 2K consists of small cap stocks and with the general public still being so bullish on the equity markets and investors are buying volatile, high risk small cap stocks to help boost their gains.
Now, looking at the SP500 it has yet to break the February high and this is because it holds several large tech stocks and financial stocks which have been lagging the overall market so far this year. Tech stocks and financials tend to lead the market and the fact that they are not is of great concern to me.
So going back to the US Dollar, I feel as though it has a little more downward motion left which will help get the SP500 to a new yearly high. Once the dollar rally starts, it will crush stock and commodity prices for several months.


Weekend Trend Conclusion:
In short, I favor the long side for both stocks and commodities, but that can change on a dime once the dollar starts to rally. There are many negative factors coming together that give me a negative outlook on stocks and commodities for the next 2-4 months and they are:

1. Quantitative Easing is now done = rising dollar
2. Investor sentiment is at an extreme bullish level = typically a bearish sign for stocks
3. The Sell In May and Go Away is almost here…
4. Earning season is here and that is typically a time when stocks get sold into = lower stock prices

My final thought is to keep positions small and be ready to flip positions from long to short and vise versa depending on what you trade…

Get My Free Trading Rule Guide And My Weekly Newsletter Here: http://www.thegoldandoilguy.com/trade-money-emotions.php

Chris Vermeulen

UK Growth Expected to Decline

The British economy continues to wrangle with very weak growth even as consumers are being hammered by surging prices. The result is an inflation rate double the target “ideal” of two percent annual inflation. And while the last few years have not been a walk in the park, there appears little prospect for immediate relief.

In a speech delivered in mid December, Charles Bean, Deputy Governor for Monetary Policy and member of the Monetary Policy Committee (MPC), noted that the economy is showing signs of improvement, but cautioned that “it may be some while yet before normality is restored”.

That assessment was made four months ago and one would be hard-pressed to see any progress since then. Indeed, for the first quarter of the year, the situation may have actually worsened.

For four straight quarters in 2010, Gross Domestic Product made positive gains yet for the first quarter of this year, GDP actually fell by 0.5 percent. Despite this, the government still expects growth for the full year to be in the range of 1.7 percent – this may prove to be a bit optimistic.

Last week, the International Monetary Fund (IMF) reduced its outlook for the UK from 2 percent growth to 1.7 percent. The Organization for Economic and Development (OECD) cut its position even deeper dropping its earlier 1.7 percent prediction to just 1.5 percent. This makes it unanimous – the 2011 perspective for the British economy is actually bleaker now than at the beginning of the year.

Adding to the quandary is that consumer prices are rising at a much faster rate than overall growth. According to Britain’s Office for National Statistics, consumer prices rose another four percent in March following a 4.4 percent increase in February. The resulting inflation is rapidly outpacing gains in salaries and wages and is seriously undermining consumer buying power.

Consumer Price Index – Annualized Rate

Nov 2010 – 3.2%

Dec 2010 – 3.3%

Jan 2011 – 4.0%

Feb 2011 – 4.4%

Mar 2011 – 4.0%

Will Get Worse Before It Gets Better

Like several other developed economies, England faces a huge deficit made worse by the recession’s double whammy of reduced tax revenues and greater expenses arising from monetary stimulus to support the economy. Truth be told however, Britain has struggled with deficits for many years now and the situation has finally reached the point where it can no longer be ignored. Even with higher revenues expected this year, the budget shortfall for the current year is estimated at £140 billion (US$228.5 billion).

In its last budget, the government outlined plans to introduce significant spending cuts to the tune of  £83 billion (US$133.5 billion) over the next four years. This is thought to be sufficient to balance the budget assuming higher government revenue as the economy recovers. This also assumes that the spending cuts will not impact those revenues and this is where things tend to get a bit sticky.

For the past six months, Bank of England Governor Mervyn King has argued against hiking interest rates to deal with the mounting inflation. King defends his position by blaming rising food and energy costs for a “temporary” spike in consumer prices suggesting that “core” inflation is actually quite low. King also suggests that as the impact of government’s spending cuts take effect, overall growth could decline even further.


Scott Boyd is a currency analyst with OANDA and comments on the MarketPulse FX blog site.


FOREX: Large Currency Speculators add to Japanese Yen shorts. Euro, NZD positions rise

By CountingPips.com

The latest Commitments of Traders (COT) report, released on Friday by the Commodity Futures Trading Commission (CFTC), showed that large futures speculators trimmed their short positions of the US dollar against the other major currencies while continuing to raise bets against the Japanese yen. Non-commercial futures positions, those taken by hedge funds and large speculators, were overall net short the US dollar by $25.11 billion against other major currencies as of April 12th. The data is a decline from the total short position of $25.18 billion on April 5th, according to the CFTC data and calculations by Reuters which calculates the dollar positions against the euro, British pound, Japanese yen, Australian dollar, Canadian dollar and the Swiss franc.

This week’s notable changes were Japanese yen positions declining for a third straight week to the lowest level in almost a year while euro positions rose for a fourth straight week and to their highest level in over a year.

EuroFx: Currency speculators increased their net long positions for the euro against the U.S. dollar for a fourth consecutive week. Futures positions in the euro rose to a net total of 64,985 long positions as of April 12th following a total of 59,857 long positions on April 5th.

EUR, COT

The COT report is published every Friday by the Commodity Futures Trading Commission (CFTC) and shows futures positions as of the previous Tuesday. It can be a useful tool for traders to gauge investor sentiment and to look for potential changes in the direction of a currency or commodity. Each currency contract is a quote for that currency directly against the U.S. dollar, where as a net short amount of contracts means that more speculators are betting that currency to fall against the dollar and net long position expect that currency to rise versus the dollar. The graphs overlay the forex spot closing price of each Tuesday when COT trader positions are reported for each corresponding spot currency pair.

GBP: British pound sterling bets dipped as of April 12th to a total of 26,671 net long positions after rising the week before to a total of 32,414 long contracts on April 5th.


JPY: The Japanese yen net contracts declined for a third straight week. Yen contracts decreased to a total of 52,877 short contracts following a total of 43,231 net short contracts reported on April 5th. This is the lowest level for yen contracts since May 4,2010 when short contracts totaled 65,612.


CHF: Swiss franc long positions moved higher after decreases lower for three straight weeks. Franc positions increased to a total of 14,657 net long contracts following a net of 10,843 long contracts on April 5th.


CAD: The Canadian dollar positions edged lower to a total  of 63,741 contracts as of April 12th after CAD net contracts had risen to a total of 65,030 net long contracts on April 5th.


AUD: The Australian dollar long positions were just about unchanged last week near the highest level in over a year. AUD contracts totaled a net amount of 90,651 long contracts as of April 12th after AUD positions had totaled 90,938 net long contracts on April 5th.


NZD: New Zealand dollar futures positions increased higher for a fourth consecutive week. NZD contracts increased to a total of 6,336 long positions as of April 12th from a total of 2,695 long contracts on April 5th.


MXN: Mexican peso long contracts rebounded to a new high for the year at a total of 124,846 net long contracts on April 12th. MXN positions had increased the week before to a total of 119,062 long contracts as of April 5th.

COT Data Summary as of April 12, 2011
Large Speculators Net Positions vs. the US Dollar

EUR: +64,985
GBP: +26,671
JPY: -52,877
CHF: +14,657
CAD: +63,741
AUD: +90,651
NZD: +6,336
MXN: +124,846

Further COT Resources from around the web:


Euro Zone Struggling Once More with Debt

Source: ForexYard

Though the USD is gaining ground on the euro, the blame lies not on US strength but in euro zone weakness. The EUR failed to break above key resistance levels and promptly dropped as a result, pushing the EUR/USD pair back towards 1.4375 as of this morning.

Economic News

USD – US Dollar Bullish as Euro Zone Struggles with Debt Woes

The US dollar has continued to make gains against most of its currency rivals in trading as we head into this week’s start. Though the USD is gaining ground on the euro, the blame lies not on US strength but in euro zone weakness. The EUR failed to break above key resistance levels and promptly dropped as a result, pushing the EUR/USD pair back towards 1.4375 as of this morning.

The GBP/USD underwent a similar bearish twist, as the pair spiked up over the past week to trade near 1.6385 before coming down gradually this morning, trading right at the 1.6300 price mark at 6:00 GMT. The greenback was also able to push higher versus the Japanese yen, as the island economy continues to struggle with reconstruction efforts meant to stave off further nuclear disasters.

With a light news day ahead, traders will likely be watching the series of speeches being delivered from members of the Federal Open Market Committee (FOMC) as they speak about regulatory reform, risk management and economic outlook. Each of these speeches carries the potential to affect currency values as speculators attempt to analyze any hints at interest rate changes.

EUR – EUR Bearish on Regional Debt Concerns

The euro has turned bearish against most of its currency rivals after the pair failed to breach key resistance levels and then fell on renewed concern over sovereign debt. The EUR/USD has fallen to 1.4375 as of this morning and does not appear to be revealing any signal of correcting back up in the near future. The EUR/JPY has also revealed sudden weakness, reaching down towards 119.13 in today’s early morning trading.

The region continues to grapple with debt concerns from Portugal and Spain, but area-specific shifts in risk appetite have helped drive the EUR’s surge last week. Soaring oil prices also supported the euro as the US dollar came under pressure, but such strength may have overextended the euro and is now applying heavy weights to its value.

With only a minor confidence report expected out of the euro zone, the 17-nation single currency is expected to maintain its current course against its currency rivals in the hours ahead. Tomorrow’s news should be much more affecting on the region’s currency values, but as for today traders may want to look to the USD for market direction.

JPY – JPY Trading Higher as Europe Suffers Strains

The Japanese yen rose against its major counterparts in early Asian deals on Monday. Presently, the yen is trading at 82.88 against the U.S. dollar and 135.07 versus the pound. Against the euro, the yen is trading much higher at 119.13, compared to an early Asian session’s multi-month low of 123.35.

Growing concerns regarding Japan have driven the JPY lower recently amid deteriorating fundamentals out of the island economy. But those weakening fundamentals are being offset by debt concerns out of Europe as the European Monetary Union (EMU) persists in dealing with a burgeoning debt crisis that simply won’t dissipate. For today traders will want to look to the USD for market direction, but so long as Europe continues to fear rising debt out of Spain and Portugal, going long on the yen may continue to remain appealing.

Oil – Crude Oil Price Climbing; Strong USD in its Way

Oil prices have turned upward heading into this week, with the price elevating itself beyond $109 a barrel as of this morning. Continued fighting in Libya is partially behind the sell-resistance among global commodities like oil. Concerns about Japan’s reconstruction, declining production, and ever-present nuclear crisis are also pushing economic fundamentals in a direction favoring the purchase of physical assets.

The only counterforce to enter the market at the start of this week, however, was a resurgent USD versus its main rival, the EUR. If the dollar can continue to make gains, buyers may begin to shift out of oil purchases as they become too expensive. Traders will be eyeing further events in the Middle East this week as the risk of crude oil supply disruptions could continue to spread throughout the region, especially as protests in Syria become more volatile.

Technical News

EUR/USD

In overnight trading the pair dipped below the short term support at 1.4365 and is back above this level at the opening of European trading. Traders should be looking to buy the euro on a dip to the rising trend line from the January low and the 20-day moving average. The two coincide near 1.4300.

GBP/USD

The pair’s weekly low at 1.6225 coincided with the previous trend line off the 2007 high and rising weekly stochastics hint at further gains. As such, the pair could move higher with initial targets at 1.6460 followed by 1.6880.

USD/JPY

Downside momentum is building as the pair is unable make any new highs. A move below 82.80 would target 82.00 with a further move towards the 80.20 level. Resistance is located at 83.50 and 84.00.

USD/CHF

Last week the pair dipped below the 0.8900 level but failed to make a close below it, a signal that this support level may temporarily hold. Rising daily stochastics point to a move higher, potentially to the previous lower channel line off of the October low which comes in today at 0.9070.

The Wild Card

NZD/USD

The pair failed to move above the 0.8000 resistance line and pulled back to 0.7930. A big round number may have a psychological effect on traders and can serve as a resistance or support level. Both weekly and daily stochastics are overbought and a pullback in the pair may be in order before a retest of 0.8000. Forex traders may find buying opportunities at the support level of 0.7830 with a target at the 2008 high at 0.8200.

Forex Market Analysis provided by ForexYard.

© 2006 by FxYard Ltd

Disclaimer: Trading Foreign Exchange carries a high level of risk and may not be suitable for all investors. There is a possibility that you could sustain a loss of all of your investment and therefore you should not invest money that you cannot afford to lose. You should be aware of all the risks associated with Foreign Exchange trading.

Daily Market Review for the 18.04.2011

NZD/USD

Time: 07:30  Rate: 0.7945

Strategy: short

Considerations:

Weekly time frame:

Wolf deviation in the indicators – potential for short in a shorter time range.

As can be seen by the graph bellow:  


Daily time frame:

Opening of the week on the downward graph after a continuous upward movement of 880 pips

There was no third retracement in the upward movement

The resistance point of the high – 0.7980 5 of November 2010 (purple line)

The round resistance point – 0.8000

The level of 127.2 Fibonacci in 0.8018 of the downward movement C-D

As can be seen by the graph bellow:


4 hour time frame:

Short in the breakdown of the candle’s low (black dashed line)

First target the retracement area of 23.6% Fibonacci + round number 0.7800

Second potential retracement target 38.2% Fibonacci 0.7670

As can be seen by the graph bellow:


Potential Trade:

Short in the candle’s low breakdown 0.7920

Stop: 0.8030

First target: 0.7800

Second target: 0.7670

AUD/JPY

Time: 08:30  Rate:8765

Strategy: Short

Daily time frame

Considerations:    

Stop in an important Fibonacci level (161.8%)

Continuous upward movement of 21% without retracement

Reversal Japanese pattern called “black cloud”

As of now, CC150 >100 entrance to short in the condition CC150 <100

Technical retracement target (38.2% Fibonacci) 84.20

As can be seen by the graph bellow:    


4 hour time frame:

CC150 < 0

Enter in the breakdown of 86.85

Completed pattern AB=CD to a short target 85.40 (potential D point)

As can be seen by the graph bellow:


Potential Trade:

Short in the breakdown 86.85 in condition CC150<100 in the daily time frame

Stop over the last high (4 hour time frame)

First target: 86.85

Second target: 84.20  


RISK DISCLAIMER

Forex trading involves high risk. Before any trade, you should consider carefully the investment objectives and the level of risk. The data sent by mail is not necessarily real-time data or precise. Real-Forex is not liable for the losses resulting from the utilization of the data. Real-Forex (Finnocorp Trading Solution Ltd

.) is not liable for losses or damages as a result of reliance on the information provided by e-mail or on the overall data, quotes, charts, signals buy / sell. It is hereby clarified that the investor must be aware of risks involved in trading in financial markets, which is a form of investment that may contain potential risks.

Real-Forex team

Trade like the pro’s with a true ECN Forex broker

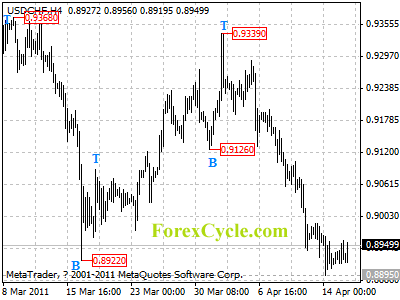
USDCHF remains in downtrend from 0.9339

USDCHF remains in downtrend from 0.9339, and the fall extended to as low as 0.8895, the price action from 0.8895 is treated as minor consolidation of downtrend. Another fall would likely be seen after consolidation, and next target would be at 0.8800 zone. Resistance is at 0.8975, only break above this level will indicate that lengthier consolidation of downtrend is underway, then range trading between 0.8895 and 0.9050 could be seen to follow.

usdchf

Daily Forex Forecast

Lopez Holdings Corporation (LPZ) Makes A Swing Up

Lopez Holdings Corporation which used to be Benpres Holdings Corporation hit the 2nd place in today’s most active stocks in value traded. For those who do not know, this company serves as the holding company of the Lopez family for investments in major development sectors such as broadcasting (ABS-CBN) and cable (Sky Cable); telecommunications (Bayan Tel); power generation and distribution (First Philippine Holdings, Energy Development Corporation); and banking among others.

LPZ which is its stock symbol in the Philippine Stock Exchange went up today by 5.19% to PHP5.67. This gain propelled the breakout from the 1-month symmetrical triangle chart pattern with heavy volume. Based on the size of this of this triangle, we could get a minimum upside target price of PHP6.10 within a month as seen in the chart above.

In the bigger picture, the 1-month symmetrical triangle apparently looks like the handle of a 4-month cup and handle formation. This could also look a like an inverted head and shoulders or even a rectangle pattern for others.  Regardless of what this consolidation may look like, as long as the PHP5.75 resistance gets cleared out, we could get a conservative target price OF PHP6.90. I got this by adding the height of the consolidation to the possible breakout point. However, before it gets to that level, it first needs to clear out the 11-year all-time high of PHP6.60. In case things don’t go well for the stocks, the immediate support could be the 2-month uptrend. If that breaks, the next support could be the 2-year uptrend.

More on LaidTrades.com