European Wrap: Usual Monday dross; By FastBroker Research Team

Written by FastBrokers House

EUR/USD sits at 1.4045, some 9 pips below where it was when I came onboard.  Buy orders seen 1.4000/20, sell orders 1.4090/00 and neither set of orders ever really looked threatened.

Cable down at 1.5975 from early 1.6010, having been as low as 1.5934 at one stage.  Stops tripped through 1.5980 and 1.5950 accelerating the sell-off.  Investment bank selling noted.  Also reports of large sell order in GBP/AUD going through early, said to be linked to insurance payments for Queensland floods.

EUR/GBP up at .8795 from early .8775, real money buying noted out of the gate.   Talk of stops above 8820, but also conflicting reports of sell orders lined up in .8820/30 area.  In the end we got as high as .8819 before turning south.

AUD/USD up at 1.0280 from early 1.0260, having been as high as 1.0314 as 1.0300 barrier option interest was taken out.  Talk of decent GBP/AUD sell interest helped buoy the pairing.  As did the Reserve Bank of Australia tipping huge capital inflows (see above)

USD/CHF down at .9185 from early .9210,  EUR/CHF down at 1.2903 from around 1.2943, having been as low as 1.2889. Swissy garnered a little strength from IMF raising spectre of early SNB rate hike.

USD/JPY unchanged at 81.70 in very quiet trade.


Market Commentary provided by FastBrokers.

Disclaimer: FastBrokers’ market commentary is provided for information purposes only and under no circumstances should be regarded neither as an investment advice nor as a solicitation or an offer to sell/buy any financial product. FastBrokers assumes no responsibility or liability from gains or losses incurred by the information herein contained.

Risk Disclosure: There is a substantial risk of loss in trading futures and foreign exchange. Please carefully review all risk disclosure documents before opening an account as these financial instruments are not appropriate for all investors.

Asian market wrap; By FastBroker Research Team

Written by FastBrokers House
2011-03-28 00:00

EUR/USD opened lower in Asia after closing in NY at 1.4080 on Friday. The heavy losses suffered by Angela Merkel in German regional elections were the main reason. Heavy stops were triggered below 1.4050 but strong bids emerged starting at 1.4020 and they stalled bearish momentum. Ranges: EUR/USD 1.4019/69, EUR/CHF 1.2912/54

USD/JPY has ground its way higher throughout the day as the bulls have been heartened by reports that Kampo has been consistently buying during last week and also that the offers near 82.00 are much smaller than they were on the intervention day. Ranges: 81.33/78, EUR/JPY 114.19/94

The AUD has maintained the strength shown last week with option buyers now joining in on the M&A flows. Barrier options at 1.0300 are stalling for now but bullish momentum remains strong. Ranges: 1.0232/66

Cable also opened lower after the London riots and the Posen comments also added to bearish sentiment. It was unable to break below strong bids near 1.6000 but the much deeper European market is likely to test it again. Ranges: Cable 1.5998/1.6020, EUR/GBP .8758/85

Market Commentary provided by FastBrokers.

Disclaimer: FastBrokers’ market commentary is provided for information purposes only and under no circumstances should be regarded neither as an investment advice nor as a solicitation or an offer to sell/buy any financial product. FastBrokers assumes no responsibility or liability from gains or losses incurred by the information herein contained.

Risk Disclosure: There is a substantial risk of loss in trading futures and foreign exchange. Please carefully review all risk disclosure documents before opening an account as these financial instruments are not appropriate for all investors.

The Safest Way to Play Commodities

By Sara Nunnally, Editor, Smart Investing Daily, taipanpublishinggroup.com

We’ve seen gold and oil prices skyrocketing these past couple of months. We’ve seen food prices spark major uprisings in the Middle East, and new governments are taking shape even as commodities like corn are starting to trade higher again.

The swings in commodity prices may put some investors off. Gold is near all-time highs, but has climbed $35 in the past five days.

I’m sure many people are questioning how much higher commodities can get.

We’ve talked about the fundamentals behind a number of commodities, like agricultural commodities, precious metals and oil. We tend to be long-term bulls on commodities in general, but we understand that such high prices could make people wary of jumping in with a large chunk of money.

Well, I’d like to share with you the safest way to play commodities.

It’s not with options or ETFs, or even commodity-based companies. It’s with a CD… and it’s got commodities covered.

It’s EverBank’s MarketSafe® Diversified Commodities CD.

Here’s the breakdown: This CD is equally weighted in WTI Crude Oil, Gold, Silver, Platinum, Soybeans, Corn, Sugar, Copper, Nickel and Lean Hogs. That means each of these commodities makes up 10% of the portfolio.

The term for the CD is five years, and the minimum amount you can invest is $1,500.

But here’s the best part, and it’s why this is the safest way to play commodities. As a MarketSafe® CD, 100% of your principal is protected.

That’s not a typo. If, at the end of five years, commodities have not generated a return, you get 100% of your deposited principal back.

Would you rather buy 30 shares of a gold mining company like Barrick Gold Corp. (ABX:NYSE), and risk losing money? Or would you rather park $1,500 in a safe CD with zero downside risk?

I think a lot of people would be more interested in 100% safety.

That’s why EverBank has extended its deadline for funding this MarketSafe® Diversified Commodities CD to May 5, 2011.

(Investing doesn’t have to be complicated. Sign up for Smart Investing Daily and let me and my fellow editor Jared Levy simplify the stock market for you with our easy-to-understand investment articles.)

Now, I know some people would rather be able to get in and get out of an investment whenever they want, and that is one of the drawbacks of a CD, particularly with a term of five years. I do think, however, that the low minimum investment does make this CD more attractive.

Of course, you can put as much as you want into this CD, and you’re FDIC insured for up to $250,000.

The other possible drawback is that your upside is limited.

From EverBank’s MarketSafe® Diversified Commodities CD Fact Sheet:

Maximum Market Upside Payment: The sum of the average returns for years 1-5, based on the Spot Price as of each Pricing Date relative to the Spot Price on the Initial Value Date, subject to a 10% cap and -20% floor for each commodity.

So, let’s decode what this actually means. Each of the 10 commodities can grow as much as 10%. If gold, for example, grows 15%, only 10% is counted toward your return.

That means you could be leaving some money on the table if you chose to invest in this CD and commodities really take off.

On the other hand, an annual loss is halted at 20%. So if oil decides to drop big time, like it did just during the global financial crisis, your loss for that year could only be 20%. But remember, your principal is 100% protected, so any loss only impedes potential gains, not your initial investment capital.

Now, let’s talk about what pricing date, spot price and initial value date mean.

The initial value date for this CD is May 12, 2011. This is when EverBank first starts tracking the spot price of each of the 10 commodities. Each year for the full five years of the CD’s term, EverBank will use May 12 as its pricing date.

So, for example, if crude oil is trading at $100 a barrel on May 12, 2011 (and EverBank uses the closing price as the day’s spot price) and $109 a barrel on May 12, 2012, the CD locks in a 9% gain for the first year.

Then the calculation starts over with $109 a barrel as the “initial” value for the second year of the CD.

The next thing you need to know is that the averaged gains from all 10 commodities are added together each year.

That means on May 12, 2012, EverBank adds the gains (or losses) from each commodity and divides by 10 for the average gain for the year. It does this for each of the five years of the CD’s term, and gives the investor a cumulative return when the CD matures on May 17, 2016.

This again means your upside is limited. Because EverBank takes an average of all 10 commodities for the annual “return,” and each commodity is capped at a 10% gain, each year’s return is limited to a 10% gain… for a total possible return of 50%.

Now, that’s not a bad return in anybody’s book, but you’d have to wait five years to see it.

In my opinion, because of the guaranteed principal protection, this is worth a hard look for anyone wanting to diversify their portfolio into commodities. Heck, you can always augment this CD with investments in commodity-based ETFs, companies and even futures.

In years when oil is booming you can look to oil producers for an added gain. Gold screeching higher? Grab a mining company or two.

But always rest assured that at least some of the money you’ve invested in commodities through EverBank’s MarketSafe® Diversified Commodities CD is 100% principal protected.

You can learn more about this CD here.

*Note: We firmly stand behind EverBank and their products and think they are a solid way to grow your wealth. But you should know that we also have a business relationship with the company and receive a financial benefit from the sales of this product.

Editor’s Note: The dying wish of an elderly San Diego woman could pay you $4,000. It was “Mary Catherine’s” final wish to give all of the money in her estate to charity. That estate is worth around $9.4 billion. And you could claim your share of it before the end of April. Learn more about Taipan’s New Growth Investor.

About the Author

Sara is Managing Editor of Smart Investing Daily. As Senior Research Director and global correspondent, Sara Nunnally’s diverse resume includes studies in art history, computer science and financial research. She has appeared on news media such as Forbes on Fox, Fox News Live, and CNBC’s Squawk Box, as well as numerous radio shows around the country. Most recently, Sara co-authored a book with Sandy Franks called, Barbarians of Wealth.

As Senior Research Director, global correspondent and managing editor of Smart Investing Daily, Sara has traveled all over the world in search of the best investment opportunities to recommend to her readers, be they in developed economies like France and Italy, in emerging markets like the Czech Republic and Poland, or in frontier terrain like Vietnam and Morocco. Her unique “holistic” approach of boots-on-the-ground research has given her an edge in today’s financial marketplace as she searches for the next investment opportunities in hot sectors like alternative energy, currency markets and commodities.

Buying EUR/USD on Rising Momentum

By Russell Glaser

The euro has been fairly resilient in the face of significant negative news events surrounding the failure to reach a bailout agreement for Portugal and the subsequent ratings downgraded. The pullback in the value of the EUR/USD is only natural but the lack of a major decline shows a strong trend. As such, traders may find a short term trade setup with a rebound in momentum.

Last week’s failure to take out the 1.4280 resistance does not bode well for the EUR/USD in the short term. Significant resistance now lies at 1.4250 off of the falling trend from the 2008 and 2009 highs. A move above this resistance would spur further buying to the 1.4580 level.

Last week the pair reached a high of 1.4247 before falling to a low of 1.4020 during today’s Japanese session. However, the declines were limited to roughly two cents The market’s muted reaction to the negative news should be taken as a positive for the euro.

Traders may look to enter long on the pair following an exhaustion of the correction. One signal may be a rebound in the Momentum (7) indicator rising above the 100 level.

The weekly chart shows the stochastics are in an overbought state which may signal a further decline in the pair. A move below 1.4020, a level that coincides with the 20-day moving average could send the pair lower to the trend line that rises off of the January 2010 lows. A sharp decline could take the pair to its next support level at 1.3860 where a breadth of stop loss orders may be found.

Forex Market Analysis provided by ForexYard.

© 2006 by FxYard Ltd

Disclaimer: Trading Foreign Exchange carries a high level of risk and may not be suitable for all investors. There is a possibility that you could sustain a loss of all of your investment and therefore you should not invest money that you cannot afford to lose. You should be aware of all the risks associated with Foreign Exchange trading.

Dollar Gaining Ground as Jobs Report Highlights This Week’s Trading

Source: ForexYard

The US labor market will be the focus of this week’s trading leading up to the non-farm payrolls report on Friday. Prior to the all-important jobs report, US Core Personal Consumption Expenditures (PCE) will be released. The report is a favorite indicator of the Fed to measure inflation. Housing data and the ISM manufacturing survey will also show the depth of the US economic recovery.

Economic News

USD – Fed Comments Support Dollar Bids

Late Friday, St. Louis Federal Reserve Bank President James Bullard said the Fed should review its program of quantitative easing in light of recent positive economic data as the US economy, “Is looking pretty good.” Bullard, who has a vote on the Federal Reserve Open Market Committee said during the upcoming April meeting, the Fed may reexamine its decision to purchase $600B in US government bonds in order to lower US interest rates further and support the economic recovery.

However, the Fed, including Chairman Ben Bernanke has given no indication of its willingness to curtail its bond buying program which was enacted to stimulate the US economy. This week’s data will provide some insight to the extent of the US economic recovery, in particular, a sustained recovery in US employment data. As such, it is unlikely the Fed will scale back its bond buying program and will carry out the full $600B purchases which are set to end in June.

To start the week the dollar was stronger with the EUR/USD trading at 1.4040. The GBP/USD was trading near last week’s lows at 1.5980, and the USD/CAD was up at 0.9818.

Today will bring the release of US Core Personal Consumption Expenditures (PCE). The indicator is a favorite of the Fed to measure inflationary pressures in the US. Also pending home sales will be released later today. A pickup of inflationary pressures may be seen and would be dollar positive but housing data continues to lag.

The EUR/USD looks to be supported near the 20-day moving average line at 1.4020, followed by the rising trend line off of the January low which comes in today at 1.3980. A breach below this level could spur further selling of the pair the 1.3860 level where value buying may come into play. To the upside, Resistance is found at last week’s high at 1.4063 followed by the November high of 1.4280.

EUR – Euro Strength Continues Despite Negative New Flow

The euro has shrugged off the most recent set of negative news after German Chancellor Angela Merkel’s conservative party lost a state election that further weakens her position to negotiate a settlement in the European debt crisis. The political defeat in the Baden-Wuerttemberg state follows the defeat seen by Merkel’s conservative party in the Hamburg elections last month.

The string of bad news for the euro zone continues from last week with the failure to reach a bailout agreement for Portugal and the resignation of the Portuguese Prime Minister in protest of overbearing economic cutbacks that would come with the acceptance of any European bailout funds. In a further blow to the euro zone, S&P downgraded Portugal’s credit rating to BBB from A-, a rating that is very close to junk status. Fitch Ratings also cut the long term debt rating for Portugal on Thursday.

Despite the negative news flow, the euro has been fairly resilient, declining against the dollar by roughly 2 cents, while the euro has gained versus the Swiss franc with the EUR/CHF climbing above its recent high to 1.2980 in this morning’s trade.

Expectations for an ECB rate hike in April have been supportive of the 17-nation in the face of the negative news stream. While tensions run high in the fixed income markets, FX traders have not been quick to sell the euro due to the prolonged drama in Portugal. This trend may continue as the market appears to have priced in a future bailout for Portugal and traders are currently focused on yield differentials between the euro zone and the US.

JPY – Yen Continues to Decline Following G7 Intervention

In overnight trading the yen continued to fall back as the USD/JPY is currently trading near its post intervention high. This week traders will be expecting key data from Japan. In particular, the market will be focused on the Tankan report which is set to be released Thursday. The previous report for Q4 2010 showed Japanese manufactures had lost confidence since the financial crisis ended as the yen strengthened and the government stimulus measures ended.

Traders will need to take the Q1 2011 report with a grain of salt as the survey was taken prior to the earthquake and tsunami which has since caused nuclear reactor problems and a spike in radiation levels.

Currently the USD/JPY is trading near its post intervention high close to 82.00. On Friday, the Japanese Ministry of Finance said it would not hesitate to intervene in the markets should excessive volatility once again be evident in the financial markets.

Initial resistance for the USD/JPY is found at the post intervention high near 82.00. A move above this level and the pair would likely be sold once again near the 200-day moving average line just below 83.00. To the downside, support is found at 80.60 and the all-time low of 76.41.

OIL – Crude Oil Holds Above $105 on Middle East Unrest

Crude oil prices held near a 30-month high as the U.S. and its allies attacked Libyan leader Muammar Qaddafi’s troops and protesters clashed with government forces in Syria, bolstering concerns of potential disruptions of oil supplies.

A series of global events have rattled markets in the past several weeks, and analysts say oil prices are headed for wild swings as perceptions shift about how energy prices will affect the global economy.

As for today, traders should first and foremost follow the developments in the Middle East, as this issue will continue to impact oil prices in the near future. Traders are also advised to follow the U.S Pending Home Sales report, which is scheduled for today at 14:00 GMT, as this report tends to have a direct impact on the market and a correlation with oil prices.

Technical News

EUR/USD

The daily chart is showing mixed signals with its RSI fluctuating at the neutral territory. However, there is a fresh bullish cross forming on the 4-hour chart’s Slow Stochastic indicating a bullish correction might take place in the nearest future. Going long might be a wise choice.

GBP/USD

The pair has recorded much bearish behavior in the past several days. However, the technical data indicates that this trend may reverse anytime soon. For example, the 8-hour chart’s Stochastic Slow signals that a bullish reversal is imminent. An upward trend today is also supported by the 4-hour chart’s Slow Stochastic. Going long with tight stops may turn out to pay off today.

USD/JPY

The pair has recorded much bullish behavior in the past two days. However, the technical data indicates that this trend may reverse anytime soon. For example, the 8-hour chart’s Stochastic Slow signals that a bearish reversal is imminent. Going short with tight stops might be a wise choice.

USD/CHF

The price of this pair appears to be floating in the over-bought territory on the 8-hour chart’s RSI indicating a downward correction may be imminent. The downward direction on the 4-hour chart’s RSI also supports this notion. When the downwards breach occurs, going short with tight stops appears to be preferable strategy.

The Wild Card

This pair’s sustained upward movement has finally pushed its price into the over-bought territory on the 8-hour chart’s RSI. Not only that, but there actually appears to be a bearish cross on the Slow Stochastic pointing to an imminent downward correction. Forex traders have the opportunity to wait for the downward breach on the hourlies and go short in order to ride out the impending wave.

Forex Market Analysis provided by ForexYard.

© 2006 by FxYard Ltd

Disclaimer: Trading Foreign Exchange carries a high level of risk and may not be suitable for all investors. There is a possibility that you could sustain a loss of all of your investment and therefore you should not invest money that you cannot afford to lose. You should be aware of all the risks associated with Foreign Exchange trading.

GBP/USD The week ahead – 28 March – 01 April

Early last week the cable, similarly to the Euro, followed though with its previous weeks bullish momentum; however the latter part of the week saw the bears once again gain control of this market pushing the price back down to the both psychological and technical support level of 1.60.

Since the start of February when we saw the sterling break 1.6, the market has done very little other than chop around in a tight range with 1.6 holding as strong support despite numerous attempts to break back down. With each bounce lower we see a push back higher towards 1.63 and last week 1.64, however we’ve yet to see a confirmed break out of this range.

With almost 2 months of chop and little direction in this market it is just a matter of time before cable finally breaks either higher or lower and gives a clearer indication as to where we will see the pair go in coming months.

Late last Friday we saw the market falling back towards the 1.6 area which yet again held up as solid support. The next area of support is between 1.5960 – 1.5975 which are ‘spikes’ below 1.6. Further support sits at 1.59 and any pull backs towards these areas could be seen as opportunities to buy back into the market with the potential to ride a trade back towards the upper end of the range.

With the 1.6 holding as such a solid support and the close on Friday, the early part of this week may provide longing opportunities should we see further rejections at 1.6 with strong price action supporting any buy trades.


gbpusdoutlook28-1marchdaily


Should we see the market continue to fall and break the 1.58 area we could assume we’re in for further losses and sell on any pull backs higher initially targeting 1.56 with further targets at 1.5350 (December lows).

Its important to remember we will not be ‘jumping’ into any trades at the levels/areas we’ve mentioned and will be looking for price action set ups before entering this market.

http://www.vantage-fx.com

DXY the week ahead 28 March – 01 April 2011

The weakness seen in the Dollar for majority of 2011 continued early last week with further declines seeing the greenback slide as low as 75.25 an area last seen in December 09. However, the second half of the week saw strength kicking back in pushing the DXY almost 100points higher than its earlier lows.

The 76.25 area (lows from early March) now sits as upper resistance. Any struggle to break this area could bring further bearish momentum for the Dollar. Further up from here we have the 77.30 area which sits as our next level of resistance which we identified last week as a possible area the market could ‘pull back’ to before continuing it’s downwards spiral. We will be monitoring both these areas as possible roadblocks pushing the market back down.


dxyweeklyoutlook28march01aprildaily


Last week our analysis showed an H, L, LH, LL, LH, LL pattern on the weekly timeframe. This pattern can also be seen on the daily’s backing up and giving strength to our weekly TF analysis. We’re potentially at the area for the next lower high and should we see a push below 75.25 our pattern would continue with its bearish bias.


dxyweeklyoutlook28march01aprildailytrend


The weekly TF this week has kicked up a potential double bottom suggesting we could see a ‘bounce’ from here with the dollar picking up strength and moving back higher. Although last week we did break through resistance from November lows we only ‘spiked’ though with the body of the weekly candle closing significantly higher than our Nov 2010 lows.


dxyweeklyoutlook28march01aprilweekly


Its important to remember that we wont be ‘jumping’ into any trades at the levels/areas we’ve identified and will be waiting for price action set ups before making any trading decisions.

http://www.vantage-fx.com

FOREX: Large Currency Speculators add to US Dollar Shorts. British Pound, Euro Positions rise

By CountingPips.com

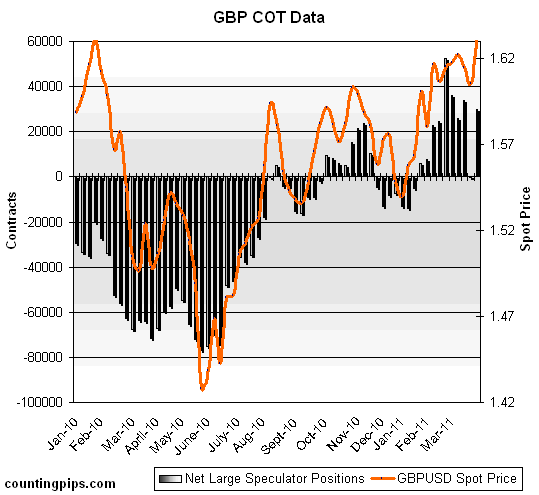
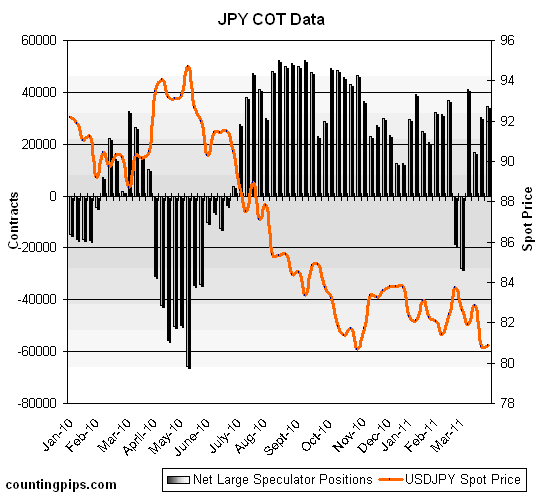
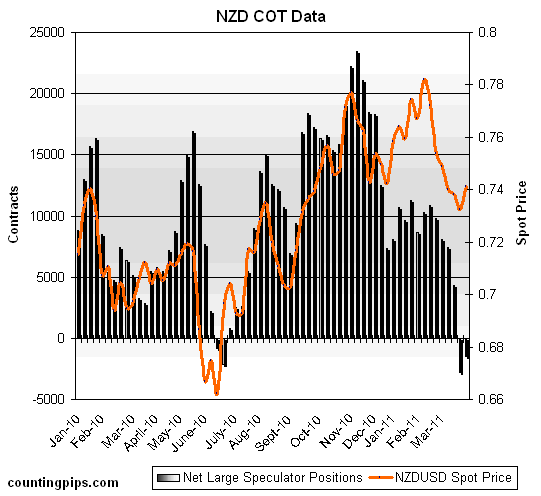
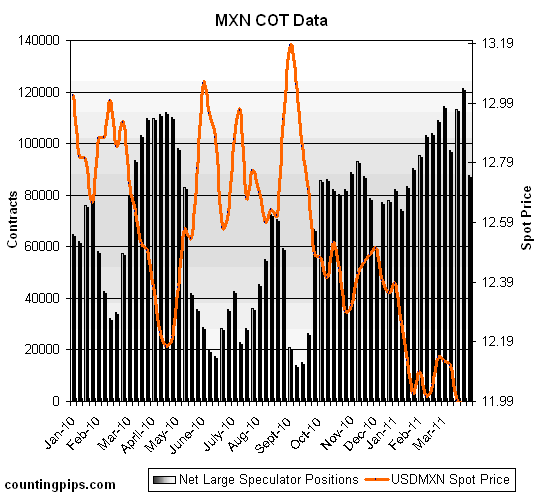
The most recent Commitments of Traders (COT) report, released on Friday by the Commodity Futures Trading Commission (CFTC), showed that futures speculators added to their short positions of the US dollar against the other major currencies. Non-commercial futures positions, those taken by hedge funds and large speculators, were overall net short the US dollar by $29.82 billion against other major currencies as of the March 22nd data release. This is an increase from the total short position of $27.07 billion on March 15th, according to the CFTC data and calculations by Reuters which calculates the dollar positions against the euro, British pound, Japanese yen, Australian dollar, Canadian dollar and the Swiss franc.

This week’s notable changes included British pound sterling positions returning to the long side after a week with net short positions and the Canadian dollar positions falling for a second straight week.

EuroFx: Currency speculators increased their net long positions for the euro against the U.S. dollar after a decrease the previous week. Futures positions in the euro rose to a total of 48,353 long positions as of March 22nd following a total of 46,316 long positions on March 15th.

euro cot data sentiment traders

The COT report is published every Friday by the Commodity Futures Trading Commission (CFTC) and shows futures positions as of the previous Tuesday. It can be a useful tool for traders to gauge investor sentiment and to look for potential changes in the direction of a currency or commodity. Each currency contract is a quote for that currency directly against the U.S. dollar, where as a net short amount of contracts means that more speculators are betting that currency to fall against the dollar and net long position expect that currency to rise versus the dollar. The graphs overlay the forex spot closing price of each Tuesday when COT trader positions are reported for each corresponding spot currency pair.

GBP: British pound sterling bets rebounded last week after dropping over to the short side on March 15th. GBP rose to a total of 29,724 long contracts as of March 22nd after registering 225 short contracts on March 15th.


JPY: The Japanese yen net contracts advanced for a second straight week as of March 22nd to a total of 34,525 long contracts following a total of 30,230 net long contracts reported on March 15th.


CHF: Swiss franc long positions dipped as of March 22nd after increasing for five consecutive weeks. Franc positions level at a total of 21,301 net long contracts as of March 22nd following a net of 27,640 long contracts on March 15th. The March 15th positions represented the highest level for franc positions since late 2009.


CAD: The Canadian dollar positions continued to fall lower for a second consecutive week to a total position of 45,977 contracts as of March 22nd. CAD net contracts had declined to a total of 56,991 net long contracts as of March 15th.


AUD: The Australian dollar long positions rose last week after decline on March 15th. AUD contracts totaled a net amount of 51,734 long contracts as of March 22nd after AUD positions had totaled 47,951 net long contracts on March 15th.


NZD: New Zealand dollar futures positions stayed on the short side for a second consecutive week. NZD contracts increased to a total of 1,482 short positions as of March 22nd from a total of short 2,809 long contracts on March 15th. NZD contracts had fallen for five consecutive weeks through March 15th.


MXN: Mexican peso long contracts fell sharply from a total of 121,575 net long contracts on March 15th to a total of 87,548 long contracts as of March 22nd. The MXN positions on March 15th represented the highest level in over a year.

COT Data Summary as of March 22, 2011
Large Speculators Net Positions vs. the US Dollar

EUR: +48,353
GBP: +29,724
JPY: +34,525
CHF: +21,301
CAD: +45,977
AUD: +51,734
NZD: -1,482
MXN: +87,548

Further COT Resources from around the web:

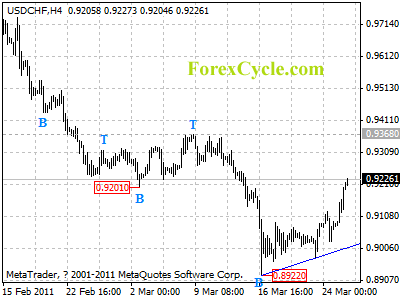
USDCHF’s bounce extended further to 0.9227

USDCHF’s bounce from 0.8922 extended further to as high as 0.9227. However, next cycle top is nearing, another fall would likely be seen later today. Key support is at the rising trend line on 4-hour chart, a clear break below the trend line support will indicate that a cycle top has been formed, and the downtrend from 0.9774 (Feb 11 high) has resumed, then deeper decline could be seen to 0.8700 zone.

usdchf

Daily Forex Forecast