Why the “Safe Haven” Currencies Are Anything But Safe in 2011

Years ago, back in my stock broker days, I used to spend a lot of time on the phone with our high-end clients.

You could say that I made my living talking to millionaires. I’d chat with these guys worth more money than most of us make in three or four lifetimes.

Know what I learned?

Strangely the super-rich only wanted “steady, safe” investments. They wanted money market accounts and muni-bonds of all things – just because they seemed “safe.”

Well, then the credit crisis hit. Suddenly even those “safe” money market accounts were losing money. And muni-bond prices fell off a cliff.

In short, all of a sudden these “safe” assets weren’t safe anymore.

This isn’t uncommon. There is always a point where safe, steady investments suddenly turn a corner and become more risky.

During the credit crisis, we saw plenty of these “safe” investments fall by the wayside. and it’s about to happen again – in the currency market.

It’s the reason why I’m shorting these two so-called “safe haven” currencies this year.

These Two “Safe Currencies” Are
About to Come Under Attack

You have probably heard the terms “defensive currencies” or “safe haven” currencies. It refers to the currencies that rise in value when markets fall apart. Not surprisingly, these currencies did very well during the global recession.

…the Japanese yen and Swiss franc.

These two currencies have soared against most currencies for the past three years in a row. So the masses will think that there’s no reason why the party should come to an end now.

Heck, these currencies are on a roll – they have to keep rising, right? Well that may be what everyone believes. The reality is a bit different.

A shift is coming in these currencies. It’s a “tipping point” that they are beginning even now. The problem now is that these “safe” assets have gotten too strong for their own good.

Why I Believe the Yen & Franc
Rallies are About to End

Honestly, if you know what you’re looking for, it’s almost easy to see why the Japanese yen and Swiss franc are about to fall. Here’s a closer look at why…

  • These strong currencies are killing their exporters. As an exporter, you want a cheap currency, because it makes your exported goods appear cheaper in the global market. Right now, Switzerland and Japan are facing the opposite problem – their currencies are so expensive that it’s hurting all these exporters. In fact, the biggest companies in Japan and Switzerland have been bleeding money because their currencies are simply too strong. That means these currencies will have to drop in value sooner rather than later.
  • These strong currencies are slowing down the Swiss and Japanese economies. There’s a saying that the cure for higher prices is…higher prices. The higher prices go, the more it will zap the demand. Eventually prices reach a point when most people can’t afford it. Then the price tanks down to a level to finally meet the demand in the market again. Well, just as higher prices slow down the sales of a product, they also slow down the sales of goods and services within a country. That in turn hurts the country’s GDP. As the higher price currency slows down the country, it eventually makes the currency drop due to the dire economic outlook that the strong currency brought about. That’s about to unfold in the months ahead.
  • These strong currencies are crushing stock prices, which crushes the sentiment in these countries. As stock prices fall, the whole country loses faith in the markets. Think about it. If your 401k and IRA are doing well, you’re happy and you spend more. However, if your 401k and IRA are sinking in value, you become more cautious. You start cutting back and spending less as you suddenly feel poorer. So crashing stock prices hurts investor sentiment. That can turn into a vicious cycle. And as the strong currency chips away at the earnings of these enormous exporters, it’s going to bring down their stock price and the overall sentiment in the country along with it.
  • My Flash Point Indicator is showing that these currencies are about to head south! My Flash Point Indicator is really more of a system. It’s a combination of several technical indicators I watch. Right now, my entire system is saying that the yen and franc are coming down off their lofty levels.

How to Play this Trend for 2011

In short there are plenty of reasons both fundamental and technical that tell me these two safe havens are about to sink in value.

Now there are several ways you can play this (including ETFs etc. in the stock market). But my favorite ways are in the spot Forex market.

Already this year, I’ve been playing some stronger currencies against the sinking Japanese yen for my Currency Cross Trader subscribers.

We have already grabbed three 100 pip winners this year simply by pairing stronger currencies against the sinking Japanese yen. Soon, we will be doing the same with the overbought Swiss franc.

So get ready for the yen and franc to continue the process of softening and then beginning an outright downtrend later on in the year.

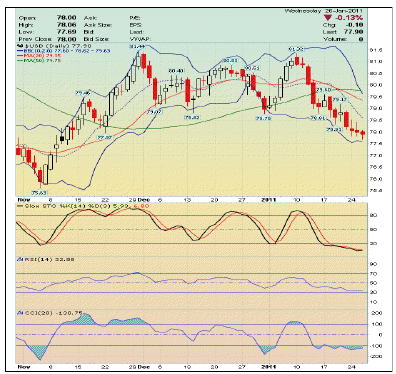
Bottom line: Nothing stays safe forever. Look to short the Japanese yen and Swiss franc this year.

Have a Nice Day,


Sean Hyman, Editor
Currency Cross Trader
blog: http://wcw.worldcurrencywatch.com
Swedish Krona Rallies

By Russell Glaser

Both the USD/SEK and the EUR/SEK have fallen to new lows as central bank comments show the Riksbank attempting to rein in inflation in light of rising commodity prices and strong GDP growth.

Hawkish comments from the Riksbank caused yesterday’s surge in the value of the krona with tougher talk on inflation coming from the central bankers during the last monetary policy meeting on February 14th.

The bankers suggested what might motivate them to increase the base interest rate more than the typical 25 bp. During the previous meeting the monetary policy committee increased Sweden’s repo rate by 0.25% to 1.5%.

At the previous meeting, the Riksbank stressed growth in Sweden remains strong as is unemployment, but both have slowed recently due to the rise in commodity prices. The central bank also noted noticeable improvement in the US economy has helped the Swedish economy. However, uncertainties remain in the euro zone.

The current inflationary target for the Riksbank stands at 2.0%. However, in January the rate of inflation rose 2.5% when measured on a yearly basis. In December the rate of inflation measured 2.3%.

The next meeting for the monetary policy committee will take place on April 19th with the results of the meeting to be released the following day. Here the Riksbank may once again increase interest rates to stymie persistent inflation, further boosting demand for the krona.

On the heels of the release of the meeting minutes, the Swedish krona surged to new highs versus both the dollar and the euro, shrugging off negative retail sales data that came in below forecasts, -0.1% on expectations of a 0.7% increase.

The USD/SEK made two significant technical moves yesterday, falling below the support line at 6.3540 and holding at the 6.2890 level. The move is a breach below the falling wedge pattern that has held since October 2010. A close below the lower line of the wedge may incite further selling of the pair. Resistance is found at this week’s high at 6.4450 and the February high of 6.5400.

USDSEK

Forex Market Analysis provided by ForexYard.

© 2006 by FxYard Ltd

Disclaimer: Trading Foreign Exchange carries a high level of risk and may not be suitable for all investors. There is a possibility that you could sustain a loss of all of your investment and therefore you should not invest money that you cannot afford to lose. You should be aware of all the risks associated with Foreign Exchange trading.

Forex Daily Market Commentary: Dollar advanced against both the yen and the Swiss franc

By GCI Forex Research

Fundamental Outlook at 0800 GMT (EDT + 0400)

USD

The dollar advanced against both the yen and the Swiss franc during the Asia session, despite the lack of news flow. AUDUSD came under modest selling pressure after the RBA policy statement suggested no urgency in tightening further. EURUSD traded 1.3781-1.3830, USDJPY 81.74-82.24. Asian equities were broadly stronger after the S&P 500 finished +0.565% ahead. The Chicago PMI surprised to the upside as did the Dallas Fed manufacturing activity index while pending home sales dropped slightly more than consensus estimates. St. Louis Fed President Bullard said the Fed will get the balance sheet back to normal over a roughly five-year period, which is a more aggressive timeframe than had been mentioned by other Fed speakers. Bullard said most other FOMC policymakers are opposed to adjusting the current program of bond purchases. New York Fed President Dudley said it would be unwise for the Fed to overreact to recent commodity press pressures and there are signs that core inflation is now stabilizing. Next to speak is Fed Chairman Bernanke, who begins his semi-annual testimony to Congress on monetary policy.

EUR

We raised our 1m and 3m EURUSD forecasts to 1.37 (prev. 1.30) and 1.30 (prev. 1.25), respectively, amid elevated oil prices and Middle East turmoil and relatively hawkish perceptions of the ECB. But these factors notwithstanding, our medium-term case for dollar strength remains intact. Our analysts expect the Fed will finish quantitative easing by June, while other G7 central banks are unlikely to hike interest rates as fast markets as expect, and fiscal austerity is likely to curb growth in the Eurozone and UK.
Final January CPI numbers in the Eurozone were revised down slightly to -0.7% m/m and 2.3% y/y from the preliminary -0.6% m/m and 2.4% y/y estimates. Core inflation was also revised down to 1.1% y/y, which suggests that most of the acceleration in price pressures is non-core based. ECB policymakers have said that their main concern is second-round price effects, so these numbers could give a slight boost to the doves ahead of Thursday’s policy decision.

GBP

In addition to our higher short-term forecasts for EURUSD, we also raise our 1m and 3m cable forecasts to 1.61 (prev. 1.53) and 1.53 (prev. 1.47), respectively. Like the ECB, the BoE has turned more hawkish on inflation. But we continue to see cable as a sell on rallies, as the BoE is unlikely to tighten as rapidly and by as much as the market expects.

AUD

The RBA kept policy unchanged, in line with consensus. The accompanying statement offered little in the way of policy guidance, noting only that the board “judged that the current mildly restrictive stance of monetary policy remained appropriate in view of the general macroeconomic outlook”.

CAD

A stronger than expected Q4 GDP print and an upward revision to the previous quarterly reading has kept the Canadian dollar well supported over the past 24 hours. We upgraded our Canadian dollar forecasts on the back of the better relative recovery along with elevated oil prices.
Our analysts are in line with the consensus and expect no policy shift from the Bank of Canada at today’s policy announcement.

TECHNICAL OUTLOOK
GBPUSD pressures 1.6299.
EURUSD BULLISH The pair eyes 1.3862 resistance; break of the level would expose 1.3948/74 zone. Near term support is at 1.3705.
USDJPY BEARISH Bearish pressure found support at 81.62 ahead of 81.13. Initial resistance is at 82.52.
GBPUSD BULLISH Upside rally held at upper boundary of the 1.6279/99 resistance zone, a break would open 1.6379. Support is defined at 1.6072.
USDCHF BEARISH Support zone is at 0.9228/00, breach of this would expose 0.8951 next. Near-term resistance at 0.9392.
AUDUSD BULLISH Break of 1.0200 has opened up the way towards 1.0256. Support lies at 1.0088.
USDCAD BEARISH Decline through 0.9745/12 support area has exposes 0.9700. Resistance at 0.9800.
EURCHF BEARISH Support lies at 1.2706, break of this would expose 1.2686 and 1.2592. Near-term resistance is at 1.2958 holds.
EURGBP BULLISH Initial resistance is at 0.8555, move above this level would expose 0.8593. Near-term support lies at 0.8470.
EURJPY BULLISH Rise above 113.46 exposes 114.19, while support lies at 111.96.

Forex Daily Market Commentary provided by GCI Financial Ltd.

GCI Financial Ltd (”GCI”) is a regulated securities and commodities trading firm, specializing in online Foreign Exchange (”Forex”) brokerage. GCI executes billions of dollars per month in foreign exchange transactions alone. In addition to Forex, GCI is a primary market maker in Contracts for Difference (”CFDs”) on shares, indices and futures, and offers one of the fastest growing online CFD trading services. GCI has over 10,000 clients worldwide, including individual traders, institutions, and money managers. GCI provides an advanced, secure, and comprehensive online trading system. Client funds are insured and held in a separate customer account. In addition, GCI Financial Ltd maintains Net Capital in excess of minimum regulatory requirements.

DISCLAIMER: GCI’s Daily Market Commentary is provided for informational purposes only. The information contained in these reports is gathered from reputable news sources and is not intended to be U.S.ed as investment advice. GCI assumes no responsibility or liability from gains or losses incurred by the information herein contained.

Silver Hits $34.40 Level

By Anton Eljwizat

Silver prices rose significantly in the past month and peaked at $34.40 an ounce. However, the daily chart is suggesting that a recent upwards trend is loosing steam and a bearish correction is impending. Forex traders involved with commodities like this can take advantage of this knowledge by going short on silver now, and at a great entry price!

• Below is the 4-hour chart for silver by ForexYard.

• The technical indicators used are the Slow Stochastic, RSI and Williams Percent Range.

• Point 1: The Slow Stochastic indicates a bearish cross, signaling that the next move may be in a downward direction.

• Point 2: The Williams Percent Ranges is showing that this pair is heavily over-bought and may be experiencing strong downward pressure.

• Point 3: The RSI signals that the price of this pair currently floats in the over-bought territory, suggesting downward pressure.

Siver 1-3-2011

Forex Market Analysis provided by ForexYard.

© 2006 by FxYard Ltd

Disclaimer: Trading Foreign Exchange carries a high level of risk and may not be suitable for all investors. There is a possibility that you could sustain a loss of all of your investment and therefore you should not invest money that you cannot afford to lose. You should be aware of all the risks associated with Foreign Exchange trading.

US Dollar Remains Weak despite Dip in Commodity Prices

Source: ForexYard

This week may provide the decision point for the USD. With Non-Farm Payrolls due this Friday, the uncertainty surrounding the American recovery will undoubtedly be made clearer. Today’s report on US personal spending at 12:30 GMT may provide a glimpse into other growth prospects before this week’s more important data releases get published.

Economic News

USD – USD Lower as Libyan Tensions Escalate

The declining value of the US dollar over the past few weeks has many traders anticipating a potential direction change, particularly as the greenback approaches significant support lines. The EUR/USD rose as high as 1.3840 on Monday, before returning to trade near 1.3815 in today’s early morning hours. The GBP/USD also hit as high as 1.6286, up from its recent dip to 1.6030.

The sudden rise in risk appetite was one explanation being offered for this most recent USD boost. The tensions spreading across the Middle East, however, have some speculating a return of risk aversion as tensions in Libya become more pronounced. This has led many investors to begin shifting away from riskier assets and seeking safety in commodities, which has also driven the USD lower.

This week may provide the much-needed decision point for the USD. With Non-Farm Payrolls due this Friday, the uncertainty surrounding the American recovery will undoubtedly be made clearer. Today’s report of the ISM Manufacturing PMI at 15:00 GMT may provide a glimpse into other growth prospects before this week’s more important data releases get published.

EUR – EUR Bullish, but Speculation on NFP Could Undermine Gains

The EUR remained in bullish trading patterns against most of its rivals at the start of this week. The surge into riskier assets has pushed commodity prices higher, driving the USD lower and European currencies to key resistance levels. The EUR/USD currently trades around the 1.3830 level, up slightly since Friday; the EUR/GBP, on the other hand, fell to 0.8485 from Friday’s high of 0.8592.

Fiscal concerns continue to plague Europe and, despite forecasts for a sluggish economic recovery in the US, the euro zone remains categorized as a relatively safer investment for many at this time. As such, the EUR continues to trade higher, but recent signals have indicated that risk aversion may be on the rise. This week’s NFP report seems to be carrying a stronger-than-usual impact in currency speculation.

The euro zone will be undergoing a relatively intense session on today’s economic calendar, with Britain and Europe publishing a long list of indicators throughout the day. It appears likely that at least a few of the major pairs will see sharp movements today and tomorrow, given that this week will experience very significant data releases practically every day, climaxing with Friday’s NFP.

JPY – Yen Bearish from Increased Risk Appetite in Europe

The Japanese yen saw a bearish trading session yesterday, losing ground against all of its currency crosses, except the US dollar. The JPY fell against the GBP and closed around 133.50. The yen also lost 130 points versus the EUR, ending Monday at 113.25, up from Friday’s 111.95.

The JPY’s trends will be affected by the rallies of its primary currency pairs today. It seems that the GBP and EUR are expected to continue trading volatile today with the release of a vast array of indicators.

Traders should keep a close look on the news coming from Britain and Europe as these economies will be the deciding factors in the JPY’s movement today. It is also advisable for traders to follow any unexpected comments coming from key Japanese governmental figures, as this is also likely to lead to further JPY volatility.

Crude Oil – Crude Oil Plummets over $5 a Barrel

During yesterday’s early afternoon hours, Crude Oil received a hasty sell-off when investors unwound their positions for riskier assets. With a recent boost to equity markets, the USD has also found itself losing strength to a number of its currency rivals, particularly the EUR. If this stock rally can continue, we may see these trends persist throughout the rest of the week.

The price of Crude Oil also dropped sharply as the demand for the commodity appears to have abated. U.S. Crude Oil inventories posted a mild decrease in the amount of Crude stocks in storage. The report failed to meet market expectations, helping to drive the price of Crude lower, reaching $96.86 from last week’s high of $103.34.

Technical News

EUR/USD

The recent upswing seen in this currency pair has the price floating near the upper border of the Bollinger Bands on the 4-hour and daily charts, signaling moderate downward pressure. The recent bearish cross on the 4-hour chart’s Stochastic (slow) adds weight to the notion of an imminent downward correction. Going short with tight stops might be a wise choice today.

GBP/USD

This currency pair is currently giving off mixed signals. With the RSI on the hourly chart showing the price floating in the over-bought territory, there may be a downward correction in the nearest future. However, with the price floating in the over-sold territory on the daily chart’s RSI, the longer-term movement will likely be in an upward direction. Capturing the imminent downward correction and then riding out the uptrend may be a wise strategy today.

USD/JPY

The price of this pair appears to be floating in the over-sold territory on the RSI of the daily chart, indicating modest support to the latest price dip in this pair. There also appears to be a bullish cross forming on the daily chart’s Stochastic (slow) which supports this notion. Going long might be a good choice today.

USD/CHF

This pair appears to have found solid support at the 0.9290 level. The daily RSI has the price in over-sold territory and the daily Stochastic (slow) shows a fresh bullish cross and an ascending price movement. These indications appear to suggest an imminent upturn in this pair. Going long may be a smart tactic today.

The Wild Card

USD/SEK

After the latest plummet in price, this pair appears to have a number of indicators approaching corrective territory. Forex traders will want to keep an eye on the daily and weekly Stochastic (slow) indicators, as well as the RSIs on both charts for any signs of the impending swing. The key support line to watch for is 6.3025, after which we may likely see corrective price action with targets near 6.4000 and 6.5000, sequentially.

Forex Market Analysis provided by ForexYard.

© 2006 by FxYard Ltd

Disclaimer: Trading Foreign Exchange carries a high level of risk and may not be suitable for all investors. There is a possibility that you could sustain a loss of all of your investment and therefore you should not invest money that you cannot afford to lose. You should be aware of all the risks associated with Foreign Exchange trading.

The Dollar Index declines to Lowest in Four Months on Monday

The US dollar remained under severe selling pressure on Monday’s trading session as the dollar index DXY recorded its lowest in four months. The main reason behind the falling of dollar was the optimism for single currency that traders maintain ahead of meeting of European Central Bank this week.

Investors are looking for countries and their currencies which are soon to increase their key interest rates to tackle inflationary pressures. Euro zone happens to be the top in that list and is expected to go for higher interest rates to handle the region’s sovereign debt problem.

The Euro surged to 1.3804 versus the US dollar as compared to 1.3750 on Friday’s North American trading session. The single currency has advanced 0.6 percent in the month of February versus the greenback. The Euro also performed versus the Japanese Yen and gained 0.5 percent to 112.86 versus the Yen.

The dollar index DXY which measures the greenback’s movement versus its six major counterpart currencies dropped to 76.756 on Monday which happens to be the lowest since November 2010. As compared to February the index has declined by 1.1 percent whereas it has reported the decline of 2.7 percent since the start of 2011. The index stood at 77.24 on Friday’s trading session.

The British Pound also moved up to 1.6265 on Monday against the US dollar as compared to 1.6094 on late Friday’s trading session. The pair GBP/USD gained 1.4 percent in the month of February.

The US dollar however gained versus the Japanese Yen to 81.78 on Monday as compared to 81.66 as on Friday.

About the Author

Daily forex trading news written by Rehan from DailyForexTrade.com

Trading on the “Fibs” Can be Enhanced When Momentum is Confirmed

If the truth be known, all retail forex traders are speculators, and speculating is all about effectively picking your entry and exit points in a volatile and fast-paced market.  Larger, more capitalized competitors are geared to squeeze every last “pip” out of a pricing move, creating an environment where what appears to be an excellent arbitrage opportunity at one point can vanish in an instant.  Using the best tools available, coupled with a decisive and disciplined decision making demeanor, becomes paramount for any individual attempting to survive and thrive in this complex profession.

One of the earliest concepts taught to aspiring traders is that prices can create various support and resistance levels as they seek the balanced view of market forces.  At some point a breakout or reversal will occur from this pattern when one of the opposing forces in the scenario gains the upper hand and dictates the direction of future movements.  It is the trader’s primary objective to anticipate the timing and direction of these changes, and the tools designated best for this process form a class called oscillators.

Oscillators were designed with one purpose in mind, to signal the presence of overbought and oversold conditions in a market.  The chart below depicts AUD USD with three of the most popular oscillators in use today in the forex and other trading markets:

The concept of Stochastics (“STO”), the first of the three indicators above and the “Slow” version, was developed by George Lane who observed that, as markets get overbought, the closing prices tend towards the daily highs, and vice-versa for oversold conditions.  The indicator consists of two lines, “%K” and “%D”, that “oscillate” between an upper and lower limit, as do the other indicators shown here, to produce their various trading signals.  These signals may occur before a price actually demonstrates a peak or valley, necessitating some interpretation by the trader.  Line intersections may aid in this process, as does the use of another indicator.  There are “slow” and “fast” versions of this oscillator, but traders favor the “slow” version as being more accurate.

The Relative Strength Index (“RSI”) is also a popular oscillator that is generally presented on most common forex commentary charts and in trading tutorials presented by forex brokers.  It was developed by Welles Wilder, and is based on measuring the relative differences between lower and higher closing prices.  Its developer believed that the strength of the RSI rested in its ability to diverge in direction from the price of the underlying currency or security.

The Commodity Channel Index (“CCI”) owes its origination and design to Donald Lambert.  The mathematical foundation of this oscillator deals with the mean price of the currency and the difference of that figure from the average of mean prices over a pre-set period of time.  Once again, overbought and oversold conditions are generated when the indicator crosses over upper and lower boundary limits.

By visually comparing each oscillator in the chart, each one produces its own “flavor” of signal for the trader to interpret at varying degrees of strength and velocity.  Typically, a trader would have recognized the “triple-top” formation and related support and resistance levels in the latter half of the above pricing behavior.  Anticipating the actual downward reversal that ensued would have come from his experience with the oscillator of his choice and his ability to interpret the messages presented.

Traders need every edge that they can find to win in the risky forex market.  Gauging pricing momentum with an appropriate oscillator is one way to achieve this objective.

Article courtesy of forextraders.com

Silver Hits $34.40 Level

printprofile

Silver prices rose significantly in the past month and peaked at $34.40 an ounce. However, the daily chart is suggesting that a recent upwards trend is loosing steam and a bearish correction is impending. Forex traders involved with commodities like this can take advantage of this knowledge by going short on silver now, and at a great entry price!

• Below is the 4-hour chart for silver by ForexYard.

• The technical indicators used are the Slow Stochastic, RSI and Williams Percent Range.

• Point 1: The Slow Stochastic indicates a bearish cross, signaling that the next move may be in a downward direction.

• Point 2: The Williams Percent Ranges is showing that this pair is heavily over-bought and may be experiencing strong downward pressure.

• Point 3: The RSI signals that the price of this pair currently floats in the over-bought territory, suggesting downward pressure.

Siver 1-3-2011