Interview with US Ambassador Laurie S. Fulton

The US ambassador to Denmark, Laurie S. Fulton, has been busy. Following President Obama’s recent State of the Union Address, unrest in the middle east and Africa and ongoing questions about the health of the world’s largest economy there have been plenty of questions to answer.

In this interview she discusses some of what she sees as the most important issues affecting US Danish relations and explains some of President Obama’s key messages for the future.

Laurie S. Fulton became the U.S. Ambassador to Denmark in the summer of 2009.  She has long standing ties to Denmark and her great grandfather served in the Danish Parliament from 1918 until 1940.

Legal information

Video courtesy of  en.jyskebank.tv

Breaking News Bulletin: News Is NOT the Main Driver of Stock Market Trends

A FREE myth-busting report from Club EWI reveals the real force behind long-term trend in financial markets

By Elliott Wave International

Conventional economic wisdom is founded on one core concept: namely, that events that exist outside the market (part of “market fundamentals”) trigger trend changes in the financial markets.

Because of this belief, you have the mainstream experts of finance watching everything from weather patterns to crop conditions, political exploits to the subtlest changes in punctuation in the Fed’s minutes — all in the hopes of anticipating the next big move in commodities, stocks, gold, the dollar, etc. In a nutshell, “positive” news and events cause a rise in prices, while “negative” news pushes prices down.

In reality, however, things are not as clear-cut. Markets regularly “ignore” the news, shrug it off — and move in the opposite direction of their “fundamental” cues. OR, worse waver in two different directions after the same event.

Take, for instance, the recent slew of news items following Federal Reserve chairman Ben Bernanke’s March 1 testimony before the Senate Banking Committee:

  • “US Stocks Advance Ahead of Bernanke’s Testimony” (International Business Times)
  • VERSUS — “US Stocks Turn Lower As Bernanke Testifies To Congress” (NASDAQ)
  • VERSUS — “US Stocks Rise With Bernanke In Focus” (MarketWatch)
  • VERSUS — “Stocks Decline As Bernanke Comments Fall Flat.” (Wall Street Journal)

What often ends up happening is this: Because the original event fails to predict the movement in stocks, commentators then sift through the day’s news feed in search of a different “trigger” — one that fits price action AFTER the fact.

The fallacy of a news-driven market is the first misconception exposed in Elliott Wave International’s Club EWI free resource The Independent Investor” eBook. Here’s a short preview of this eye-opening report.

Chapter 1 opens with the question “What Really Moves the Market?” You then get the answer via riveting excerpts and charts from EWI president Bob Prechter’s monthly Elliott Wave Theorist publications, such as this one below:

“Suppose the devil were to offer you historic news days in advance. He doesn’t even ask you for your soul in exchange. He explains, ‘What’s more, you can hold a position for as little as a single trading day after the event or as long as you like.’ It sounds foolproof, so you accept. His first offer: ‘The President will be assassinated tomorrow.’ You can’t believe it. You and only you know what’s going to happen. The devil transports you back to November 22, 1963. You short the market. Do you make money?

DJIA Daily 1962-1964

The first arrow in Figure 6 shows the timing of the assassination. The market initially fell, but by the close of the next trading day, it was above where it was at the moment of the event. You can’t cover your short sales until the following day’s opening because the devil said you could hold as briefly as one trading day after the event, but no less. You lose money.”

Independent Investor eBook further exposes 10 other commonly held economic beliefs for what they truly are: Wall Street myths disguised as reality. Here’s what else you’ll learn:

  • The Problem With “Efficient Market Hypothesis”
  • How To Invest During a Long-Term Bear Market
  • What’s The Best Investment During Recessions: Gold, Stocks or T-Notes?
  • Why “Buy and Hold” Doesn’t Work Now
  • How To Be One of the Few the Government Hasn’t Fooled
  • How Gold, Silver and T-Bonds Will Behave in a Bear Market
  • MUCH MORE

Keep reading this 118-page Independent Investor eBook now, free — all you need is a free Club EWI profile.

This article was syndicated by Elliott Wave International and was originally published under the headline Breaking News Bulletin: News Is NOT the Main Driver of Stock Market Trends. EWI is the world’s largest market forecasting firm. Its staff of full-time analysts led by Chartered Market Technician Robert Prechter provides 24-hour-a-day market analysis to institutional and private investors around the world.

Forex Update: US Dollar stronger vs Majors. Euro gains and EUR/USD rises above 1.3900

By CountingPips.com

The US dollar has been mostly gaining ground in forex market trading today against the other major currencies. The dollar has been on the rise so far today against the British pound sterling, Japanese yen, Swiss franc, Australian dollar and the New Zealand dollar while losing ground to the euro and trading close to unchanged against the Canadian dollar, according to currency data by Oanda in the afternoon of the US session.

The US stock markets, meanwhile, are having a winning session today with the Dow Jones Industrial Average gaining by over 150 points, the Nasdaq increasing close to 50 points and the S&P 500 up by approximately 20 points.  In commodities, oil has traded a bit lower to $100.55 while gold has lost $21.00 to trade around the $1,416.00 per ounce level.

Positive jobless claim news out of the US today has helped boost stocks as initial jobless claims fell to over a 2 1/2 year low and followed up yesterday’s better than expected ADP private employment report. The most important jobs report of the month is out tomorrow with the government’s nonfarm payrolls expected to show a rise of 185,000 jobs for February.

Euro jumps on ECB comments

The euro has been the big gainer on the day in the currency markets as European Central Bank president Jean-Claude Trichet commented that interest rates could rise in the euro zone by as early as next month. The comments came after the ECB decided to hold its interest rate steady today and prompted sharp buying of European common currency.

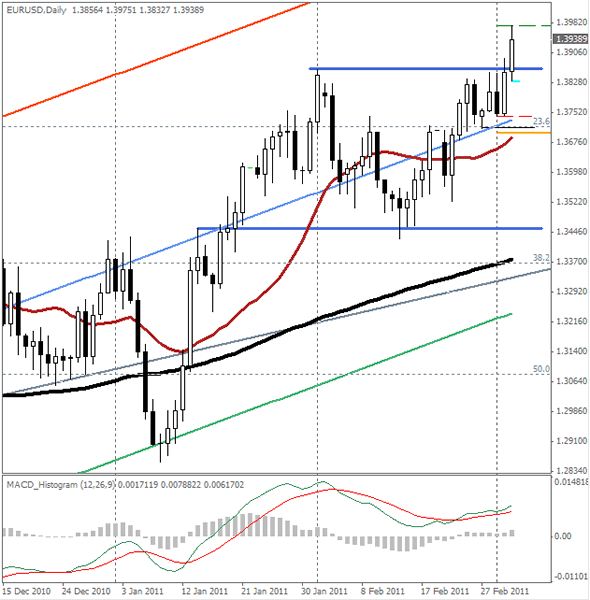
EUR/USD Daily Chart – The EUR/USD has continued its recent climb and today reached above the 1.3900 level for the first time since early November 2010.

-EURUSD - Euro Dollar Forex Currencies


FX Concepts’ Taylor Says U.S. Heading Toward Recession

March 3 (Bloomberg) — John Taylor, chairman and founder of FX Concepts LLC, discusses the possibility of the U.S. falling into a recession. Taylor, speaking with Betty Liu and Jon Erlichman on Bloomberg Television’s “In the Loop,” also discusses the outlook for European Central Bank and Federal Reserve monetary policies and the euro. (Source: Bloomberg)

Jobless Claims Down to Nearly 3-year Low of 368,000

The Labor Department reported Thursday that initial U.S. jobless claims fell by 20,000 to 368,000, the lowest level since May 2008, in the week of February 26th. Economists on average had expected first-time claims to reach 395,000, up from last week’s guided level of 388,000. Claims averaged 388,500 over the past four weeks, the lowest one month average since July 2008. The 27% decline in claims since August 2010 shows a pattern of modest hiring but fewer layoff. Continuing claims have also fallen, declining 59,000 to 3.77 million in the week of Feb. 19.

Forex, Stocks & Commodities: Long Term trends in the Dollar, Gold, Silver, Oil & SP500

By Chris Vermeulen, thegoldandoilguy.com

Trading with multiple time frames – Every now and then it’s always a good idea to look at some different time frames to be sure you have a solid understanding for the longer term trends in play. I will admit that it’s easy to get caught up in trading the shorter time frames like the 1, 10, and 60 minute charts especially when there are large intraday movements. But every night you must reset your thinking by looking at the bigger picture.

Below are weekly and daily charts which I think provide a big picture view of things.

SPY – SP500 Index Fund – Weekly Chart
You will see that in both 2009 and 2010 we saw a 5-8% correction down to the key moving averages. I feel that we are in store for a similar pullback in 2011. After that we will most likely continue higher.

US Dollar Index – Weekly Chart
The dollar is trading down at a key support level which I am keeping a close eye on. If we get a close below this trend line then we should see the dollar sell off sharply which in turn will trigger another leg higher in commodities across the board.

Crude Oil – Weekly Chart
Crude oil has really taken off because of the fears coming out of the Middle East. From the looks of it the next key pivot level is the $110 level.

Gold – Daily Chart
Both gold and silver have made new highs but after such a run I expect we see a quick pullback before they go higher. Gold and silver are the two investments I think everyone should hold a core position for the long run no matter what happens to the price. But, if we do get a nice quick pullback into the key moving averages then I think it’s a great spot get involved with more money.

Mid-Week Trend Report:
In short, I am bullish on stocks and commodities and bearish on the dollar and bonds. The one issue I see going forward is that if the dollar breaks down it will most likely help boost oil prices which in turn puts downward pressure on stocks… So depending on how things unfold in the Middle East and a falling dollar, we may not see higher stock prices. Some individuals are forecasting $150-220 per barrel and I know if it gets back up there it will definitely slow the economy and stock prices down…

That’s it for now, but if you would like to these reports sent to your inbox be sure to join my free newsletter: http://www.thegoldandoilguy.com/trade-money-emotions.php

Chris Vermeulen

EUR/CAD Consolidating, Limited Bullishness Expected

By Greg Holden

Since the start of 2011, the EUR/CAD has been fluctuating within an ever-tightening range. The consolidation point for this trend appears to be just below 1.3600.

Looking over the technical indicators it seems worthwhile to point out that current momentum is bullish and we have what appears to be a relatively clear target at 1.3600 prior to any sharp movements.

This price target is well within reach today. Given the flurry of events on today’s calendar, especially out of the euro zone, there is a strong possibility that the EUR will gain the needed boost to touch this consolidation point.

The Stochastic (slow) on the chart below shows a cross just above the over-sold region, making it a weaker indication of upward mobility, but a bullish signal nonetheless.

The MACD also reveals what could be a bearish cross, countering the limited upward strength shown on the Stochastic indicator.

Since the price is within 100 points of its consolidation target, these conflicting signals make sense. There is enough data to support the upward move towards this point, but not enough to justify breaching that target.

It seems more likely that traders will witness a downturn in the pair once the consolidation price target is reached today. This is also supported by rising Crude Oil prices, which often support the value of the Canadian dollar (CAD).

EUR/CAD – Daily Chart

Forex Market Analysis provided by ForexYard.

© 2006 by FxYard Ltd

Disclaimer: Trading Foreign Exchange carries a high level of risk and may not be suitable for all investors. There is a possibility that you could sustain a loss of all of your investment and therefore you should not invest money that you cannot afford to lose. You should be aware of all the risks associated with Foreign Exchange trading.

Crude Oil: Continues rising trend

By GCI Forex Research
Crude Oil

Crude Oil Movement

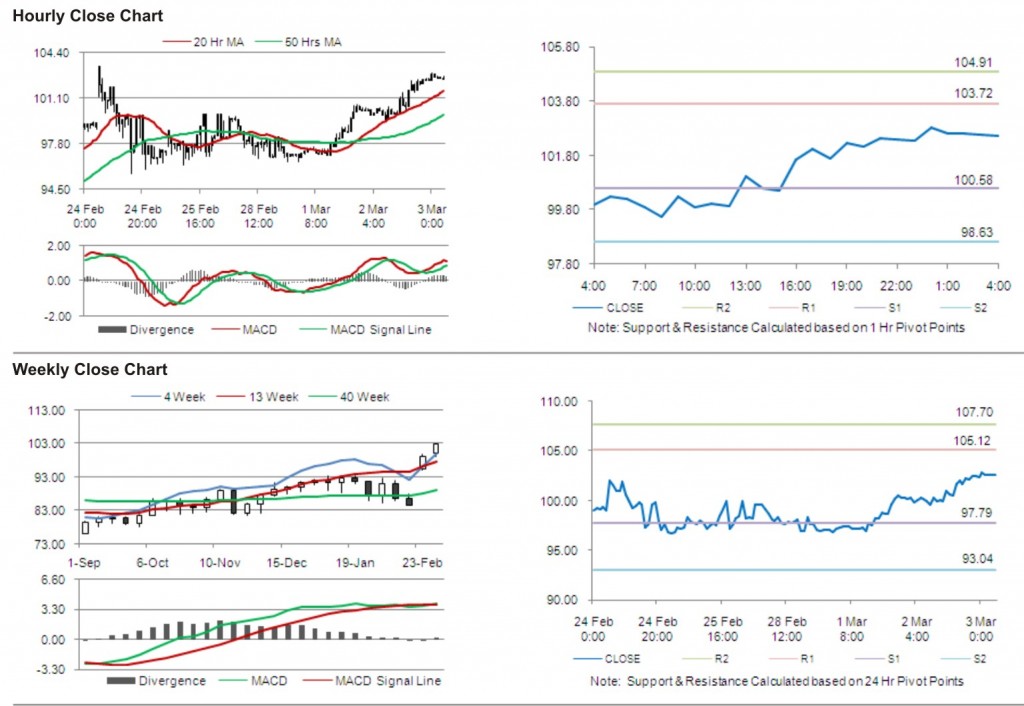
Oil prices advanced 2.05% against the USD for the 24 hour period ending 23:00GMT, closing at 102.34.

Crude futures closed above $102 a barrel Wednesday, after an unexpected decline in last week’s US oil inventories and continuing political turmoil in the Middle East raised concerns about global supplies.

The EIA report showed that the US commercial crude oil inventories decreased by 0.4 million barrels from the previous week, to reach 346.4 million barrels.

At GMT 0400, Oil is trading at USD 102.54 per barrel in the Asian session, 0.20% higher from 23:00GMT.

The pair has its first resistance at 103.72, followed by the next resistance at 104.91. On the other side, the first support is at 100.58, with the subsequent support at 98.63.

The pair is trading above its 20 Hr moving average and well above its 50 Hr moving average.

Forex Daily Market Commentary provided by GCI Financial Ltd.

GCI Financial Ltd (”GCI”) is a regulated securities and commodities trading firm, specializing in online Foreign Exchange (”Forex”) brokerage. GCI executes billions of dollars per month in foreign exchange transactions alone. In addition to Forex, GCI is a primary market maker in Contracts for Difference (”CFDs”) on shares, indices and futures, and offers one of the fastest growing online CFD trading services. GCI has over 10,000 clients worldwide, including individual traders, institutions, and money managers. GCI provides an advanced, secure, and comprehensive online trading system. Client funds are insured and held in a separate customer account. In addition, GCI Financial Ltd maintains Net Capital in excess of minimum regulatory requirements.

DISCLAIMER: GCI’s Daily Market Commentary is provided for informational purposes only. The information contained in these reports is gathered from reputable news sources and is not intended to be U.S.ed as investment advice. GCI assumes no responsibility or liability from gains or losses incurred by the information herein contained.

Forex Daily Market Commentary: ECB decision on tab

By GCI Forex Research

FUNDAMENTAL OUTLOOK at 0800 GMT (EDT +0400)

USD

FX markets remained tightly range-bound for most of the Asia session, as investors direct their attention to the upcoming ECB press conference. Headlines suggesting that a peace plan for Libya is being discussed led to a spurt of risk-seeking, but it was shallow and brief. EURUSD traded 1.3847-1.3876, USDJPY 81.65-81.93. The S&P 500 finished fractionally stronger. The Fed’s latest Beige Book was a bit more optimistic and the ADP employment data beat consensus, rising +217k in Feb. Fed Chairman Bernanke’s second day of prepared testimony was largely unchanged from the first. During the Q&A session, he said he would not rule out the possibility of a QE3 if conditions deteriorate, though he implied this was not his expectation. He added that monetary policy works with a lag and therefore “we cannot wait until we get to full employment and the target inflation rate before we start to tighten.” ADP estimates private payrolls rose +217k in Feb.

EUR

The ECB decision is due and our analysts are in line with the consensus in expecting no change to the policy rate. But during the ensuing press conference, we look for a more hawkish stance, an upward revision of inflation forecasts, and no change in the 3-month repo rules for forthcoming ECB tenders.
German Chancellor Merkel and Portuguese Prime Minister Socrates met and Socrates reiterated that Portugal does not need external help. Socrates said the March 11 summit aims to boost confidence for market participants and Merkel remained non-committal on possible reductions or alterations to current bailout packages for Ireland and Greece.
Eurozone PPI was stronger at 1.50% m/m compared to consensus of 1.10%. This will add to the ECB’s inflation concerns and provides further evidence of higher oil prices feeding through.

AUD

Trade data for January showed a -29.5% m/m decline in coal exports, due to flooding in Queensland, while exports in general fell -4.1% m/m. The AUD was not badly affected by the news, largely because of a compensating decline in imports, which caused the trade balance to come in ahead of expectations at A$1.875 bn (cons. A$1.55 bn).
Building approvals fell dramatically by -15.9% m/m (cons. -3.3%), and -24.8% (cons. -6.6%). The declines were even more pronounced in Queensland.
Our team of analysts stick to their view that the RBA will likely hike by a further +50bp in H2.

TECHNICAL OUTLOOK
USDJPY 81.13/80.93 support.
EURUSD BULLISH Recovery through 1.3862 has opened up the way towards 1.3948/74 zone. Near term support is at 1.3712.
USDJPY BEARISH Breach of 81.62 exposes 81.13/80.93 support area. Initial resistance is at 82.24.
GBPUSD BULLISH Clearance of 1.6330 has exposed 1.6379. Support is defined at 1.6216.
USDCHF BEARISH Pressure on 0.9200; breach of this would expose 0.8951 next. Near-term resistance at 0.9323.
AUDUSD BULLISH Rise above 1.0202 would open 1.0256 key resistance. Near-term support at 1.0085.
USDCAD BEARISH Initial support is at 0.9684, breach of this would expose 0.9600. Resistance at 0.9800.
EURCHF BEARISH Move above 1.2706 would expose 1.2686 and 1.2592 next. Near-term resistance is at 1.2893.
EURGBP BULLISH Support at 0.8423 continues to hold, expect gains towards 0.8555 ahead of 0.8593.
EURJPY BULLISH Momentum is positive; initial resistance at 114.19 ahead of 114.94 while support at 111.96.

Forex Daily Market Commentary provided by GCI Financial Ltd.

GCI Financial Ltd (”GCI”) is a regulated securities and commodities trading firm, specializing in online Foreign Exchange (”Forex”) brokerage. GCI executes billions of dollars per month in foreign exchange transactions alone. In addition to Forex, GCI is a primary market maker in Contracts for Difference (”CFDs”) on shares, indices and futures, and offers one of the fastest growing online CFD trading services. GCI has over 10,000 clients worldwide, including individual traders, institutions, and money managers. GCI provides an advanced, secure, and comprehensive online trading system. Client funds are insured and held in a separate customer account. In addition, GCI Financial Ltd maintains Net Capital in excess of minimum regulatory requirements.

DISCLAIMER: GCI’s Daily Market Commentary is provided for informational purposes only. The information contained in these reports is gathered from reputable news sources and is not intended to be U.S.ed as investment advice. GCI assumes no responsibility or liability from gains or losses incurred by the information herein contained.