Ratio Backspreads – Make a Profit Even When You’re Wrong

By Owen Trimball

Ratio backspreads are considered to be one of the safest longer term option trading strategies available today. So much so, that they have sometimes been called “vacation spreads” because you can literally take a holiday and come back later to find they’ve made a profit for you.

The word “ratio” in this strategy gives us a clue to how you would structure this trade. There is a relationship, or ratio, between a combination of bought and sold positions which open the trade. Usually, it would be something like 2 to 3 – i.e. buy 3 and sell 2 – hence, the ratio.

In order to understand what we are about to say, it is assumed you are familiar with the meaning of the expressions “in the money” or “at the money” as it applies to options.

The idea is that you BUY a larger amount (e.g. 3) of “at the money” or slightly “in the money” options and simultaneously SELL a slightly smaller amount (e.g. 2) of “deeper in the money” options. The beauty of these trade setups, is that even if your view of the stock price direction is wrong, you can still make a profit. This is due to the fact that the “delta” component of all positions increases, the deeper the underlying stock price goes “into the money” until it reaches a point where all positions have equal delta. The delta is the relationship between the movement in the price of the underlying stock and its associated option.

So if you have taken out a put ratio backspread and the stock price declines, the 3 “bought” option positions will eventually increase in value at the same rate as the stock price movement – and because you have more “bought” than “sold” positions, you’re making a profit. However, if the price action of the stock goes north instead of south, the “bought” positions will lose money, but so will your “sold” positions. Because, when you opened the trade, your 2 “sold” positions were “deeper in the money” than your 3 “bought” positions, you should’ve entered the trade with a net credit. You will get to keep this initial credit to your account and so, still make a profit, even if a smaller one than you hoped.

The other factor contributing to the above is the “implied volatility” (IV) of option prices. If we have taken out a put ratio backspread and the stock price takes a dive, this generally leads to an increased implied volatility for our 3 “bought” put option positions and consequently, will enhance the profitability of the trade, since we bought them “at the money” while the 2 “sold” positions were already “deep in the money”. The best time to enter this type of trade is when the “at the money” options have a low implied volatility, while the “in the money” (sold) options have a higher IV.

Knowing the above, you can sometimes combine both call and put ratio backspreads for one simultaneous position. You should get a credit for each of the setups. If the stock moves north, your call ratio backspread makes a profit while your put ratio backspread realizes a small credit… and vice versa if the price of the underlying stock moves south. In order to profitably enter such an an arrangement however, you need to take into account broker commissions, due to the large number of positions involved – and also ensure there are no volatility spikes for any of your option strike prices.

The ratio backspread is one of the more advanced option trading strategies, in that it allows a trader to have limited risk while realizing a nice profit if the underlying price moves in the anticipated direction. The bigger the move, the more profit you make, so you should look for stocks where you think the price will move significantly, such as the support or resistance of a channel pattern. As a general rule, the shorter time to expiry, the closer you would want your strike prices to be. Be sure to construct a risk graph before entering the trade so that you understand your risk vs reward.

About the Author

Owen has traded options for many years and writes for “Options Trading Mastery” – a popular site about Option Trading Strategies. Discover a wealth of information on many option trading strategies, including ratio backspreads
Scalping the E-Mini Contracts: Some Odds and Ends

By David Adams

Most e-mini scalpers are traders who hold contacts for a short period of time in hopes the price will move in the direction they are trading, either long or short. The average scalper is looking to carve out two or three points in a normal trend or countertrend movement. And e-mini scalper typically is in a trade less than 15 minutes, and usually trades with relatively tight stop-loss settings which are roughly equal to the profit targets he or she sets up as the trade parameters.

Scalping sounds pretty easy, and it looks pretty easy when viewing a historical trading chart. As in the scalper will tell you, scalping is anything but easy. Scalpers are usually, but not always, smaller capitalized traders with accounts as small as $2500 and up to $100,000 or more. There are any number of e-mini contracts on which scalpers typically trade, but the most common are the ES (e-mini S&P 500), YM (e-mini Dow), NQ (e-mini NASDAQ), and a host of other contracts ranging from crude oil to the Russell contracts. The only real requirement to effectively scalp is that the contract have a sufficient number of trading contracts so as to have sufficient liquidity to enter and exit without suffering slippage.

As a trading educator, I get to see a wide variety of scalpers and their trading styles, successful and unsuccessful. There is a certain pattern to most of the unsuccessful scalpers and most share some common mistakes;

1. it’s important to trade with the trend, especially when scalping. Since scalping usually requires fairly tight stop-loss limits, trading against the trend often finds the countertrend traders stopped out.
2. Many unsuccessful scalpers trade too many contracts for their account size. It’s generally a good idea not to risk more than 3 to 6% of your trading account balance on any given trade.
3. Many unsuccessful scalpers over trade. If a scalper is trading more than 10 trades on a given day, he or she is probably over trading. Generally speaking, there are not 10 high probability scalping setups on the average day. Of course, there are odd days when many scalping opportunities arise; but on the whole, I find that the average day yields 4 to 6 high probability scalping setups.
4. Unsuccessful scalpers often develop an emotional attachment to their trading positions. That is to say that they become convinced their trade is predestined to be successful. Unfortunately, the market is without a soul and moves according to the number of contracts being traded in either direction and cares little about an individual trader’s attachment to their trade.

Successful scalpers generally exhibit traits exactly opposite of the characteristics enumerated above. They seldom develop emotional attachments to a position and are quick to dump a trade that looks unsuccessful. Good scalpers don’t over trade and trade the correct number of contracts relative to their trading account size.

One of the most disturbing characteristics of unsuccessful scalpers is the desire to ascertain the exact peak or trough of a given move and attempt a countertrend trade from those points. One of the most difficult feats in trading is to identify a peak or trough, as many peaks or troughs often turn out to be little more than retracements and the trades taken in these misguided attempts to identify the peaks and troughs become disastrous.

Why not just trade with the trend? Trend trading is one of the easiest trade setups to identify and even a poor set up can be salvaged because of the markets tendency to move in the direction of the trend. I cannot count how many times I have taken trade with the trend that was a poor set up only to be saved by the market resuming the trend. Surprisingly, I watch trader after trader take countertrend trades with the same result, yet are excited when the next enticing countertrend trade setup presents itself. It’s absolutely baffling.

In summary, we have looked at some odds and ends that make successful scalpers profitable. Most successful scalpers trade with the trend. I think every trader should repeat this mantra 50 times before he or she goes to bed. We also took the time to identify for traits unsuccessful scalpers exhibit; they tend to trade against the trend, they tend to trade too many contracts, they tend to over trade, and they develop emotional attachments to their trading positions.

About the Author

Real Live Trading Doesn’t Lie. Spend several days in my trading room and see if you can benefit from a fresh and unique view on trading e-mini contracts. Sign up for your free trading experience by clicking here

Forex trading signals: Your trading advisor

By Warren Seah

Being an experienced trader to make tons of money a month in the Forex market is tempting but being a novice to tap the expertise of a pool of experienced traders for forex trading signals is smart and rewarding.

What you need is have a credible source of good trading information that signals the right moment to you to place money on the right currency at the right time. The development of your own profitable, sustainable and feasible trading system could take much of your time depending how fast you want to achieve success in trading.

This development process often leads to common mistakes that traders will make and such mistakes will prove to be costly that might deal a heavy psychological blow to novice traders.

This is when forex trading signals come in a form of forex trading signals software develop for a forex trading platform by experienced traders. The Forex market itself gives you unlimited access to achieve financial independence and freedom but only if you know how to tap the vast potential of the market properly.

As market consists a series of patterned movements, one should know how to diversify and not stick to a particular strategy or trading signal. The best forex trading signals should come in the form of various strategies to suit the current mood of the market allowing you to tackle the market with the right tools.

After exploring the various forex trading signals providers and sieving out the ones you can trust, it is time to put them into action. There are several ways of obtaining these signals like through SMS or emails but the best way to inform you timely on a potential trade is by having these forex trading signals provided through a service with an automatic pop-up software to highlight the entry (exit) of a trade.

These signals are provided real time and there is virtually no delay. This provides an excellent opportunity for novice traders to know when a perfect setup is in place and a learning outlet for experienced traders to understand why a potential trade setup is being formed.

Forex trading signals comes in two options that traders can take where one is paired with a automated execution of the signal in the form of market order and the other is just a signal provider itself where the decision to execute the trade lies with the trader.

There are pros and cons to these two options: Fully automated execution allows the trader to enter the trade without monitoring for potential signals catching the trade at the right moment but without the judgment of whether the trade signal provided is valid.

In the case for just having trading signals provided, the trader is able to make a choice as to whether the signal provided is a potential winner before execution but may fail to enter the market with the right timing due to some time spent on decision making.

Though forex trading signals provided by parties might not be 100% profitable or some may even be flops, one should learn how to discern those of good trading signals provider from the bad ones.

These signals can be useful in providing steep learning curves for novice traders who are wanting to learn what forex is all about without spending lots of time for development of their own trading system or risk of crashing on their first account. As for the experienced traders it will be another avenue to explore new strategies to add to their existing arsenal.

About the Author

Warren Seah

“Introducing 11 Exit Strategies, What Every Disciplined Traders Need… Go Without It You Could End Up Being A PIP VICTIM Just Like Thousands Of Traders Out There.”

Download Your Trailing Stop EA Now

The Problem with Forex Fundamental Analysis

By Warren Seah

There are basically two forms of analysis that traders divide themselves between: the fundamental and the technical. Though both forms of analysis are great in their own ways, they have their problem with them. In this article, i’ll be focusing on the problem with forex fundamental analysis.

Fundamental analysis mainly focuses on the overall state of the economy, interest rates, monetary policies which are basically the economic conditions of a country. It is always great to know how the markets move and the economics of the world as it greatly affects financial markets but solely depending on fundamental analysis to trading the market such as forex will be disastrous. By the time you receive economic news, there are other people beforehand who knew this piece of news acted on it and the result will have been reflected on the charts.

Economic news are generally skewed by the fact that they do not always factor in some main data as sometimes some countries wanted to show that they are doing well in good times and alright during bad times which is linked to political factors. They are not to be trusted 100% and can only serves as a guide complement with your technical analysis.

Normally when news is released, everyone will have the same idea of the markets thus creating a herd mentality. Since everyone is talking about buying, the tendency will be might as well join in for a ride to make a killing. But those who knew what was going on chose to stick to what they always believe in and that is what the chart is telling them.

A well informed trader will use long term fundamentals together with trends spotted with technical to establish a trade bias. Short term news such as non-farm payrolls (NFP) often may develop knee jerk reactions in the market, creating false signals that mislead traders that there is a change in the market sentiment. It is only after when the dust settles that one can see the trend which the market is heading.

Having only forex fundamental analysis do not provide a whole picture to your trading decision, it is always advisable to combine with technical analysis to aid in your decision making. If you are unsure about how news can affect your trades, always look to avoid trading during high profile news release and wait till a few days while still observing the movement of the markets before you decide it is comfortable to trade again.

About the Author

Warren Seah

“Introducing 11 Exit Strategies, What Every Disciplined Traders Need… Go Without It You Could End Up Being A PIP VICTIM Just Like Thousands Of Traders Out There.”

Download Your Mt4 Trailing Stop EA Now

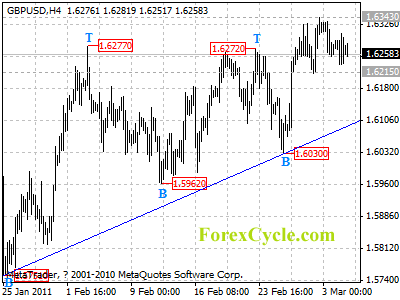
GBPUSD moved sideways in a range

GBPUSD moved sideways in a range between 1.6215 and 1.6343. The price action in the range is treated as consolidation of uptrend from 1.6030. Initial support is at 1.6215, as long as this level holds, uptrend could be expected to resume, and another rise towards 1.6400 is possible. However, a breakdown below 1.6215 will indicate that a cycle top had been formed at 1.6343 level on 4-hour chart, then pullback towards the uptrend line from 1.5751 to 1.6030 could be seen.

gbpusd

Daily Forex Analysis

Shuttle Discovery & Aboitiz Equity Ventures Lifted Off For Space

aboitiz equity ventures, AEV philippine stocks, ron acoba, MSCI Philippines Index, descending channel, bullish breakaway gap, bullish morubozu, daily stock picks, stock market trading

While Space Shuttle Discovery made its last voyage to to space just a couple of days ago, another launch occurred this morning in the Philippines. This morning’s massive launch, however, came in the form of Aboitiz Equity Ventures or AEV in the Philippine Stock Exchange. AEV’s price canvas above shows you what exactly I’m talking about. Since peaking at PHP 41.50 last December 2010, AEV had been on a steady decline as it had been trading within a descending channel before it made a bullish breakaway gap to finally break above the said channel last February 12. Back then, I mentioned that sch move could be seen as a sign of good things to come. However, AEV just moved in a sideways fashion after gapping up until earlier today when it literally skyrocketed by a monstrous 17.50% to close at PHP 47.00 from an opening of PHP 40.20. Not only that, today’s move was also accompanied by a huge buying that I haven’t seen for quite a long time. Imagine, the total value traded today for AEV reached PHP 3,888,484,220. Moreover, closing at its high and making a bullish morubozu candle formation in the process also suggests that there could still be some upside in this stock.

So what caused AEV to perform very well in this kind of market?

Last February 12 (kindly see my previous post here), I mentioned that Aboitiz Equity Ventures would be included in the MSCI Philippines Index on February 28, 2011 which is today. Again, MSCI Philippines is a benchmark that measures the performance of the top 99% by market capitalization of equities that are listed in the Philippine Stock Exchange. I added that inclusion of AEV in the index was and is bullish for the stock since international funds that track the it would then need to buy AEV. And this was what exactly happened earlier today.

So looking closer in today’s AEV trading, I found out that the top three buyers of AEV were Philippine Equity Partners (bought 43,592,700 shares at an average price of PHP 44.7952), ATR Securities Philippines (bought 23,785,400 shares at an average price of PHP 44.7610), and DBP-Daiwa Philippines (bought 9,651,300 shares at an average price of PHP 45.5227). Among the top three buyers, the average price (weighted) where AEV was bought was at PHP 44.8758. This simply means that the investors and/or traders who bought AEV today got in at about that price. Therefore, today’s closing of PHP 47.00 only gives them about 4.73% gain. And given the sheer amount of volume amounting to more PHP 3 billion, it’s highly unlikely that these buyers would dispose of their long positions soon. This then would make their average entry price of PHP44.8758 a considerable support.

More on LaidTrades.com

Bearish Pattern Seen In Leisure & Resorts World Corporation (LR)


Leisure & Resorts World Corporation
or LR in the Philippine Stock Exchange has octupled its value from PHP 1.10 to PHP 8.80 in a year’s span which is an incredible 800%!!! This is an amazing feat especially for those who were able to buy the stocks at the lower levels. The company is involved in the realty business and developing and licensing gaming hardware and software programs for casinos. Their current partnership with Belle Corporation (BEL)  to put up the Belle Grande Manila Bay, which could become the biggest hotel and casino complex in the country, was one reason for its stock price to shoot up.

In my technical point of view, there could be a 2-month head and shoulders pattern forming. For those who do not know, a head and shoulders is considered a bearish reversal chart pattern and often found at the end of uptrends but rarely, they become continuations. Anyway, the head and shoulders looking pattern could be confirmed when the price drops below the neckline. Furthermore, the diminishing volume at the start of the left shoulder validates the pattern’s potential breakdown. If it breaks, we could achieve a target price of PHP 5.00. That is around -20% from the current value and I got that by gauging the height of the head then added it to the possible breakdown point. But before it reaches the PHP 5.00 price mark, it needs to go below the PHP 6.00 psychological support.

Fortunately, the stock price is still above the 50 and 100 moving averages which indicates strength. The MACD is above the 0 marker and the RSI away from the overbought condition which is favorable for the bulls. If LR bounces back up, it needs to surpass the 1-month downtrend to reach the next resistance at PHP 7.55. The LR stocks are in the ”gray area” in terms of its direction but personally, I’m leaning towards a breakdown given the fact that the PSEi has been correcting (kindly check my colleague’s post). I may be wrong but just to be sure, it’s better to keep an eye on it.

More on LaidTrades.com

How Good Is Your Knowledge Already At Buying Your Choice Of Stock?

By Cedric Welsch

All this time, it has been inculcated in the minds of a lot of folks that you can easily pull in huge amounts of profits through the stock market really easy and fast. In addition to such claim, people find the stock market to be far advantageous for investors in terms of gaining more profits compared to other investment means. Having said that, it is very essential that one understands the process and transaction behind the buying of stocks whether with the help of a broker or just doing it alone. So, keep on reading and let me explain to you the process of buying and selling of stocks. If you choose to buy stocks by yourself, this will push you to really increase your knowledge at it.

So what factors must you look into when you are planning to buy stocks

The first thing you should put your attention to is in understanding the overall behavior of the stock market, including the financial standings of those companies which may seem interesting for you to invest into. Before you even entertain the thought of buying, you must first figure out which stock is worth buying and also when is the perfect time to buy. It is up to you as an investor whether you are more into the volatile type of stocks or maybe those that can be considered to be more stable.

Of course, the best tactic that any investor should apply would be to buy a stock during its lowest value and then sell it at its peak pricing value. There is huge profit to be made if you are able to implement such tactic successfully.

Another aspect that you must be careful to look into before buying a stock is whether the company that you are eyeing at has good financial returns and well structured financial plans for the coming days. Through such query, you will be able to determine the stability of that company and the profit potential you could be making out of your investment with them.

With the brief information you just read, it will not be surprising if you suddenly decide to head on at the stock market and begin buying stocks by yourself. Of course for a beginner, things can expectedly be a little rough to start with, and surely mistakes can easily be around the corner. But like many successful investors would do, when you are faced with failures, there is no better thing to do but to stand up and try again. Sooner or later, you will reap the rewards of your hard effort and true desire to succeed with the stock market.

About the Author

Want to read online stock trading for beginners? The best online stock trading beginners info will guide you in stock trading.

Trading Robots, Automated Trading, and Futures Trading

By David Adams

The New York Stock Exchange and the Chicago Mercantile Exchange are home to some of the most sophisticated trading systems and automated trading computers in the world. It would not be an exaggeration to say that billions of dollars have been invested in computerized trading in the last 20 years. Computer based trading is even highly specialized in the function performed. Some computers are utilized to call turns in the market, others are used to map out hypothetical movement in the market, and still others are used to systematically scale in and out of potential and present market positions. Oddly enough though, most of the real trading, and especially the important calls on when to buy and sell, are a human function.

One of the most difficult and obtuse concepts for most laymen and new traders is the degree of randomness present in all market conditions. Depending on which source you quote, anywhere from 60 to 80% of the typical price action is random in nature. By definition, it is impossible to predict random movement. For this reason alone, computerized trading has fallen short of the grand expectations the investment industry envisioned a decade ago. The real workhorses on the exchanges are not computers but real live human beings.

But it would certainly be a grand idea for the average American to flip on a computer and earn thousands of dollars every month without any idea how the market functions. Heck, investment professionals would love to have a computer that spit out consistent profits month after month. Unfortunately, computers haven’t lived up to their expectations and it is doubtful that they ever will.

Why?

The very best in computerized trading systems used by major investment firms require constant reprogramming to compensate for the many phases and moods the market exhibits throughout the course of a single year. To calculate the multitude of pricing anomalies that occur in a five-year period is staggering in scope. To be sure, computerized trading suffers from the same problems that all human traders suffer; the market is a beast with many moods and exhibits such a wide range of pricing behavior that it takes years for the human mind to recognize and adjust to these ever-changing conditions. Since the computer is only as good as its programming, Wall Street finds itself constantly adjusting risk components and pricing mechanisms to compensate for the wide variety of price behavior I have described above. Quite simply, the market’s random behavior combined with some of the very organized behavior it exhibits are difficult to predict with any accuracy via mathematical algorithm. This is a very difficult concept for many individuals to conceptualize, as our minds are conditioned to gather data and organize that data into some system that makes sense on a consistent basis. You need only look at the hundreds of trading systems in existence to realize that there is absolutely no consensus on how the market prices its underlying securities. For that matter, there is very little consensus on how the market actually functions, in terms of equity pricing.

But it has become very common to see advertisements in recent years hawking computer robots that will rake in thousands of dollars monthly. I don’t doubt that from time to time these computer robots have very successful months, but the wide range of market behavior has always precluded even the most sophisticated computers from consistently outperforming the market. This fact is evidenced in the relative rates of return over the last 30 years. They haven’t changed very much; with or without computers the major investment firms have been unable to appreciably increase their rates of return.

My point is a fairly simple one, you can earn money in the equity markets with proper training and knowledge and a major amount of experience, but the expectation of purchasing a $300 computer robot and raking in a consistent income has been empirically proven to be, at best, unlikely. To be sure, most testing as shown that computer robots tend to lose money, especially when the tests are over a 3 to 5 year business cycle. Again, the problem is as described above; there are simply too many pricing variables for any computer to analyze properly and invest profitably.

In summary, we have discussed the random nature of the equity markets and the inability of some of the most sophisticated computers in the world to accurately invest and profit. I have pointed out that the majority of major investment decisions are still made at the human level. And finally, I have warned that the retail computer robots currently being marketed may not perform as advertised, at least over the long term. If you’re interested in earning money in the equity markets, learn to trade and profit.

About the Author

Real Live Trading Doesn’t Lie. Spend several days in my trading room and see if you can benefit from a fresh and unique view on trading e-mini contracts. Sign up for your free trading experience by clicking here

FOREX: Large Currency Speculators raise bets against US Dollar. Euro positions rise for second week

By CountingPips.com

The latest Commitments of Traders (COT) report, released on Friday by the Commodity Futures Trading Commission (CFTC), showed that futures speculators increased their short positions of the US dollar against the other major currencies for the first time in three weeks. Non-commercial futures positions, those taken by hedge funds and large speculators, were overall net short the US dollar by $34.9 billion against other major currencies as of the March 1st data release. This is a rise from a total short position of $22.36 billion on February 22nd, according to the CFTC data and calculations by Reuters which calculates the dollar positions against the euro, British pound, Japanese yen, Australian dollar, Canadian dollar and the Swiss franc.

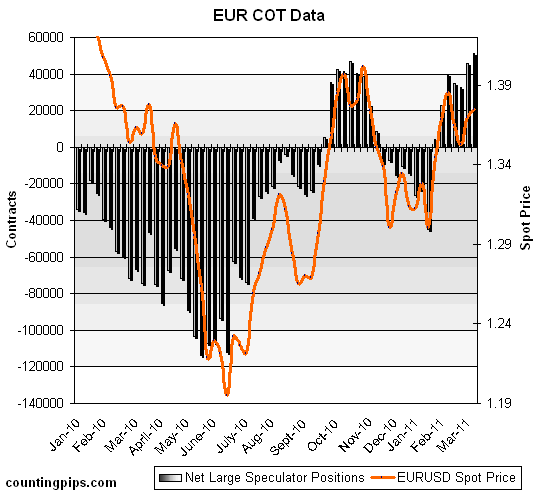
This week’s data saw some notable changes with euro positions increasing to their highest level since January of 2008 while Japanese yen positions increased sharply over to the long side after two weeks on the short side and falling to their lowest level since May 2010. Mexican peso long positions decreased as of March 1st after gaining for seven straight weeks.

EuroFx: Currency speculators added to their net long positions for the euro against the U.S. dollar for a second consecutive week. Futures positions in the euro rose to a total of 51,308 long positions as of March 1st following a total of 45,598 long positions on February 22nd. This is the highest net long euro position since January of 2008.


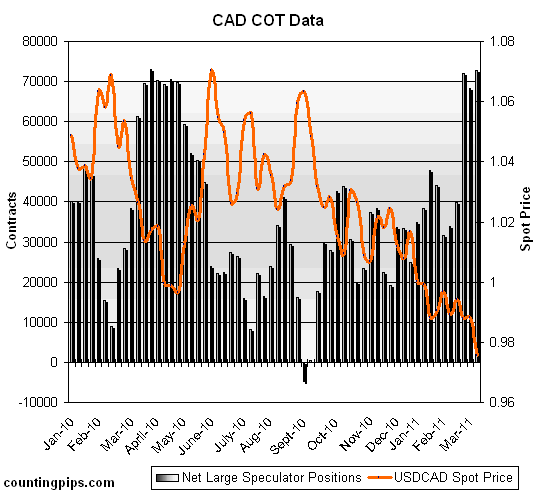
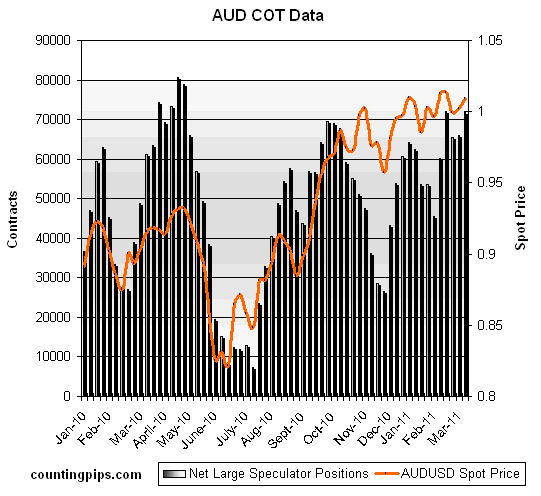
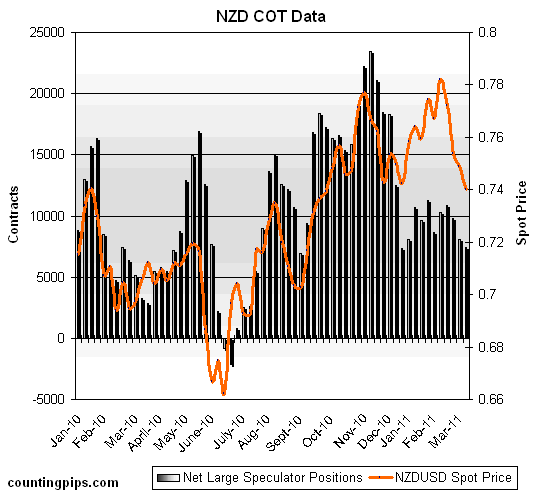
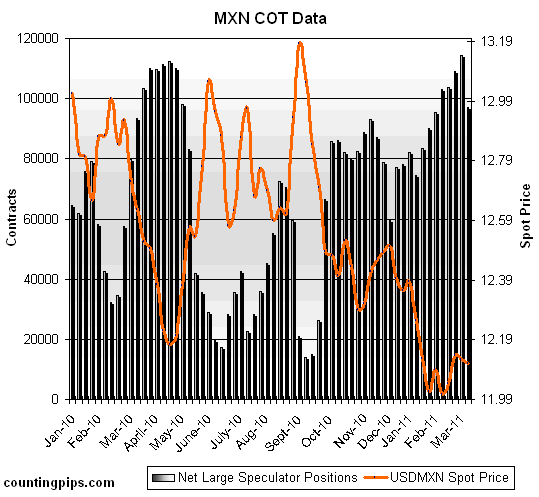
The COT report is published every Friday by the Commodity Futures Trading Commission (CFTC) and shows futures positions as of the previous Tuesday. It can be a useful tool for traders to gauge investor sentiment and to look for potential changes in the direction of a currency or commodity. Each currency contract is a quote for that currency directly against the U.S. dollar, where as a net short amount of contracts means that more speculators are betting that currency to fall against the dollar and net long position expect that currency to rise versus the dollar.

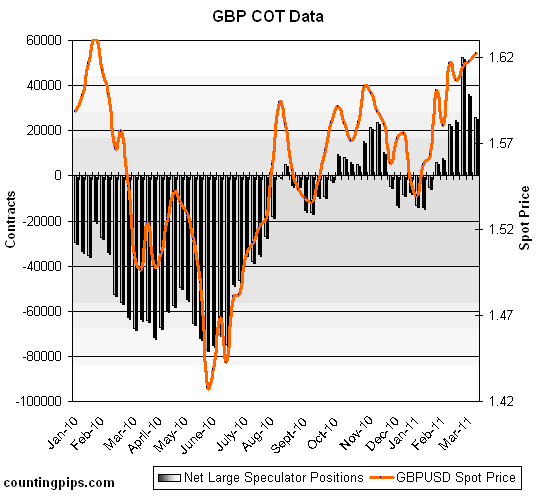
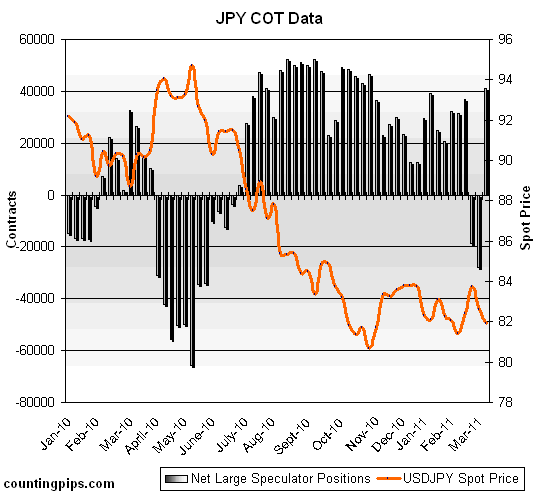
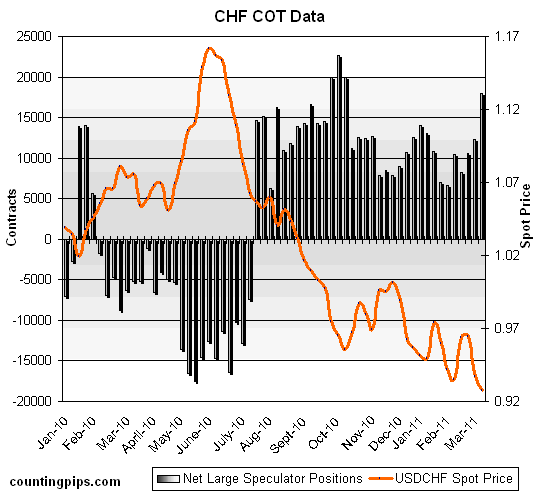
The graphs overlay the forex spot closing price of the Tuesday when COT trader positions are reported for each corresponding spot currency pair.

GBP: Speculators decreased their net long British pound sterling bets for a second straight week to a total of 25,809 long positions after totaling 36,009 long positions as of February 22nd.


JPY: The Japanese yen net contracts reversed course sharply following two straight weeks of declines. Yen net positions increased to a total of 41,274 long contracts following a total of 27,746 net short contracts reported on February 22nd.


CHF: Swiss franc long positions rose for a third consecutive week to a total of 18,017 long contracts, according to the COT data as of March 1st. Franc contracts are now at their highest level since October and had totaled a net of 12,291 long contracts on February 22nd.


CAD: The Canadian dollar positions increased to their highest level since March 2010. Canadian dollar long positions rose to a total of 72,827 net long contracts on March 1st after registering 68,348 net longs on February 22nd.


AUD: The Australian dollar long positions advanced for a second consecutive week as AUD contracts totaled a net amount of 71,853 long contracts as of March 1st. AUD positions had totaled 66,064 net long contracts on February 22nd.


NZD: New Zealand dollar futures positions headed lower for a third week to a total of 7,411 long positions as of March 1st. NZD large speculator long positions had decreased the previous week to a total of 8,101 long contracts on February 22nd.


MXN: Mexican peso long contracts decreased after gaining for seven consecutive weeks. Peso positions fell to 97,202 net long contracts as of March 1st after totaling 114,276 longs the week prior on February 22nd.


COT Data Summary as of March 1, 2011
Large Speculators Net Positions vs. the US Dollar

Euro: +51,308
British pound sterling: +25,809
Japanese yen: +41,274
Swiss franc: +18,017
Canadian dollar: +72,827
Australian dollar: +71,853
New Zealand dollar: +7,411
Mexican peso: +97,202

Further COT Resources from around the web: