CHFJPY Continues Bullish Trend

By Forex Signs, Inc.

The pair CHFJPY is looking bullish as it remains within the bullish channel as seen on H4 time chart. Price currently consolidates between support level 87.010 and resistance level 87.765. Buy bias in the long term is feasible as price moves within bullish channel. As of this writing price has formed a weak downtrend. If price makes a break below the support level price action may form a bearish correction, testing 86.083. A break below 86.083 level may signal a bearish reversal for this pair. If price makes a break above the resistance level it will only confirm the buy bias for the long term. RSI (14) shows price remains in neutral, suggesting an upward trend may continue momentum.

Green is Wealth for Japan

There is a slight chance that the Japanese yen may hit a bullish mark against its Asian currency colleague, the New Zealand dollar, as Japan’s government is set to invest in green technologies. The government of the land of the rising sun, together with its industries, is likely to endow $6.4 billion in green energy technologies over the next 15 months. With this project, economy in Japan is expected to be healthy as employment will arise together with the manufacturing industry.

Further, the government would offer financial backings worth $1.9 billion while the rest of the outlay is likely to come from some 142 companies which include Fuji Electric Holding, Toda Kogyo Corp, Toshiba Corp, Sharp Corp and Panasonic Corp. Investments would be made in a wide range of green technologies like fuel-efficient cars, energy-efficient appliances, LED lighting systems and solar panels.

With this, the Japanese yen can expect a boost as speculators may see optimism in Japan’s economy. However, as soon as Japan sees a strengthened yen, there is a chance that they will do something to wane it as it may harm their export industry.

About the Author

Forex Signs, Inc., Founded in 2006 in Wall Street, New York City, FSI relentlessly strives to be the premier Forex brokerage company in the industry by providing exclusive and unmatched trading and investment related services while constantly developing innovative solutions that cater to the vast requirements of both individual and institutional market participants.
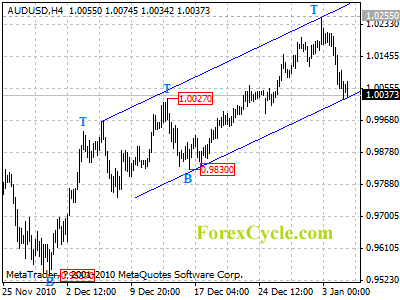
AUDUSD formed a cycle top at 1.0255

AUDUSD formed a cycle top at 1.0255 level on 4-hour chart, the subsequent pullback had bring price to the lower border of the price channel. Rebound from the bottom line of the channel would likely be seen later today. Resistance is at 1.0110, a break above this level could trigger another rise towards 1.0300 area. However, a clear break below the channel support will indicate that the uptrend from 0.9537 had completed at 1.0255 already, then the following downward move could bring price back to 0.9650-0.9700 area.

audusd

Daily Forex Forecast

Prechter on CNBC – “Not a bear among them”

Prechter on CNBC – “Not a bear among them”

Robert Prechter of Elliott Wave International and Don Luskin of Trend Macro
share their opposing market views with CNBC host Larry Kudlow. (Note:
Prechter’s interview starts about four minutes into the interview).

Get Up to Speed on Robert Prechter’s Latest Perspective — Download this
Special FREE Report Now.

About the Publisher, Elliott Wave International
Founded in 1979 by Robert R. Prechter Jr., Elliott Wave International (EWI) is the world’s largest market forecasting firm. Its staff of full-time analysts provides 24-hour-a-day market analysis to institutional and private investors around the world.

Is Your Bank on the “100 Safest” List? Maybe You Should Find Out

Close to Collapse: Bailed-Out Banks Facing Bankruptcy

By Elliott Wave International

We want to trust in the financial stability of our bank. After all, most of us have money in these institutions.

In spite of our wishful thinking, the tide of bank failures has not stopped. And these failures are occurring well after the heart of the financial crisis — and even after some of these banks received bailouts.

“Nearly 100 U.S. banks that got bailout funds from the federal government show signs they are in jeopardy of failing.

The total, based on an analysis of third-quarter financial results by The Wall Street Journal, is up from 86 in the second quarter, reflecting eroding capital levels, a pileup of bad loans and warnings from regulators.

The 98 banks in shaky condition got more than $4.2 billion in infusions from the Treasury Department under the Troubled Asset Relief Program.”

Wall Street Journal (12/26)

Seven of the 98 small banks mentioned have already failed.

In the U.S. so far this year, 157 banks have failed — that’s the highest number since 1992.

More failures are likely because many banks are burdened by questionable “assets” and bad real estate loans.

“…your money is only as safe as the bank’s loans. In boom times, banks become imprudent and lend to almost anyone. In busts, they can’t get much of that money back due to widespread defaults.

If the bank’s portfolio collapses in value, say, like those of the Savings & Loan institutions in the U.S. in the late 1980s and early 1990s, the bank is broke, and its depositors’ savings are gone.”

Conquer the Crash, 2nd edition, pp. 175-176

Yes, the Federal Deposit Insurance Corporation (FDIC) insures depositors, but the question is: Does the FDIC have the wherewithal to “make whole” all depositors if scores of banks go under at the same time? Here at Elliott Wave International, we do not recommend that you count on the FDIC. Here’s why:

“…did you know that most of the FDIC’s money comes from other banks? This funding scheme makes prudent banks pay to save the imprudent ones, imparting weak banks’ frailty to the strong ones.

When the FDIC rescues weak banks by charging healthier ones high ‘premiums,’ overall bank deposits are depleted, causing the net loan-to-deposit ratio to rise.

The result, in turn, means that in times of bank stress, it will take a progressively smaller percentage of depositors to cause unmanageable bank runs.”

Conquer the Crash, 2nd edition, p. 177

Are some banks safer than others? We think so.

“Hope is not a strategy.” If you plan to have money on deposit at a bank, we suggest reading our FREE report, Discover the Top 100 Safest U.S. Banks.” This 10-page bank safety report is available to you after you become a Club EWI member.Inside the revealing free report, you’ll discover:

  • The 100 Safest U.S. Banks (2 for each state)
  • Where your money goes after you make a deposit
  • How your fractional-reserve bank works
  • What risks you might be taking by relying on the FDIC’s guarantee

Please protect your money. Download the free 10-page “Safe Banks” report now.
Learn more about the “Safe Banks” report, and download it for free here.

This article was syndicated by Elliott Wave International and was originally published under the headline Is Your Bank on the “100 Safest” List? Maybe You Should Find Out. EWI is the world’s largest market forecasting firm. Its staff of full-time analysts led by Chartered Market Technician Robert Prechter provides 24-hour-a-day market analysis to institutional and private investors around the world.

US Dollar advances on better US Factory Data

The US dollar gained on start of the North American Session on Tuesday backed by better US Factory data. The dollar index DXY which measures the greenback’s performance versus its major six rival currencies surged to 79.44 as compared to 79.152 on Monday’s late trading session.

The latest report released by US Commerce Department showing that factory data gained 0.7 percent in November surpassing all expectations which stood around increase of 0.1 percent.

Senior market analyst Andrew Wilkinson from Interactive Brokers commented, “The dollar ought to be on the wane as investors stretch to reach incremental yield elsewhere. But with signs that the domestic economy is once again expanding and ahead of the major nonfarm employment report due on Friday, there seems to be a revival in support for the dollar.”

The US dollar advanced versus the Japanese Yen to 81.94 as compared to 81.24 as on Monday. The Euro also gained 0.2 percent to 109.15 against the Japanese Yen whereas the Euro slightly declined versus the greenback to 1.3309 as compared to 1.3363 on Monday’s late trading session.

The Euro have been trading on much optimistic sentiments since the start of North American trading session on the latest data  released by European Union’s statistics agency depicting that consumer price inflation increased to 2.2 percent in December as compared to 1.9 percent in the month of November.

The British Pound advanced 0.8 percent to 1.559 against the US dollar. Sterling moved up on the CIPS manufacturing PMI of 58.3 which happens to be the highest in last 16 years.

About the Author

Daily forex trading news written by Rehan from DailyForexTrade.com

FOREX: Large Currency Speculators trim bearish bets against US Dollar

By CountingPips.com

The latest Commitments of Traders (COT) report, released on Monday by the Commodity Futures Trading Commission (CFTC), showed that futures speculators trimmed their short bets of the US dollar against the other major currencies. Non-commercial futures positions, those taken by hedge funds and large speculators, were overall net short the US dollar by $8.85 billion against other major currencies as of December 28th. This is down from the total short position of $8.97 billion on December 21st, according to the CFTC data and calculations by Reuters which calculates the dollar positions against the euro, British pound, Japanese yen, Australian dollar, Canadian dollar and the Swiss franc.

EuroFx: Currency speculators added to their shorts of the euro against the U.S. dollar for a second straight week as of December 28th. Euro positions fell to 26,479 short contracts from a total of 14,093 short positions registered on December 21st. This is the largest short position in the euro since July 2010.

The COT report is published every Friday (or Monday due to holidays) by the Chicago Mercantile Exchange (CME) and shows futures positions as of the previous Tuesday. It can be a useful tool for traders to gauge investor sentiment and to look for potential changes in the direction of a currency or commodity. Each currency contract is a quote for that currency directly against the U.S. dollar, where as a net short amount of contracts means that more speculators are betting that currency to fall against the dollar and net long position expect that currency to rise versus the dollar.

GBP: Speculators added to their British pound sterling short positions to a total of 13,121 short contracts on December 28th following the previous week’s short positions of 7,432 contracts. Pound sterling contracts have now been short for five straight weeks dating back to November 30th.

JPY: The Japanese yen net long contracts more than doubled as of December 28th with 29,641 long contracts from 12,529 net long contracts reported on December 21st.

CHF: Swiss franc long positions rose higher for a fourth straight week to a total of 14,002 long contracts as of December 28th after totaling a net of 12,527 long contracts on December 21st.

CAD: The Canadian dollar positions increased as of December 28th. CAD long positions registered 34,787 contracts after totaling 24,948 net longs on December 21st.

AUD: The Australian dollar positions advanced higher for a fourth consecutive week. AUD contracts increased to a net amount of 64,316 long contracts as of December 28th from 60,550 long contracts on December 21st.

NZD: New Zealand dollar futures positions reversed five straight weeks of decline to rise to 8,115 long positions as of December 28th. NZD large speculator long positions had fallen to a total of 7,366 long contracts on December 21st.

MXN: Mexican peso long contracts edged slightly higher as of December 28th to 82,246 net long positions from 78,002 longs the week prior. The latest data is a third straight week of increase for the Mexican peso speculative positions.

COT Data Summary as of December 28th, 2010
Large Speculators Net Positions vs. the US Dollar

EuroFx: -26,479
British pound sterling: -13,121
Japanese yen: +29,641
Swiss franc: +14,002
Canadian dollar: +34,787
Australian dollar: +64,316
New Zealand dollar: +8,115
Mexican peso: +82,246

Go to the Commitment of Traders CME raw futures data

Further COT Resources from around the web:

Dollar May See Boost against NOK

By Dan Eduard

Since early last week, the US dollar has been steadily dropping against its Norwegian counterpart. The USD/NOK pair has fallen close to 1300 pips since the 27th of December, largely due to the low volatility that existed in the marketplace around the Christmas holiday. It now appears that the pair may be due for a reversal, with technical indicators showing an impending bullish move is likely to occur.

We will be analyzing the daily chart for the USD/NOK pair, provided by Forexyard. We will be looking at the Stochastic Slow, Williams Percent Range and Relative Strength Index (RSI).

1. As we can see, the Stochastic Slow has formed a bullish cross. This is typically a solid sign that the pair is in oversold territory, and an upward correction is likely to take place.

2. When analyzing the Williams Percent Range, we typically view the -80 and -20 levels as the borders for the instrument being in oversold and overbought territory, respectively. As we can see, the indicator is just below the -80 level, meaning the USD/NOK is likely oversold and may see bullish movement.

3. The RSI is currently right on the border of being in the oversold region. Traders will want to keep a close eye on this indicator. When it crosses the bottom support line, upward movement will likely follow.

Forex Market Analysis provided by ForexYard.

© 2006 by FxYard Ltd

Disclaimer: Trading Foreign Exchange carries a high level of risk and may not be suitable for all investors. There is a possibility that you could sustain a loss of all of your investment and therefore you should not invest money that you cannot afford to lose. You should be aware of all the risks associated with Foreign Exchange trading.

GBP/USD Reaches Short Term Resistance

By Russell Glaser

The GBP/USD has risen in early trading to a resistance line that may contain the pair for the rest of the trading day.

As the Cable rises, it has run into a resistance level at 1.5650. Traders may be able to use this as an entry point to short the pair with a first target at the short term support level at 1.5540 followed by the December low at 1.5340.

Further resistance may be found at the falling trend line from the November high which comes in today at 1.5700.

Forex Market Analysis provided by ForexYard.

© 2006 by FxYard Ltd

Disclaimer: Trading Foreign Exchange carries a high level of risk and may not be suitable for all investors. There is a possibility that you could sustain a loss of all of your investment and therefore you should not invest money that you cannot afford to lose. You should be aware of all the risks associated with Foreign Exchange trading.

Asian market wrap: AUD loses some glitter, JPY falls also; By FastBrokers Research Team

Written by FastBrokers House
2011-01-04 00:00

The AUD was the main mover today, although this time the move was lower. Floods in Queensland and the failure of Gold to hold above $1420 initiated some profit taking and stops were then triggered in the AUD/USD below 1.0120. EUR/AUD also completed a potentially bullish reversal pattern which attracted some buying. Ranges: AUD/USD 1.0095/1.0171

USD/JPY has also moved gradually higher as buoyant equity markets encouraged short-covering in the JPY crosses. Talk that both Kampo and China had buying interest yesterday near 81.00 has also encouraged some short covering. Ranges: USD/JPY 81.62/82.12, EUR/JPY 108.94/109.67

EUR/USD fell early as talk swept through the market of bond redemptions later today. The pair fell from 1.3370 to 1.3330 before steadying and then rallying on some at times heavy EUR/JPY buying. Technical buying in EUR/AUD also helped to underpin. Ranges: EUR/USD 1.3330/77, EUR/CHF 1.2456/1.2503

There has been little or no interest in the sterling today with cable trading a tight 1.5475/1.5506 range and EUR/GBP seeing .8605/31.

Market Commentary provided by FastBrokers.

Disclaimer: FastBrokers’ market commentary is provided for information purposes only and under no circumstances should be regarded neither as an investment advice nor as a solicitation or an offer to sell/buy any financial product. FastBrokers assumes no responsibility or liability from gains or losses incurred by the information herein contained.

Risk Disclosure: There is a substantial risk of loss in trading futures and foreign exchange. Please carefully review all risk disclosure documents before opening an account as these financial instruments are not appropriate for all investors.

Forex Daily Market Commentary

By GCI Forex Research

Fundamental Outlook at 0800 GMT (EDT + 0400)

USD

The dollar rallied throughout the Asia session, in the wake of yesterday’s solid ISM report. Gains were most pronounced against the AUD, NZD, JPY, and CHF. EURUSD traded 1.3329-1.3389, USDJPY 80.93-82.18. Equities have had a good start to the new year – the S&P 500 finished up over 1%, and the Nikkei 225 is +1.6% higher at the time of writing, while the US 10y yield is relatively unchanged at 3.37%. The manufacturing ISM index for December rose as expected to 57.0 and the new orders index, the most leading component, also advanced. Details of the report showed a gain in the production component and while the employment index slipped, the reading still indicates net headcount gains. Our team of analysts note that the increase in the headline reading leaves the index at a very healthy level and suggests upward momentum at the end of Q4, which is consistent with their forecast of real GDP growth picking up from a +2.6% pace in Q3 to +3.5% in Q4. Construction spending also rose for November, though less than October. Up next are the minutes from the Dec. 14 FOMC meeting, which could shed more light into how officials view the effectiveness of QE2 in the context of the November payrolls disappointment and higher Treasury yields.
EUR

In a piece in Spanish paper El Pais, China’s vice-Premier Li Keqian said China will continue to buy Spanish government debt in the future. The comments come ahead of his week-long visit to Spain, Germany and the UK, where the EU’s sovereign crisis and potential Chinese help is expected to be high on the agenda.
German manufacturing PMI was softer than expected at 60.7, however the factory jobs index came in at 57.1, the highest in the survey’s 14-year history.
The ECB announced it completed ?164mm of bond purchases under the Securities Markets Program (SMP) in the week to December 31, compared to ?1.121bn the week before. This brings the total purchases under the SMP to ?73.5bn

TECHNICAL OUTLOOK
USDCAD 0.9889/25 support zone.
EURUSD BULLISH Momentum is positive; break of 1.3425 would expose1.3499. Support at 1.3251.
USDJPY BEARISH The outlook remains bearish; focus is on 80.93 ahead of 80.54. Resistance is at 84.51.
GBPUSD BEARISH Support zone 1.5297/65 holds while initial resistance at 1.5665.
USDCHF BEARISH Bearish outlook remains; focus is on 0.9301 ahead of 0.9202; initial resistance is at 0.9734.
AUDUSD BULLISH Bull trend is intact; focus is on 1.0256 resistance while support lies at 0.9951/18.
USDCAD BEARISH Bearish outlook; targets 0.9889/25 support zone. Initial resistance is at 1.0008.
EURCHF BEARISH Outlook remains bearish; break of 1.2402 would expose 1.2283; resistance at 1.2714.
EURGBP BULLISH Upside momentum with focus on 0.8692, a break here exposes 0.8777. Support at 0.8503.
EURJPY BEARISH Support holds at 107.61, break here would expose 105.80. Resistance at 110.82.

Forex Daily Market Commentary provided by GCI Financial Ltd.

GCI Financial Ltd (”GCI”) is a regulated securities and commodities trading firm, specializing in online Foreign Exchange (”Forex”) brokerage. GCI executes billions of dollars per month in foreign exchange transactions alone. In addition to Forex, GCI is a primary market maker in Contracts for Difference (”CFDs”) on shares, indices and futures, and offers one of the fastest growing online CFD trading services. GCI has over 10,000 clients worldwide, including individual traders, institutions, and money managers. GCI provides an advanced, secure, and comprehensive online trading system. Client funds are insured and held in a separate customer account. In addition, GCI Financial Ltd maintains Net Capital in excess of minimum regulatory requirements.

DISCLAIMER: GCI’s Daily Market Commentary is provided for informational purposes only. The information contained in these reports is gathered from reputable news sources and is not intended to be U.S.ed as investment advice. GCI assumes no responsibility or liability from gains or losses incurred by the information herein contained.