Options Trading Advice and Tips

By Owen Trimball

Those of you searching for option trading advice tend to be either a novice to the options market, or are experienced traders experiencing some problems with their active trades and therefore are hoping for a solution. If you happen to with the first group perhaps you are trying to find some advice about how to start out options trading, what risks are involved and how to prevent them, the best way to trade safely and still make consistent profits. Should you be among the second group, there are ways to save or at least, salvage, failing trades, but this discussion must be left for another article.

So what is the most helpful option trading advice for beginners?

The simple answer is, to be sure you first understand all there is to know about options trading, especially the principle of time decay, before you decide to risk any of your hard earned money. Decide what sort of trader you wish to be. Do you want to be a day-trader, a short term trader or a longer term trader who only needs to look at your positions to determine if you need to adjust them once daily and it has at least a monthly or longer strategy in place.

The next thing you might want to ask is, what underlying financial instruments do you prefer to connect your options to? Stocks, commodities or foreign exchange? Whichever one you select, they each have their unique set of characteristics. Stocks can ‘gap’ overnight. Commodities may become very volatile. Currencies trade around the clock five days per week and are also affected by economic news items.

Understand also, that the shorter timeframes you are going to trade, the greater the stress and if you hold your positions overnight, the more risk of losing trades hurting your account.

The Dangerous Way to Trade Options

In imparting option trading advice, we would be remiss if we didn’t bring to your attention the fact that, like any business, there is a high risk and also a safe method of doing it. If your intended strategy is to merely buy call or put options in an attempt to predict short term market direction and profit from these movements in just a few days, you should understand that even though this carries a possible high reward profile which makes it appealing, there is also a much greater risk that the price will go against you so that your losses can quickly be greater than your profits. Many traders who attempt to forecast short term market direction have cleaned out whole trading balances.

Perhaps you may believe you’ve discovered an option trading system that works for this kind of strategy. But if you want some real option trading advice here, you ought to ask yourself whether you have the emotional self discipline to take stop losses and also remain in trades for enough time to realize desired profits. Do you have enough free time to be able to completely focus and take action whenever the need arises? The risky way of trading options often seems alluring to inexperienced traders due to the simplicity of its approach and the confident prospect of making considerable profits. But even well seasoned traders find market prediction challenging, so watch out for systems promising you the moon.

The Low Risk Way

Now here is the best option trading tip you might ever receive. If you understand the principle of time decay, i suggest you learn how to use this to your advantage. It is more advantageous to be on the short side of an option contract compared to the long side, due to this characteristic of options. Taking positions with about a month or slightly more to expiry date and being on the selling side of option contracts gives you a clear advantage.

Even so you should also add to this advantage, the art of adjustments. Despite having the advantage of time decay working for you, the underlying price movement can come close to breaking through your breakeven points prior to option expiry dates and this is where you have to know what to do. If you adjust your positions in the right way at this point, you not only save them from loss but guarantee additional profits at the same time.

In connection with the above strategy, you should consider trading indexes as an alternative to individual stocks. The reason behind this, is that you prefer a smooth price movement to a volatile one. While a news item may unexpectedly impact the price of a particular stock it won’t have much affect on the index to which that stock is related. An index is the aggregate of a selection of stocks such as the Dow Jones, the Russell 2000, the OEX, QQQQ or the S&P500 in the USA. Options are available on all these indexes.

Trading double calendar spreads and iron condors on indexes and knowing how to modify your positions at the appropriate time, is one of the best trading techniques I have encountered. My option trading advice for you is to at least familiarise yourself with these and enable yourself to trade with confidence.

About the Author

Owen has traded options for many years and writes for Options Trading Mastery, a popular site about the best Option Trading Strategies. Discover a wealth of information about options, including the popular iron condor
Sinophil Corp. (SINO) Takes Cue From Belle and Leisure & Resorts World

If any one of you missed the Belle Corporation (BEL) and Leisure and Resorts World Corporation (LR) trains like me, don’t fret, Sinophil Corporation or SINO in the Philippine Stock Exchange could take you to another bullish ride with a huge potential upside. Back in August of 2010, BEL was just trading at around PHP 2.00 per share. It closed at PHP 5.14 last Friday. LR was also just exchanging at around PHP 2.00 during the same month last year before it erupted. Last Friday, it ended on a high tone and closed at PHP 5.64. BEL, LR, and SINO, by the way, are affiliate companies, which are engaged in a hotel and casino business.

Belle Corp. is a leading Philippine developer of high-end residential and leisure properties. It is the name of behind the Tagaytay Highlands and Midlands. Leisure and Resorts World Corp., on the other hand, operates a professional bingo and interactive games licensing business. The two firms joined hands to build a operate hotel and casino worth PHP 9 billion along Roxas Boulevard in Manila. The Belle Grand Manila Bay will have its soft opening by fourth quarter of this year.

So what about SINO? Well, SINO, an investment holding company, is also involved in gaming, property development, pay-per-view entertainment and information systems. It also has stakes in both LR and BEL.

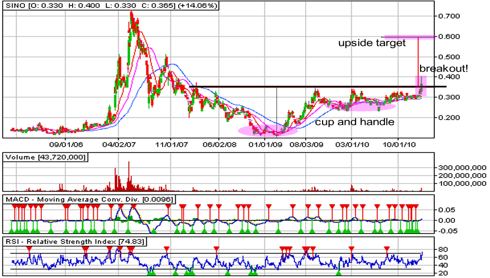
From a technical point of view, SINO has just broken out from a cup and handle pattern when it breached the neckline or the “cusp of the cup” which is around PHP 0.34 last Friday. SINO closed at PHP 0.365 last Friday, up by 14.06%. If SINO is able to keep its head above the neckline on Monday, then a journey towards its upside target (measured by projecting the height of the pattern from the point of breakout) around PHP 0.60 is quite possible. A minor resistance, however, could be met at PHP 0.50. Still, both targets represent a 40% and 60% upside in the near term. Not bad.

More on LaidTrades.com


Understanding the Pitfalls of Stock Trading

By Dave Johansen

Here are some of the most common stock trading pitfalls you will come across as a stock trader. First you need to be able to recognise them and you will then be better placed to avoid them.

Runaway Trend Equals Runaway Train

You should always avoid trading a runaway trend. If you have missed your planned entry price for a stock you are following, it is often better to wait rather than try to enter a position as the trend accelerates.

More than likely the stock will be pulled back and again test the trend breakout point allowing you to enter at a price closer to your original desired entry point.

If you are already holding a position in the stock just revise your exit point upwards and adjust your stops accordingly. Consider reducing your position to leave as much profit in the trade as possible.

Averaging Down

Averaging down when stock trading is usually a bad idea despite what many investment advisors may tell you.

It’s supposedly a good way to reduce your cost base but we feel it’s a way of throwing good money after bad. A good stock trader sells losers not buys into them!

However, averaging up or ‘pyramiding’ is a good practice to adopt. Buying more of a stock that is trending up can never be a bad idea. Just be aware not to over expose yourself to one particular stock in your portfolio.

Ignore Your Stops At Your Peril!

Ignoring your stops when stock trading is probably the easiest and most common stock trading mistake.

It’s so easy to talk yourself out of obeying your stops both on the upside and downside.

When a stock is rising it’s very tempting to raise your stops too close to the price and any pullback will see your stopped out.
Conversely, when a stop is falling, unless you stick to your stops you are really entering the realm of wishful thinking that a stock will rebound above the point you should have sold at.

Trust your technical analysis and stick rigidly to your stop loss planning.

You will lose at stock trading, that is the nature of the business. How you manage those losing trades will ultimately be the key to your overall success. Cut your losses quickly and let the winners ride as long as possible.

Dont’ Over Diversify

Diversify when stock trading as everyone will tell you. However it is just as big a stock trading mistake to diversify too much as too little.

There are only so many hours in the day and you are just one person, so there will be a limit on how many positions you can manage and monitor.

That limit will vary from person to person so you need to find a level you are comfortable with.

It is far better to manage a small number of positions successfully than to have your fingers in too many pies to the extent that you cannot possibly keep track.

Start with four of five positions and then work your way up rather than the other way around.

Conclusion

To steer a path clear of these stock trading pitfalls you need a stock trading plan, a plan you will stick to. Avoid jumping aboard the runaway train, don’t stretch your resources too far and stick rigidly to your trading stops.

About the Author

I’m Dave Johansen, co-owner of MarketCapMania.com, a website dedicated to the online stock trader. See our Zacks Investment Review and find out how to get a free 30 day trial of this premier investment newsletter.

American Express (AXP) Keeps You Shopping


Looks like heavy promotional activity like big discounts spurred shopping traffic last year and many people have been using credit cards. I’m most likely sure you’re one of them my friend!  The more credit cards being used, the more profits credit card companies make. Consumer spending increased during the holidays to buy gifts or whatever is needed for Christmas. More shopping means more chances of using credit cards. Given the fact that unemployment claims have been settling since mid of 2009, credit card companies have a better reason to offer credit cards to consumers because if more people have jobs, more people make money. Thus, people have better spending ability and if they use credit cards, they can most likely pay it off with their salary. Since American Express Company (AXP) is one of the biggest credit/charge card  company out there, it sure gets a big piece of the “credit card spending” pie. As a result, traders are speculating on an outstanding 2010 4th quarter net earnings for American Express this coming January 24 which  has been causing its stocks to move higher for the past two weeks.

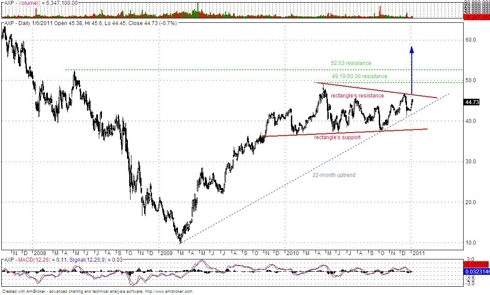
On my last post on American Express (kindly check here), it seemed  there was a head and shoulders formation and the stocks were bound to drop. What looked like a bearish formation could actually be a consolidation process of an area pattern which is the rectangle (could be a triangle for others). Since I’m biased with the uptrend, this rectangle is more likely bullish. In case the stocks breakout above the rectangle’s resistance, I see an upside target of 58.00 USD which is almost a 30% gain from the current value of 44.73 USD. I got my target price by measuring the size of the base of the rectangle then added it to the possible breakout point. This could end the 1-year sideway consolidation of the stocks. However, along its possible rise, AXP could encounter some selling pressure at 49.19-50.00 and 52.63 resistances. On the flip side, the immediate support could be the 22-month uptrend. If that gets broken, the next level could be the rectangle’s support.

More on LaidTrades.com

Filinvest Development Corp. (FDC), Making The News

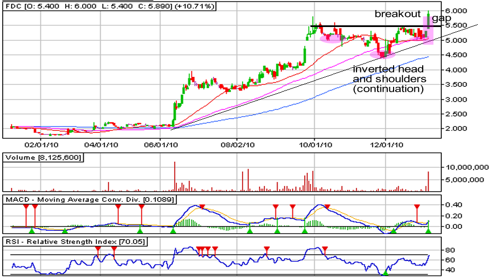
Filinvest Development Corporation or FDC in the Philippine Stock Exchange broke its silence yesterday when it rose by 10.71%. It actually erupted out of an inverted head and shoulders continuation pattern (see chart) and even gapped up in yesterday’s trading. With volume to support the move, I’d say that FDC could sustain its journey higher. So judging by the height of the pattern, it could at least rise by another PHP 1.00 to PHP 6.50. That’s about 10.36% upside from yesterday’s closing of PHP 5.89.

Fundamentally, Filinvest Development Corp. will hold a follow-offering to finance its expansion plans and to abide by required public float of at least 10%. Presently, FDC’s public ownership only amounts to 6%. With its plan to raise up to 2.5% billion more shares, public ownership would increase to around 29.5%. While an increase in public does not necessarily reflect positively in the company, the additional funds would allow the company to develop its real estate and hospitality business, support its investments in utilities and infrastructure, and to settle some of its credit obligation.

More on LaidTrades.com

To LIB Another Day!


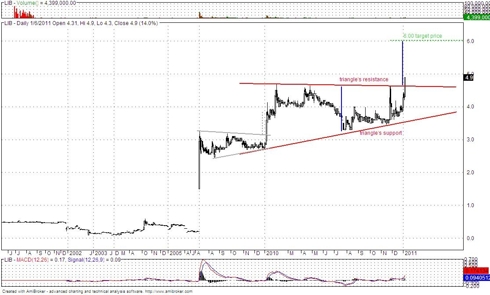
Hi guys, here’s my Philippine stock pick of the week – Liberty Telecoms Holdings, Inc. or LIB in the Philippine Stock Exchange. This company is a joint venture between San Miguel Corporation (SMC) and Qatar Telecoms (QTEL). As the name “Liberty Telecoms” suggests, they are involved in the telecoms industry. They currently offer Wireless Interoperability Microwave Access or WiMAX Internet connections and planning to offer other products as well in the near future. Many of the San Miguel owned companies have flown immensely like Petron Corporation (PCOR) and San Miguel Brewery (SMB) so could this be the next big one?

In my technical analysis, Liberty Telecoms has freshly broken out from a classic ascending triangle area pattern closing today at its all-time high at PHP4.90 with a 14% gain and a heavy volume. After consolidating sideways for more than a year, it could now surge higher without any resistances blocking its path. My conservative target price for this is PHP6.00. I got my target price by getting the size of the base of the triangle added to the breakout point. In case LIB doesn’t push through with its breakout, it could descend to the immediate support which is the triangle’s resistance and bounce back up. If it further drops below that level, the next support could be the triangle’s support.

More on LaidTrades.com

US Dollar Soared After Strong US Figures

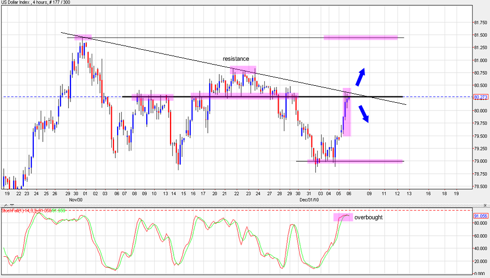
The US Dollar Index (USDX), an index which measures the valuation of the US dollar against a basket of currencies like the euro, has been stuck in a trading range after it rebounded from its low of 75.631 last November 4. It peaked at 81.444 on November 30 but it has since moved sideways. Yesterday, however, the dollar jumped by 1.0%, its best percentage gain in three weeks. As you can see from the index’s 4-hour chart, it jumped 79.50 to settle just above 80.20. Presently, there are very heavy resistances above the index’s current level. However, a potential pennant pattern could now be forming and a breakout from it could send the index towards its November peak. But if a breakout does not occur, the dollar could weaken and fall back to 79.00. An overbought condition, as indicated by the stochastics, also makes this scenario possible.

Fundamentally, the surprise jump in the US’s private sector jobs and solid growth in its service sector helped buoy the USD. Private payrolls firm ADP that 297,000 new jobs were created in December, almost tripling the market’s forecast of only 101,000. Confidence and dollar buying got another boost when the Institute for Supply Management (ISM) also posted an more-than-projected improvement in its index. The index rose to 57.1 in December from 55.0 in the previous month which is over the 55.6 consensus.

To end the week, the mother of all economic report, the US Non-farm Payrolls (NFP) report will be on deck. About 136,000 new jobs is expected to have been created in December from only 39,000 in November. But with the huge positive gap in the ADP’s figure, an upside in the actual employment figures could happen. Unemployment rate for the same period is also expected to improve to 9.7% from 9.8%. This would definitely enhance the market’s optimism and push both the equities markets and the dollar higher. Let’s hope this outlook does not get whacked like what the Sea Shepherd activists did to a Japanese whaling ship recently.

More on LaidTrades.com


Semirara Mining Corp. (SCC), Knocking On Heaven’s Door?

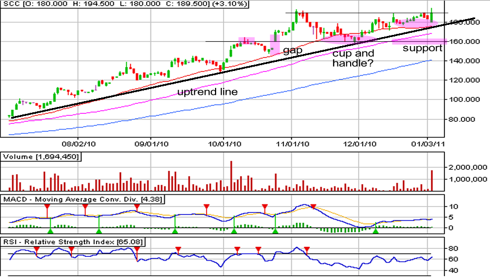
Good day my trader friends! Here’s a technical update on Semirara Mining Corporation or SCC. You see, after breaking free from the PHP 60.00 threshold back in April 2010, SCC has gone nowhere but up. In less than a year, it was able to reach past PHP 180.00, easily tripling it’s original value. In fact, it already marked a new all-time high at PHP 194.50 just yesterday. The question now is, will SCC continue its move towards uncharted territory? Or will traders see the previous high at PHP 193.00 as a resistance?

Since marking a peak on November 3, SCC has formed what appears to be a cup and handle pattern. A successful move, therefore, above PHP 193.00 could propel it by at least by another PHP 33.00. If you ask me, I’d say that it is likely for it to hit the said target given its overall trend (uptrend). Moreover, the gap, which I highlighted in the chart, has not been filled yet. Such can bee seen as a bullish signal for the stock. In case it fails to move up above PHP 193.00, the uptrend line is still there to keep it afloat. However, a break of the uptrend line could send it falling towards the support at PHP 160.00.

More on LaidTrades.com

US Dollar, Gold, S&P 500, and the Options pressure

By J.W Jones, OptionsTradingSignals.com

With the holiday season in the rear view mirror and volume slowly creeping back into the marketplace, I can’t help but wonder what lies ahead. The optimist in me is hopeful that the economy will continue to repair itself and the financial issues that plague the federal government, state government, and local governments will just go away as the economy rebounds. The only problem with my hope is that massive debts and deficits do not simply disappear and I fear the problem will be a long and lasting one.

Federal Reserve chairman Ben Bernanke indicated that unemployment numbers are likely to remain stubbornly high for an extended period of time. He also made it clear that Quantitative Easing II was necessary and needed to be continued in a vain attempt to keep interest rates low. Since its inception, treasury rates have done nothing but increase which begs the question whether the program is really doing anything it was intended to do.

In addition to our domestic debt issues, unemployment claims, and poor housing market we find that the crisis in Europe while somewhat muted, continues to manifest in a negative fashion. Nearly every where we look we are surrounded by fundamental issues which directly impact risk assets. These issues have been constant for quite some time and the S&P 500 has shrugged them off and powered higher. The S&P 500 has put on quite a run since the March 2009 lows, and while we have had several corrections and a “flash crash” along the way, we have yet to see a major correction turn into bearish market conditions.

Is price action today an early warning sign that lower prices await us in the equities market. Is the U.S. Dollar going to breakout above the 50 period moving average and challenge the 83 price level on the weekly chart?

If the resistance zone listed on the weekly chart failed the dollar would seemingly be poised to test the triple tops around the 88-89 price level. Quadruple tops is not a technical pattern that is recognized by many traders as the 4th mouse typically gets the cheese. The flip side would offer that if resistance around the 83 price level holds and the Dollar plummets risk assets would move higher. It is too early to tell what is going to happen, but active traders need to be monitoring the U.S. Dollar Index closely as it will provide clues as to the direction of the S&P 500 and gold.

S&P 500

Friday’s market action is indicative that lower prices may be awaiting us in coming days and weeks. A reversal has been potentially carved out, but it remains to be seen if a top is in. Picking tops in a long term bullish trend is a fool’s game as bullish advances can be overbought for long periods of time as they advance higher. What is evident is that prices are being pushed lower and strong selling volume is confirming the potential for a longer term reversal. It is too early to tell if the price action is just working off overbought conditions or if this is a change in price action and market direction. The daily chart of the SPX illustrates the possibility that a reversal or the potential for an intermediate term top to be in.

The S&P 500 has tested the first support area around 1,260 today and it bounced which is typical price action. The question will be whether price will drift higher the rest of the day and close modestly lower, or if selling pressure will hold prices down near the lows of the day. In the recent past, Friday morning selloffs led to a drift higher that by the sound of the closing bell prices were flat or only slightly lower. Will today be different?

There are a few confirming signals that prices may continue lower. Recently Fridays have had relatively low volatility and light volume with the propensity to grind higher through the afternoon session and into the close. While the grind higher remains to be seen, volatility is rising. The Volatility Index (VIX) is trading nearly 3% higher on the day and is trading around the 18 price level as can be seen in the chart below. Price action remains at the upper bound of the lower channel. A breakout in the upper channel could result in additional selling pressure should that occur.

Another telling sign that additional sales pressure may be lurking next week or in the near future is the price action in the financials. The ETF XLF is currently trading down about 1.60% on the day and has completed a gap fill from last week. Price bounced as is typical, but selling pressure remains strong. If the financials continue to probe lower in coming days and weeks the S&P 500 will follow in suit.The daily chart of XLF is shown below.

In the end, it is simply premature to determine what the price action taking place today in the S&P 500 will lead too. We could see a drift higher this afternoon back to near break even which has been common in the recent past. We could see prices consolidate at current levels or we could see continuation selling with an intermediate term top being put in. At this point, all we can do is wait and see what happens. As I have said before, adjusting stops and taking profits is likely a sound strategy until we know more regarding the price action in the S&P 500 next week.

Gold Futures

Most gold bugs are expecting an outright U.S. Dollar meltdown. What if they are wrong? If you ask them the dollar is surely going to get destroyed and our way of life and standard of living is set for major changes. I do not know for sure what is going to happen, but if the crowd says the Dollar is sure to get killed, the contrarian trader in me wants to get long the dollar in a trade with a good risk / reward setup and defined risk.

If we look at the gold futures it is obvious that they are moving lower and a serious correction could be taking place. If gold futures break down below the 1,330 – 1,315 support area a full fledged correction of 10% or more could take place. The next major support level in gold futures would be around the 1,250 area. The daily chart of gold futures illustrates the key price levels that are currently in play.

Gold has already pulled back quite a bit from the recent highs, but time will tell how deep the pullback in the shiny metal will be. At first glance I would expect more carnage here simply because of how bullish the retail crowd is regarding gold. Longer term gold will likely remain in a bull market, but for those that took profits and have waited patiently gold could give us a solid risk / reward entry. The traders and investors that purchased above the $1,400 an ounce price point have either stopped out or their money is currently trapped. If prices go low enough, those trapped traders will eventually capitulate near the lows. If history serves us well, just about the time the last remaining weak gold bull gives up will be right around the intermediate term bottom.

Its hard to say what is going to happen on Monday or later next week, but based on the price action today it is going to be anything but ordinary. At this point I do not have a clear edge as to what is going to happen in the S&P 500 or gold. What I do know is that they are both under fire and the confirming signals in the VIX and financials is worthy of note. While I will not be jumping into either asset class with fresh capital, I will be watching closely to see if a low risk setup presents itself. Instead of trading based on a feel, a prediction, or a bias I intend to patiently wait to see what transpires next week before putting any capital at risk.

Have a great weekend!

If you would like to receive my Free Options Strategy Guide & Trade Ideas join my free newsletter: www.OptionsTradingSignals.com/profitable-options-solutions.php

J.W Jones