Five Personal Strategies to Control Market Greed

By Jared Levy, Editor, Smart Investing Daily, taipanpublishinggroup.com

Many of us (myself included) are drawn to the markets by the same force that can destroy our accounts: greed. While there are several ways in which greed can hurt us, there are five personal strategies that we can employ to control the market greed that is woven into our social fabric.

Personal Strategy 1: Be Aware That Greed and Fear Drive Price

Some may argue this über-simplistic view of the equity markets, but when you reduce that statement down to its purest form, it’s true! When someone is willing to pay a higher price for a stock, that person, most likely on some level, is satisfying his or her greed instinct, in that they want to profit from their belief that the stock is moving higher. This works the same when fear sets in and you are driven to sell a stock at a lower price because of whatever fear you may have at that moment.

The problem with the word greed is that it carries a negative connotation and most of us don’t like to admit our negatives.

Webster’s Dictionary defines greed as “a selfish and excessive desire for more of something (as money) than is needed.”

But what do we “need”? Is it bad to want to make a better life for yourself, pay your bills, and pay off your home or credit cards? Are we really being greedy? Maybe it should be that “need” and fear drive prices.

You see, for most of us who invest, we do so in order to make a better life for ourselves or our families, and enhance our way of life and retirement. The real problem is that these “wants” and “needs” in life, which are perfectly normal, sometimes end up getting in the way of our being a successful trader or investor.

Personal Strategy 2: Get to Know Yourself a Little Better

When I first started out as a trader, I had a lot to prove. I grew up from humble beginnings in Philadelphia, and I was always scared of being poor. I remember making my first trades thinking, “This could be the one that makes me a millionaire.” I learned quickly that a thought process like that was a surefire way to miss my mortgage payment and even worse, lose my job as a trader.

The truth is, I was lucky enough to be taught at an early age from my mentor that the game is all about getting as many “hits” as you can and just staying on base as much as possible.

Translated into market talk, that means that you should strive to make as many good trades as you can (there will be losers), and once you are in a good trade, have a realistic profit target and either protect, scale out or simply exit the trade and walk with your profits, even if they are small. Staying on base means keeping your loss amounts minimal and moving on.

(Investing doesn’t have to be complicated. Sign up for Smart Investing Daily and let me and my fellow editor Sara Nunnally simplify the stock market for you with our easy-to-understand investment articles.)

Personal Strategy 3: Listen to Your Gut

You would think that many retail investors fail because they don’t have some secret knowledge or technology at their fingertips, but the truth is that the Internet offers you more resources now than when I started and I was able to prosper.

Having good technology and knowledge helps, but it’s not the key to real success.

If you have been investing for over two years, you have probably got the basics down and can sense when stocks are being overbought or oversold. Follow those instincts and read the commentary from analysts and editors of reputable financial publications to confirm.

Usually the first clue is when your mother (who doesn’t know finance) starts talking about the stock market. By the time it reaches someone who has minimal interest, the trend is probably coming to an end.

Personal Strategy 4: You Don’t Have to Make That Trade

Yesterday, over 2 billion shares changed hands on the Nasdaq stock market alone; 9,500 of those trades were in blocks of 10,000 shares or more (generally there is some motivation if you are buying or selling 10,000 shares).

The point is that there is always opportunity long or short in the market — don’t force a trade because you feel like you “missed out.” Trust me, there will be thousands more investment possibilities to come.

I remember from March-April 2009, the S&P 500 rose about 23% in a month’s time. People couldn’t believe it; they thought they missed it. Then after rallying some more, there was another 17.5% pop from July to August. At this point, many thought the rally was surely over, but then from its August 2009 highs until the end of the year, the S&P rallied another 13%… See what I mean!

Personal Strategy 5: Fix the Problem

The bottom line is that it’s not technology, information, computers, account size, age or lack of intuition that is the biggest success culprit; it is our own greed and lack of action (or overaction) that gets us in trouble.

One exercise you can do to work on this is open up a virtual trading account at your brokerage firm (most offer them for free). In that account, I want you to make the investments you would make in your regular account, with the same typical investment size. But in this account, once you are in a profit of at least 5%, sell your position, and once you are in a loss of 4%, do the same. Also, once you get profitable in a trade, move your stop-loss just above where you would breakeven in the trade to prevent going back into the red.

Test this method out on paper and see if it helps or hurts you. It’s OK to take losses; just don’t let them overrun your winners. If you are 50/50 at picking your investments, this simple tip should help ensure you stay in the green.

Editor’s Note: Stop Giving These Crooks Your Money. It’s simple and easy. By using this little-known “siphoning” method, you could collect thousands of dollars every month without paying a cent to the mutual fund industry. Folks around the country are starting to break free from the high fees and low performance of the mutual fund industry. Learn more about this “siphoning” method from Safe Haven Investor.

About the Author

Jared Levy is Co-Editor of Smart Investing Daily, a free e-letter dedicated to guiding investors through the world of finance in order to make smart investing decisions. His passion is teaching the public how to successfully trade and invest while keeping risk low.

Jared has spent the past 15 years of his career in the finance and options industry, working as a retail money manager, a floor specialist for Fortune 1000 companies, and most recently a senior derivatives strategist. He was one of the Philadelphia Stock Exchange’s youngest-ever members to become a market maker on three major U.S. exchanges.

He has been featured in several industry publications and won an Emmy for his daily video “Trader Cast.” Jared serves as a CNBC Fast Money contributor and has appeared on Bloomberg, Fox Business, CNN Radio, Wall Street Journal radio and is regularly quoted by Reuters, The Wall Street Journal and Yahoo! Finance, among other publications.
Dollar Rallies vs. Euro as Unemployment Rate Falls To 9.4%

Source: ForexYard

The dollar continued its rally against the euro on Friday, despite the weaker-than-expected increase in hiring in December, reflected in the Non-Farm Payrolls data. The dollar strengthened as the U.S. Unemployment Rate has dropped to 9.4%, its lowest level since August 2009.

Economic News

USD – Dollar Closes a Bullish Weekly Session with Positive Labor Data

The U.S. dollar gained against most of the major currencies during last week’s trading session. The dollar saw a 550 pip rise against the euro last week, and the EUR/USD pair has dropped below the 1.2900 level for the first time since September 2010. The dollar rallied against the Japanese yen as well, as the USD/JPY pair gained about 250 pips.

The dollar rallied last week amid positive economic data from the U.S. Institute for Supply Management’s Non-Manufacturing Index. The index rose in December to 57.0, its highest level since May 2006, signaling that the economic revival is steadily increasing.

On Friday, the Non-Farm Payrolls report revealed that payrolls increased by 103,000, failing to reach analysts’ expectations for gains of 159,000 jobs. However, the dollar was not heavily impacted by the somewhat disappointing data as the Unemployment Rate dipped to 9.4%, its lowest level since August 2009.

Looking ahead to this week, many significant economic indicators are expected from the U.S. economy. Special attention should be given to the U.S. Inflation indicators – the Consumer Price Index and the Producer Price Index. Traders should take under consideration that further positive signals from the U.S. economy are likely to extend the dollar’s current bullish trend.

EUR – Euro Falls To a 4-Month Low against the U.S. Dollar

The Euro slipped against most of its major currency rivals during last week’s trading session. The euro fell about 550 pips against the U.S. dollar, marking a 4-month low for the EUR/USD pair. The euro also fell about 300 pips against the British pound and about 200 pips against the Japanese yen.

The euro weakened last week due to the uncertainty about the use of euro zone bonds of peripheral countries for bank loans. As long as the uncertainty remains among several members of the euro zone, the euro’s decline might proceed.

In addition, another reason for the euro’s weakness is the positive signals from both the U.S. and the U.K economies. The U.S. is showing a continuous recovery in the labor sector, and a steadily improvement in the economic activity. The U.K. is providing steady signals of recovery as well, which has boosted the pound.

As for the week ahead, the most significant economic release from the euro zone will probably be the Minimum Bid Rate, which is the euro zone interest rates publication for January. Current expectations are that the European Central Bank will leave rates at a record low of 1.00%. Traders are advised to follow the release, as well as the press conference that will follow it, as heavy volatility is likely to take place during this time.

JPY – Yen Falls against Most of the Major Currencies

The Japanese yen fell against most of its major currency counterparts during last week’s trading session. The yen fell about 250 pips against the U.S dollar, and the USD/JPY pair reached as high as the 83.65 level. The yen fell about 300 pips against the British pound as well. However, the JPY gained about 200 pips against the euro.

The Japanese currency was mostly impacted by movements of the major currencies during last week’s trading. The yen fell against the dollar and the pound after both the U.S. and the U.K. economies provided positive data, signaling that they are recovering at a faster pace than expected. On the other hand, the yen strengthened against the euro due to increased uncertainty regarding several economic aspects of the euro zone, which has weakened the euro on all fronts.

As for this week’s trading session, traders are advised to follow the Japanese Core Machinery Orders release, which is scheduled for Wednesday, as this report is likely to have a large impact on yen values. Traders should also notice that Japanese banks will be closed today in observance of Coming-of-Age Day, which might reduce the yen’s volatility.

Crude Oil – Oil Rallies as Alaskan Pipeline Shuts Down

Crude oil fell last week from $92.00 a barrel to as low as $87.20 in Friday’s session. However, in early trading Monday, crude corrected its losses, and the commodity is currently trading near $89.00 a barrel.

Crude oil prices are currently climbing for the first time in three days after a leak in an Alaskan pipeline caused that line to be temporarily shut down. The closure compelled companies such as BP Plc to suspend about 95 percent of production from the North Slope area, and as a result boosted oil prices.

Looking ahead to this week, traders should follow the developments regarding the Trans-Alaska Pipeline System, as this is likely to affect energy prices for the next few days. In addition, traders should follow the leading economic releases from the U.S. and the euro zone as these usually have a significant impact on crude prices.

Technical News

EUR/USD

The pair has recently dropped below the 1.2900 level, marking a 4-month low. In addition, both the Slow Stochastic and the RSI on the 4-hour chart are now pointing down. Going short seems to be the preferable choice today.

GBP/USD

The past month’s range-trading is continuing, and the cable is now near the 1.5540 level. Currently, with a bearish cross taking place on the 4-hour chart’s Slow Stochastic, it appears that a downward move may be impending. Going short with tight stops might be the right strategy today.

USD/JPY

On Friday, the USD/JPY pair saw a bearish correction and fell about 80 pips. Now, as a bearish cross is taking place on the 4-hour chart’s MACD and the daily chart’s Slow Stochastic, the downward movement will likely continue, with potential to reach the 82.20 level.

USD/CHF

For the past several days the pair has seen very little volatility, and remains near the 0.9650 level. Currently, the Bollinger Bands on both the 1-hour and 4-hour charts are tightening, indicating that sharp movement may occur. As the RSI on the 4-hour chart has recently dropped below the 70-line, it seems that the movement might be bearish.

The Wild Card

Crude Oil

Crude oil saw a sharp bullish move during morning trading, and the commodity is currently trading near the 89.30 level. In addition, as the 4-hour chart’s RSI has peaked above the 30-line and the daily chart’s Slow Stochastic has completed a bullish cross, it seems that further upward movement is expected. This might be a great opportunity for forex traders to join a very popular trend, and enter into buy positions now.

Forex Market Analysis provided by ForexYard.

© 2006 by FxYard Ltd

Disclaimer: Trading Foreign Exchange carries a high level of risk and may not be suitable for all investors. There is a possibility that you could sustain a loss of all of your investment and therefore you should not invest money that you cannot afford to lose. You should be aware of all the risks associated with Foreign Exchange trading.

Network Upgrade And Higher Electric Rates To Lift MERALCO

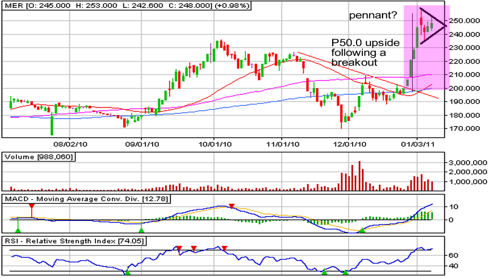
Early last week, Meralco or Manila Electric Company (MER), which is  the Philippines’ largest distributor of electricity, announced that it is considering to spend a total of PHP 45 billion from 2011 to 2015 to upgrade its electricity distribution network. About 85% of this projected capital expenditure will be used for the development of its delivery system and for the acquisition of additional transformers and meters. Meanwhile, the company, with the approval of the country’s Energy Regulatory Commission (ERC), will implement this January 2011 a new distribution rate. Upon implementation, the average distribution rate will increase to PHP 1.6464 per kilowatt-hour (kWh) from PHP 1.4917. Note that in June 2010, the company also petitioned the ERC for a hike in its rates to an average of PHP 1.7056/kWh in 2012, PHP 1.7686/kWh in 2013, PHP 1.8349/kWh in 2014, and PHP 1.9036/kWh in 2015. An upgrade and modernization of the company’s electric network will optimize its system, thus, decreasing its operating costs. This plus the implementation of a rate hike this year and a likely rate increases in the following years would indeed shore up MER’s coffers.

From a technical point of view, sentiment on MER had bullish given its sharp rise from PHP 200.00/share to PHP 258.00 from December 28, 2010 to January 3, 2011. After reaching the said high, MER’s upward momentum has tapered, leading it to form what appears to be a pennant pattern. Now, if buying interest resumes and MER breaks above PHP 250.00, it could once again aim for its historical high at around PHP 300.00 in the near term.

More on LaidTrades.com


Rumours Circulate Of Portuguese Bailout

In Brief

Reports that Portugal could seek an €80bn EU bailout have put pressure on the euro – boosting sterling.

Lib Dem comments that publicly-funded bankers should not receive bonuses could spook the markets

In the US non-farm payroll figures on Friday were below expectations – rising only 103k against hopes of 159k.

In Depth

EUR

Good morning! Last week sterling hit a high of 1.2066 against the euro on fears that EU politicians might impose bondholder haircuts on investors in European banks. People looking to transfer money abroad can be hopeful that this trend continues this week: this morning rumours are rife that Portugal will request an ECB-IMF bailout package inside weeks.

Portugal could request up to €80 billion from the ECB (European Central Bank) according to reports printed in a German magazine over the weekend. The Portuguese President Anibal Cavaco Silva has denied these reports – but insurance rates for Portuguese bonds (the rate the Portuguese government pay to assure investors) have nonetheless risen to all-time highs of 7.0%.

GBP

Sterling though nonetheless faces some difficult tests this week. This morning for instance Lib Dem Treasury Spokesman Lord Oakeshott has stated that RBS (Royal Bank of Scotland) bosses should not receive bonuses while RBS remains publicly funded. This breaks with comments from Prime Minister David Cameron last week that banks should not be ‘micro-managed’, and could lower market confidence in sterling. In fact sterling has dropped 30 pips against the US dollar and euro this morning – arguably because of these reports.

In addition the markets are anxious concerning the forthcoming interest rate decision from the Bank of England on Thursday. British inflation is soaring at 3.3% right now – far higher than the 2.0% government target. But the fragile state of the economy means Bank of England Governor Mervyn King may be loath to increase interest rates, in case this dampens the recovery.

USD

In the US finally non-farm payroll figures released on Friday fell below expectations. 103k new non-farm jobs were created in December – against expectations they would increase 159k. This has dampened confidence in the US recovery, and the GBPUSD exchange rate rose on the back of this.

Upcoming

The main UK economic release this week will be UK interest rate decision on Thursday. In addition the latest interest rate decision from ECB Chairman Jean-Claude Trichet is also on Thursday.

by Peter Lavelle with specialist currency dealer Pure FX.

Whatever Happened to $1,500 Gold?

By Adam Lass, Senior Editor, WaveStrength Power Signal, taipanpublishinggroup.com

Editor’s Note: On Monday, I mentioned the rise in commodity prices, and I also predicted a bit of a pullback. I said that this might be a good opportunity for investors to look into commodities.

And we sure have seen a bit of a drop today in gold, but as today’s guest editor Adam Lass will tell you, you might not want to close the door on this precious metal just yet.


Over the past few hours, the price of gold has taken a rather magnificent drubbing. As I sit to write to you, the “best investment of the past decade” is down some 3.24% on the year! Of course the year has barely begun, so perhaps announcements of the shiny stuff’s demise are a tad premature.

Let’s review the broad picture for a moment: All during the great tech boom, when companies with business plans scrawled on the back of napkins were king and every corporate lunch room had its own foosball table, gold could be bought for some 25 bucks an ounce. We’re basically talking pretty paperweights here. Bowling trophies.

Then came the first chapter in “the great unraveling,” when the public at large saw for the first time in a generation that it wasn’t “different this time,” history was not over, the naysayers did indeed “get it,” and stupid was indeed stupid.

(I was one of those naysayers back then, a semi-retired micro-cap exec hired by a Baltimore financial publisher specifically to examine the books of some of those “wunderkinds” who were building ladders to the moon. So to a certain extent, I felt quite vindicated when the whole ball of wax melted down. Still, it wasn’t a lot of fun telling folks about how their retirement “savings” were pretty toast.)

You Can’t “Invent” Value

This was the deal back then, and it’s pretty much still the deal today: “Invented” money just doesn’t work.

Back then they tried to get around a paucity of capital by printing their own money in the form of massively proliferating stock shares and screwy backdated stock option plans. The new form of the trick didn’t change a damn thing. In the end it was still too much specie chasing too few real goods. In other words, the classic recipe for massive inflation.

The cycle is by now quite familiar: prices went up, paychecks couldn’t keep up, folks got poor, and the market crashed. Problem is, no one on Wall Street or in Washington has figured out anything different to do since, so we have simply seen the same cycle repeat under fresh new names. So the next time around, it was real estate that drove the bubble, it was still an excess specie-driven bubble never the less.

Your gold investments are under attack by President Obama…

A hidden provision in the 956-page healthcare reform bill could make it dangerous to own physical gold by 2012. But there is one gold investment class that’s safe from the new law — and could make you 12 times more than physical gold over the next 12 months.

Learn more about this gold investment.

A Critical Relationship Turns Tail

But there was one important difference: Now most every wise guy in the biz knew exactly what was going on. This led to a critical reversal in one particular asset. For decades, the price of gold moved contrapuntally to stocks. When they went up, it went down, and when things were scary, folks sold stocks and sought out gold’s safe harbor.

But post the 2000 crash, the price of gold began to move in lockstep with stocks. The wise guys knew damn well how the con worked, so they bought and sold gold in tandem with their share purchases. The end result has been quite well heralded: By the time the dust settled come the end of the most recent boom, crash, boom cycle, the shiny stuff was trading for more than $1,400 an ounce, an amazing increase of some 5,390% over the course of a decade for an “asset” whose chief attribute is that it never changes.

Now it’s easy to forget that this run was not a straight line of any sort. Even during a trending run, the price of gold can hop, skip, dive and pop 5% or 10% as Wall Street attempts to correct its cash and leverage imbalances.

(Investing doesn’t have to be complicated. Sign up for Smart Investing Daily and let editors Jared Levy and Sara Nunnally simplify the stock market for you with their easy-to-understand investment articles.)

Measurable, Predictable…

And when the second leg of the “great unraveling” in 2008 came upon us, when it looked like the entire financial system might collapse in upon itself, the wise guys sold enough of their hoard to drop the price of gold more than 34% an ounce over the course of some seven months.

In other words, this stuff is tradable, if you know how to find the key to its movements and the leverage to convert those intramural moves into viable plays. This is exactly what I set out to do just prior to the winter holidays. And to do it, I asked for a tad of help from this column’s regular contributor, your own Jared Levy.

Now you should know that I am primarily a chart guy, with a particular eye toward broad historical trends. But I saw what looked to my eye to be a rather sweet short-term opportunity brewing in the chart for the Market Vectors Gold Miners ETF (GDX:NYSE).

…And Tradable!

Market Vectors Gold Miners ETF
View larger chart

I bounced this chart off Jared, and here’s what he had to say:

“Looking at the GDX chart above, I have to say that I agree with you here. The current downdraft in gold and the GDX is providing us with a nice entry point into that bullish ascending channel you mapped out.

“In simple terms, a stock or index that is in a bullish trend needs to take breaks from time to time. Those breaks provide us with advantageous entry points.

“The gold miners tend to have an acceleration effect when it comes to the price of gold. They can move much faster and because of that, I wanted to select an option that gives us both value and allows us to participate in as much of that acceleration as possible, while keeping risk low.”

The Right Way to Play

Jared suggested that the readers of my WaveStrength PowerSignal column might benefit from GDX March 57 calls (GDX1119C57) for several reasons:

  • “Time: Even though this may be a shorter-term play, it’s never a bad idea to have more time than you need in an option, there is nothing worse than having your option expire before your trade works out. Also remember that options decay the most in the last three weeks before they expire!
  • “Delta: The delta of the March 57 call is about .68, which means this option will move about 68 cents for every dollar the GDX moves and give us the movement that we want to make profit.
  • “Price: At a current price as I sit to write of $5.20, this call is less than 1/10 the price of the stock, but it has the potential to gain 13% if the GDX only moves up $1. (Please: when you are buying, don’t pay more than $5.30, or it screws up our ratios).”

“With that said, I want us to be prepared to sell the call option if the GDX moves back to around the $62 level. Why $62? While the chart shows the potential for a real home run perhaps as high as 100%, all that skittishness in the master OEX chart puts me into a real “see gains-take gains” frame of mind. At that GDX $62, we can expect to sell the option for about $6.30, yielding conservative traders a 21% return in the trade in a matter of days.”

Market Chaos Ready to Hand You a Potential $1.2 Million… CASH!

Thanks to a hot new niche market, you can turn ongoing market chaos into a seven-figure fortune.

Follow this link to learn more about this options trading strategy.

Snatching 22% From the Dragon’s Mouth

In the end, the play worked out to a “T.” WSP readers were put out 12 days later when these calls reached $6.01 on Dec. 28 for automatic gains of 22%. Over the ensuing days, the exact drop we warned readers of came to pass, with the GDX ripping through its support line at the 50-day average.

Is gold done for? Will the $1,500 dollar-an-ounce mark turn out to be yet another ladder to the moon? Hard to say right now. That abrogation of support may very well indicate that we are in for one of gold’s steeper declines, but I strongly doubt that this is the end of the overall rise.

That won’t happen until those old Keynesian dogs on Washington and Wall Street learn some new tricks.

P.S. Thanks to an explosive new niche market, some smart folks are pocketing staggering gains — as much as $163,000 in a single trade. Act now, and you can get a piece of the action. Follow this link to learn about our new service, WaveStrength PowerSignal.

About the Author

Adam Lass is the Senior Editor of WaveStrength Options Weekly along with Bryan Bottarelli, Editor of the PowerSignal trading service and a regular contributor for free financial market e-letter Taipan Daily. Adam’s fascination with technical analysis started in his early days as a wholesale purchasing manager, when successfully forecasting the public’s future spending habits (using Treasury reports, stock trends, interest rates, even the Farmer’s Almanac) meant the difference between prosperity and failure.

He has been called “one of the most brilliant charting minds in the country.” His deep insight into the economy and value analysis enables him to reliably guide readers through today’s incredibly volatile market in WaveStrength Options Weekly.

Confluence In Forex Trading – What Does It Actually Mean?

By James Woolley

Confluence is a term that is often used in geographical circles, but it is also used when discussing aspects of forex trading as well. In simple terms confluence refers to two things meeting or coming together, and this is commonly used to describe scenarios where two or more technical indicators come together.

So why is this important?

Well you will rarely see it being mentioned in any trading courses or tutorials, but it is important because you often get some very good trading set-ups when a few of these indicators come together. To digress for a second, some traders use this term to describe situations where two indicators give the same signals, for example when both the RSI and Stochastics are above the 80 level and therefore overbought. However I like to use the word confluence in the truest sense of the word to describe situations where two similar indicators come together on the charts.

One example of this would be where you get a situation where there is a key fibonacci level very close to the daily pivot point. One of these indicators alone can often act as a strong support or resistance level, so two together will give you an even stronger level of support or resistance.

Another good example, and one I look for quite a lot in my own trading, is when several moving average indicators come together on the charts. For instance when the 5, 20, 50 and 200 period exponential moving averages come together and are all very close to each other.

When this happens it signals a period of consolidation, but more importantly it signals that there could a big breakout coming in the near future. As soon as the price breaks out of this range and the short-term moving averages start heading higher or lower, you should consider opening a new position in the same direction because you often get some big price moves.

So to sum up, confluence in forex trading often refers to two or more technical indicators coming together. As any good forex course will tell you, successful forex trading is all about finding high probability set-ups, and one of the best signals you can get is when you get multiple moving averages coming together. This is because the end result is that you often get a big breakout when this period of consolidation is over.

However there are lots of other ways you can use confluence to find decent set-ups. This is just one good example that I use myself.

About the Author

Click here for more forex trading tips, and to discover the exact 4 hour trading system that James Woolley uses to trade the markets.

How to Invest in Technology Stocks

Investing In Technology Stocks has been considered high risk since the dotcom bubble burst in the late 1990s. Too few companies back then had a solid business model and were, frankly unaware of how to properly monetise their online presence.

Following the global credit crunch and financial bailouts is it now time to look at this sector again?

At the moment, many technology companies have low levels of debt, strong balance sheets, and good prospects of recurring income. Remember, these companies are selling goods and services people are buying, offering renewed opportunities for investors to grab a stake in their growth.

Both, Apple & Intel have recently beat most profit expectations well ahead of results from 2008.

Technology indices have also done very well with the S&P index for the technology sector rising 58pc since November 2008.

Technology companies are not the same as a decade ago when the share prices rose on false expectations of growth rather than fundamentals. Now there should a reasonable chance that technology stocks will outperform the US stock market over the next three years.

Also tech companies are cash generative, meaning dividends should rise. This is something a new culture among technology companies but it is fast taking hold. Microsoft, Oracle, IBM and Intel are among those that pay dividends.

The average age of personal computers is five years and a replacement cycle is now due which should help a broad range of companies providing both hardware and software.

And Windows 7 is just around the corner. This should trigger significant new investment and benefit a variety of technology stocks.

When the recovery comes, expect technology to continue to be a leading sector. But as ever diversity in your investment portfolio is very important so if you are going to be investing in technology stocks keep the the balance of your portfolio spread with probably no more than 5% invested in tech stocks. A technology investment fund may prove a safer bet.

About the Author

I’m Dave Johansen, co-owner of MicrocapMania.com, a website dedicated to the penny stock trader. See our Microcap Millionaires Review and find out how you can grab two free penny stock picks just by paying us a visit!

Investing Success – A Key Point You Need To Know About Share Prices

By James Woolley

Many people who are very new to stock market investing are extremely naive when it comes to share prices and market valuations. This is perfectly understandable because no-one is an expert right from the start. However you do need to learn certain things before you start investing your money for real.

The point I want to make concerns the actual share price of a company. Some amateur investors automatically assume that a company’s shares are cheap just because their share price is very low. However this is a completely false assumption to make and has no basis of reality at all.

For example they may look at the list of FTSE 100 companies and automatically reject companies such as Rio Tinto and Randgold Resources because they both have very high prices of around 4500p and 5300p. They may instead prefer to look at stocks just as Royal Bank of Scotland and Lloyds, where the share prices are around 40p and 65p, just because they are a lot ‘cheaper’ and have much more potential to rise.

However, as I’ve already said, this is a crazy way of thinking. The truth is that it doesn’t really matter what the actual price per share is. It is the actual valuation that is important.

The valuation of a company is determined by it’s market capitalisation, and this is calculated by the number of shares issued multiplied by the current share price. So you can get a situation where a company with a very low share price can actually be a bigger company with a higher market capitalization than one with a much higher price. Indeed this is the case with Lloyds and Randgold, where the former is around 10 times bigger than the latter despite having a very low price per share.

As an investor you need to look at things like market capitalisation and price/earnings ratios amongst other things. If a company has a very low P/E ratio in relation to all the other companies in the same sector and is expected to grow in future years, then you could argue that it is currently quite cheap. It doesn’t matter at all what the actual share price is.

The point I want to get across is that the price per share could be 5000p or 50p, but the fact is that this doesn’t tell you anything about the company at all. You need to look at the actual earnings figures and the other financial data to start to get a good idea of whether a company is cheap or not. This may sound obvious to many seasoned investors, but you would be amazed how many people make this mistake when they first start investing their own money.

About the Author

Click here to learn how you can build an oversold stocks screener, and to learn all about Level 2 share trading.

Using Fundamental Analysis for Stock Trading

Most traders don’t worry about the fundamentals. These numbers include the general economic and market conditions that impact a stock, as well as the financial information known about a company’s activities and its financial successes and failures.

Instead, traders focus on technical analysis and trends that can be seen using that type of analysis.

Taking the time to analyse the fundamentals of a stock will put you one step ahead of the trading crowd. Using fundamental analysis, you can determine how a stock’s price compares with those of similar companies based on earning growth and other key factors, including business conditions.

When starting a fundamental analysis, select an industry or business sector that interest you for possible stock purchases. If a particular company perks your interest you can start your research by looking at the major players in that company’s sector or by turning to the sector’s fundamentals.

Regardless of how you start, you need to narrow down your list of companies and you want to compare to the ones that are in similar businesses within the sector, so you can find the best opportunity. You also want to be sure the stock trades well by looking at its daily volumes of trades. Stocks with low trading volumes can be hard to get into and out of, making them riskier stocks.

Most of the tools used in fundamental analysis require you to compare at least two companies operating in similar business environments to understand the meaning of the information.

The best way to do that it to compare and understand the company’s financial statements, in particular the critical parts of the income statement, cash flow statements and the balance sheet.

Once you get to grip with a companies fundamentals you can then best decide which companies to invest in. It’s likely you will then want to watch closely for trends to decide when it is best to make an investment.

About the Author

I’m Dave Johansen, co-owner of MicrocapMania.com, a website dedicated to the penny stock trader. See our Microcap Millionaires Review and find out how you can grab two free penny stock picks just by paying us a visit!

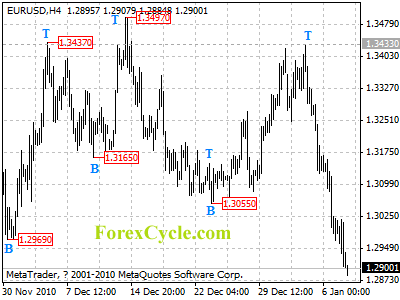
EURUSD’s downward movement extends to 1.2885

EURUSD’s downward movement extends to as low as 1.2885 level. Deeper decline is still possible later today and next target would be at 1.2750 area. Initial resistance is at 1.3025, only break above this level could indicate that minor consolidation of downtrend is underway, then bounce to 1.3100-1.3200 area could be seen.

eurusd

Daily Forex Analysis