Fil-Estate Land (LND) Soared as Alliance Global Buys 50% Stake

fil-estate land, LND, alliance global, AGI, megaworld, Meg, daily stock picks, ron acoba, laidtrades, laid trades, stock market trading

It was a jolly Christmas indeed for the holders of Fil-Estate Land or LND in the Philippine Stock Exchange as its shares zoomed from PHP 1.03 to close 26.09% higher at PHP 1.16 last December 23. News that Alliance Global Group, Inc. (AGI), the holding firm which also owns Megaworld Corporation, is buying 5 billion additional shares at PHP 5 billion in cash sent the LND soaring through the roof. This transaction would increase AGI’s stake in Fil-Estate to 60%. In a report disclosed in the PSE, AGI said that such move is in line with the company’s strategy of investing in tourism projects outside of Metro Manila. Apparently, the company had already disclosed that it will spend about PHP 7 billion in new-tourism developments earlier this month.

Technically, the shares of Fil-Estate appear to have broken out from a cup and handle pattern a couple of days before the new of AGI’s purchase hit the airwaves. But as soon as AGI’s buy-in was served, LND’s stock jumped and even made a bullish gap in the process. So gauging by the height of the cup and handle pattern and projecting it from the point of breakout, it looks like LND’s minimum upside target has already been achieved. But given the recent bullish break away gap, there could still be a lot of room for the LND shares to go higher. Remember that AGI is buying LND’s shares at PHP 1.00 per share so this price level could be seen as a support.

More on LaidTrades.com

Forex daily analysis: 28-12-2010

RISK DISCLAIMER

Forex trading involves high risk. Before any trade, you should consider carefully the investment objectives and the level of risk. The data sent by mail is not necessarily real-time data or precise. Real-Forex is not liable for the losses resulting from the utilization of the data. Real-Forex (Finnocorp Trading Solution Ltd.) is not liable for losses or damages as a result of reliance on the information provided by e-mail or on the overall data, quotes, charts, signals buy / sell. It is hereby clarified that the investor must be aware of risks involved in trading in financial markets, which is a form of investment that may contain potential risks.

EUR/JPY

Daily graph: http://www.real-forex.com/charts-daily/DEC2010/EUR_JPY_DAILY_281210.JPG

Generally speaking, the pair is actually moving aside. However, during the Monday’s session, it stationed around the daily support of 108.46. The bullish engulfing template the pair created suggests a reversing trend for the short term. Given this data, the future trend would be upward oriented, opening an opportunity to go “Long”.

However, this intuition requires a confirmation that may appear on the 1H scaled graph trough the identification of an increasing configuration.

Potential trade

1H graph: http://www.real-forex.com/charts-daily/DEC2010/EUR_JPY_1H_281210.JPG

At the moment the pair will cross the 1H resistance of 109.07, the required configuration should appear, indicating the time to order a potential transaction.

–        “Limit” order on “Long” position 5 pips above the mentioned resistance, meaning: 109.12

–        “Stop Loss” order on the last low appeared: 108.79

–        1st degree of “Take Profit” on the following resistance: 109.62

USD/JPY

Daily graph: http://www.real-forex.com/charts-daily/DEC2010/JPY_DAILY_281210.JPG

As it is standing for the EUR/JPY, the pair is currently moving aside. In order to analyze and detect the actual trend, the RSI indicator, whose purpose is to analyze the strength of the prices, may help to achieve the above goal (actual trending).

According to RSI indications, although the actual graph is moving aside, the “real” trending of the pair is downward oriented. The RSI is preventing a future trend which, in our case, would be a downtrend, suggesting a opportunity to go “Short”. Anyway, the identification of a decreasing configuration on a 1H graph is required to confirm the trend.

In the view of this indicator, the future support the pair should reach would be at 82.03.

Have a profitable week!

Real-Forex team 

Real-Forex team logo

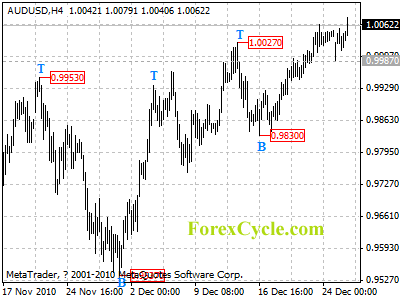
AUDUSD’s upward movement extends to 1.0079

AUDUSD’s upward movement from 0.9830 extends further to as high as 1.0079 level. As long as 0.9987 support holds, uptrend is expected to continue and next target would be at 1.0110 area. On the downside, below 0.9987 will indicate that a cycle top has been formed on 4-hour chart, and the rise from 0.9830 has completed, then the following bearish movement could bring price back to 0.9600-0.9700 area.

audusd

Daily Forex Signals

Silver Outshines Other Metals this Year

By Russell Glaser

Silver prices continue to outperform other commodities as spot silver has appreciated over 70% this year.

For a majority of the year, spot silver prices were relatively flat, never trading below this year’s opening price of $16.83, nor moving higher than $19.80. However, beginning in August, the price of spot silver charged higher to a record price of $30.69.

How can these gains be analyzed?

One school of thought says the gains in the commodities market are a product of a recovery in the global economy. As the economies of the developed nations of world begin to grow, such as the US, Great Britain, China, and Japan, demand for raw materials have increased along with industrial consumption numbers

As more investors have looked to hard assets to provide yield, this has helped to drive up the price of silver. The rise in silver prices coincides with record inflows into ETFs. Investors are looking for new ways to diversify their investments have piled into commodity ETFs in record numbers. The largest silver ETF has booked new investments over $1.1 billion this year alone.

Some of the price appreciation can be attributed to speculators driving up the price of commodities worldwide. Crude oil prices are up 27% with an end of year rally in November and December making up a majority of the gains. Spot gold prices are also up sharply this year gaining 26% on a steady rising trend.

Another reason for the rising price may be inflationary concerns. Following the economic recession, central bankers lowered interest rates around the globe and provided liquidity in mass in order boost economic growth. This has created an environment of ultra-low interest rates that some economists believe interest rates have been held too low and liquidity provisions held in place too long, possibly creating the next asset bubble similar to that of the US housing crisis. The environment of high liquidity and loose monetary policy is reinforced by the Federal Reserve’s decision in October to begin a second round of quantitative easing.

This theory has its merits with the sharp appreciation in the price of and gold and the uncharacteristic rise in the price of spot silver, though technical studies show the price of silver may have further room to move higher.

As such, it may be premature to call a market top. Monthly stochastics shows no sign of diversion and the rising trend line on the daily chart has held since late August and has proven to be a solid support. An initial target for spot silver should be for a retest of the all-time high in early December at the price of $30.69.

Forex Market Analysis provided by ForexYard.

© 2006 by FxYard Ltd

Disclaimer: Trading Foreign Exchange carries a high level of risk and may not be suitable for all investors. There is a possibility that you could sustain a loss of all of your investment and therefore you should not invest money that you cannot afford to lose. You should be aware of all the risks associated with Foreign Exchange trading.

Crude Oil – Bearish Signal

By Russell Glaser

A bearish cross has formed on the daily chart’s slow stochastic oscillator, indicating a sell signal for crude oil. We may expect spot crude oil prices to fall in the near term. Support comes in at $90.75, followed by $89.70.

Forex Market Analysis provided by ForexYard.

© 2006 by FxYard Ltd

Disclaimer: Trading Foreign Exchange carries a high level of risk and may not be suitable for all investors. There is a possibility that you could sustain a loss of all of your investment and therefore you should not invest money that you cannot afford to lose. You should be aware of all the risks associated with Foreign Exchange trading.

Forex Daily Market Commentary

By GCI Forex Research

Fundamental Outlook at 0800 GMT (EDT + 0400)

USD

In a surprise move, China hiked benchmark interest rates by 25bp over the weekend, but the FX reaction during the Asia session overnight was relatively muted. EURUSD traded 1.3073-1.3146, USDJPY 82.76-82.98, and AUDUSD 0.9988-1.0047. Although the US dollar initially strengthened against its Australian counterpart, the gains were eventually surrendered. This does not suggest the AUD has suddenly developed an immunity to policy tightening risks in China; the absence of a stronger reaction probably has much more to do with thin year-end trading conditions. Today, the Dallas Fed’s manufacturing activity index for December is due to kick off a quiet week for US economic data. The consensus expects a very marginal increase over the November print.
JPY

Senior Vice Finance Minister Igarashi said that Japan needs to be cautious about yen movements. These remarks are very much in tune with comments made by Finance Minister Noda on Friday when he said that Japan will take decisive action on FX when needed.
The minutes from BoJ meetings held on Oct 28, and Nov 4-5 showed that “a few” members on the policy board noted that purchases conducted through the new asset purchase program could be front-loaded, or the size of the program could be increased if necessary. There was some obvious concern over the Fed’s decision to embark on another round of quantitative easing, and board members agreed it would be “necessary to pay attention to how this would affect financial and foreign exchange markets”.
“Many members” also felt that careful attention should continue to be paid to the risks that yen appreciation might exert downward pressure on Japan’s economy “by negatively affecting business and household sentiment, in addition to depressing growth in exports and corporate profits”.
Japan approved a record Y92.4 trn budget for the 2011-2012 fiscal year. JGB issuance via regular auctions is also set to hit a record, of Y144.9 trn. Prime Minister Kan warned that fiscal restoration has not gone far enough.
CHF

A Swiss Sunday newspaper reported that the Swiss government is exploring ways to protect exports from the strong CHF. No sources were cited by the article.
In its latest quarterly bulletin, the SNB warned that the worsening debt concerns inside the Eurozone have led to a stronger franc, and this would hurt economic growth in Switzerland. The bank also warned that measures would be taken to counter deflation threats if needed, implying a readiness to intervene.

TECHNICAL OUTLOOK
USDJPY 82.34/00 support zone
EURUSD BEARISH Move below 1.3055/48 support zone would expose 1.2969. Resistance at 1.3360
USDJPY BEARISH Break of 82.84 has exposed 82.34/00, resistance is at 84.51
GBPUSD BEARISH Support zone 1.5297/65 holds while initial resistance at 1.5568
USDCHF BEARISH Support is at 0.9463 key low, a break here would leave little support till 0.9202; initial resistance is at 0.9734
AUDUSD BULLISH Upside potential, break of 1.0091 would expose 1.0183; support lies at 0.9951/18
USDCAD BEARISH Support zone holds at 1.0050/33; initial resistance at 1.0209
EURCHF BEARISH Break of 1.2533/00 support zone exposed 1.2439 ahead of 1.2283; resistance at 1.2714
EURGBP BULLISH Resistance at 0.8553, support at 0.8426
EURJPY BEARISH Pressure on 108.35, a break here exposes 107.86 Fibonacci support. Resistance at 110.82.

Forex Daily Market Commentary provided by GCI Financial Ltd.

GCI Financial Ltd (”GCI”) is a regulated securities and commodities trading firm, specializing in online Foreign Exchange (”Forex”) brokerage. GCI executes billions of dollars per month in foreign exchange transactions alone. In addition to Forex, GCI is a primary market maker in Contracts for Difference (”CFDs”) on shares, indices and futures, and offers one of the fastest growing online CFD trading services. GCI has over 10,000 clients worldwide, including individual traders, institutions, and money managers. GCI provides an advanced, secure, and comprehensive online trading system. Client funds are insured and held in a separate customer account. In addition, GCI Financial Ltd maintains Net Capital in excess of minimum regulatory requirements.

DISCLAIMER: GCI’s Daily Market Commentary is provided for informational purposes only. The information contained in these reports is gathered from reputable news sources and is not intended to be U.S.ed as investment advice. GCI assumes no responsibility or liability from gains or losses incurred by the information herein contained.

USD/CHF Targets All-Time Low

By Yan Petters

The USD/CHF pair saw a sharp drop of 220 pips during last week’s trading session. However, it saw a technical correction just before the weekend, and as a result climbed from the 0.9500 level to as high as the 0.9665 level. Nevertheless, several technical indications are now suggesting that the bearish trend is back on. A new bearish move has a great potential to take the pair to a historical low level of 0.9460.

• The chart below is the USD/CHF 4-hour chart by ForexYard.
• It can be seen that the pair had several failed attempts to breach through the 0.9650 level.
• After failing to cross the 0.9650 level, the pair is now once again showing signs of bearishness, and is currently trading near the 0.9590 level.
• A bearish cross of the Slow Stochastic has taken place above the 80-line recently, strongly suggesting that a downtrend is impending.
• In addition, the RSI fell below the 70-line today, further indicating that a bearish movement should be expected. The last time that the RSI fell below the 70-line has triggered a 400 pip drop.
• The pair’s next support levels are located at the 0.9555, 0.9500 and 0.9460 levels.
• The 0.9460 level is an ALL-TIME LOW. Traders should take under consideration that should the pair reach this low, it can potentially create a psychological affect that will push it down even further.
• The next resistance levels are at: 0.9650, 0.9735 and 0.9790.

Forex Market Analysis provided by ForexYard.

© 2006 by FxYard Ltd

Disclaimer: Trading Foreign Exchange carries a high level of risk and may not be suitable for all investors. There is a possibility that you could sustain a loss of all of your investment and therefore you should not invest money that you cannot afford to lose. You should be aware of all the risks associated with Foreign Exchange trading.
Low Liquidity Leads to Erratic Price Shifts

Source: ForexYard

Markets were relatively muted in overnight trading, as a lack of news events have created a low liquidity environment. Still, there were some erratic price movements to start of the week. The EUR/USD pair once again dropped below the 1.3100 level and the GBP/USD has dropped over 40 pips since last night. Today, traders are warned that even the slightest activity in the market can create huge price shifts, seemingly for no reason.

Economic News

USD – Dollar Ekes Out Small Gains in Slow News Day

The dollar was able to extend its bullish run to start the week off by making gains on virtually all of its major counterparts. While the EUR/USD pair had dropped over 50 pips in overnight trading, it managed to stage a slight correction. Currently the pair is trading around the 1.3100 level. Similarly, the greenback was able to make small gains on both the Japanese yen and Swiss franc.

Whether or not the dollar will be able to prolong its upward trend remains to be seen. The low liquidity environment in the marketplace often times causes dramatic price shifts for seemingly no reason. With very little news scheduled for the day, it is anyone’s guess how the USD will respond.

Turning to the rest of the week, traders will have to wait until Tuesday for the first piece of significant US news. The CB Consumer Confidence figure will provide solid evidence regarding the current state of the US economic recovery. With analysts predicting an increase over last month’s figure, the dollar may find further support in the days ahead.

In addition, a batch of US news on Thursday is likely to impact the market. Both the weekly Unemployment Claims figure and the Pending Home Sales report are certain to generate heavy volatility.

EUR – Euro-Zone Debt Still Concerns Investors

The ability of the euro-zone to combat its debt crisis is still weighing down on the common currency as we start off the week. The euro saw downward movement against both the yen and US dollar in overnight trading, before staging corrections against both currencies. While the markets are very unpredictable at the moment, analysts are warning that all signs are pointing to further bearishness for the euro in the days ahead.

Euro traders will want to pay attention to both US and Asian stock indices this week. There is widespread agreement that any dip in the stock market will likely spurn demand for the safe-haven yen, likely at the expense of the euro. In addition, with no significant euro-zone news forecasted for this week, the currency’s value will likely be determined by external events.

JPY – JPY Likely to Make Gains in Slow News Day

Analysts are predicting the yen to come out on top today, as the combination of a slow news day and persistent euro-zone debt worries may turn investors to the safe-haven currency. There have already been some small signs in overnight trading that the JPY has bullish momentum. The GBP/JPY is already down almost 30 pips from when markets opened for the week. Currently the pair is trading at around the 127.75 level.

Traders will want to pay attention to a batch of Japanese news events scheduled to be released later tonight. In particular, traders will want to keep an eye on the Household Spending and Retail Sales figure, scheduled to be released at 23:30 and 23:50 GMT. With analysts calling for positive figures for both indicators, the yen is likely to see further gains throughout the day.

OIL – Oil Above $91 Once Again

Crude oil dropped some 70 pips in overnight trading before staging a correction. Currently, the commodity is back above $91 a barrel, although analysts are torn about its current direction. On the one hand, the price of oil may drop because of China’s decision to raise a key interest rate over the weekend. China has overtaken the US as the world’s biggest energy consumer, and their interest rate decision was widely seen as a way to slow down economic growth.

On the other hand, this week’s US Crude Oil Inventories are expected to fall, which typically leads to a higher demand for oil while increasing prices. Traders will want to pay attention to oil. Once a clearer trend presents itself, there will likely be an opportunity to enter into positions at a great price.

Technical News

EUR/USD

Virtually every technical indicator shows this pair trading in neutral territory. This includes the Slow Stochastic and Relative Strength Index on both the 8-hour and daily charts. Traders will want to take a wait-and-see approach for the pair today.

GBP/USD

The Relative Strength Index on the daily chart shows this pair currently in oversold territory, indicating that a bullish correction is likely to take place. This theory is supported by the Williams Percent Range on the same chart. Traders will want to go long in their positions today.

USD/JPY

The Slow Stochastic on the daily chart looks like it may form a bullish cross very soon. In addition, the Relative Strength Index on the 8-hour chart is currently in the oversold region. Going long with tight stops may be the preferred strategy today.

USD/CHF

Most technical indicators are showing this pair trading in neutral territory. This is mostly due to the low level of activity in the market place at the moment. Traders are advised to take a wait-and-see approach before opening any new positions today.

The Wild Card

AUD/USD

The Williams Percent Range on the 8-hour chart is currently in overbought territory, indicating a downward correction is likely to take place. In addition, a bearish cross has formed on daily chart’s Slow Stochastic. Forex traders will likely want to go short in their positions today, as there is definite downward pressure for the pair.

Forex Market Analysis provided by ForexYard.

© 2006 by FxYard Ltd

Disclaimer: Trading Foreign Exchange carries a high level of risk and may not be suitable for all investors. There is a possibility that you could sustain a loss of all of your investment and therefore you should not invest money that you cannot afford to lose. You should be aware of all the risks associated with Foreign Exchange trading.
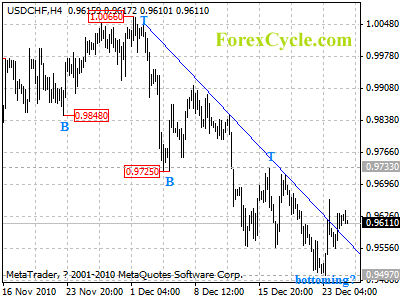
USDCHF rebounded from 0.9497

Being supported by 0.9463 (Oct 14 low), USDCHF rebounded from 0.9497 and broke above the downtrend line on 4-hour chart, suggesting that a cycle bottom is being formed. Further rally towards 0.9733 key resistance is expected, a break above this level will confirm that the downtrend from 1.0066 has completed, then the following upward move could bring price back towards 1.0066 previous high. However, as long as 0.9733 resistance holds, one more fall towards 0.9463 support is still possible.

usdchf

Daily Forex Analysis