Can The Price Of Commodities Influence The Main Share Indices?

By James Woolley

Most casual stock market investors do not pay too much attention to the current price of the various different commodities such as oil, gold and copper, for example. However these current prices can have a major bearing on the value of the main stock market indices.

Just take a look at the FTSE 100 companies, for instance. This is a weighted index meaning that the companies with the largest market capitalisation such as BP, Vodafone, Glaxosmithkline have more of an impact on the value of the FTSE 100 than the smaller ones.

You will see that the company with the highest market capitalisation is BP, whose share price is obviously heavily influenced by the price of crude oil. At the time of writing you also have BHP Billiton, Rio Tinto, Anglo American and Xstrata at 9, 11, 20 and 21 respectively in the list of FTSE 100 companies. These are all mining companies whose share price is determined to a large extent by the price of the various commodities.

At the moment the price of various commodities including copper, gold, lead, nickel and silver are all trading at very high levels on both a yearly and historical basis. As a result the share prices of the major mining companies have been driven higher because they obviously make more money selling these commodities when the price is higher.

The knock-on effect of this is that the FTSE 100, which includes many of these mining companies, and indeed is heavily influenced by them because they all have significant market capitalisation values, has been driven higher as a result of this. At the time of writing you have mining stocks attempting to make new highs, and the FTSE 100 close to making new highs as well.

If commodity prices were to drop sharply, you would undoubtedly see the value of both the individual mining stocks and the FTSE 100 as a whole fall sharply as well because they are very closely correlated.

So the point I want to get across in this article is that it is very important that you keep your eye on commodity prices because they have a major impact on the main stock market indices. When commodity prices are high, the main stock market will also generally be trading at high levels as well, whilst the reverse is true when commodity prices are at very low levels. For long term investors the bargains are to be had when commodity prices are low, but that seems a long way off at the moment.

About the Author

Click here to read a review of Stock Trading Nitty Gritty, the new training course that teaches you how to successfully trade individual stocks.
Foreign Currency Investment Tuition

By Jeffrey Johnson

Stepping into the foreign currency trading world could be a bit of a conundrum. You want to use the cash you might have put aside for max effect. And of course, everyone seems to be telling you that to keep away from crashing and burning, you want training, possibly take up some forex classes.

But forex lessons cost money and if you occur to spend too much time getting educated up, you’ll find your cash dribbling away. How do you get away of this cycle and start making your money give you the outcomes you want?

Effectively, the reply is simple and it lies inside you – you need patience and a long run strategy; each attributes that may in the end serve you nicely in your foreign exchange trading.

However first it is advisable apply these in your search for the best forex lessons, taking that massive pile of potential merchandise and whittling them down to only the best. Get the suitable coaching, tightly targeted in your needs and also you’ll be as much as foreign forex trading properly in no time – with most of your money nonetheless intact.

Persistence is vital here, as a result of it’s something of a jungle on the market within the foreign exchange coaching world. Most of the service business surrounding forex is unregulated, with no over-arching professional bodies, or accreditation. That is a recipe for the mediocre and deceptive to thrive, offering unsuitable, or irrelevant forex lessons, that simply line their very own pockets.

What you want is a option to discriminate the nice from the bad and ugly: a strategy to cut through the scams and untrustworthy online coaching distributors on the market and discover a residence to your money that will get you properly trained. There is a approach to do that, instead of wading through the refuse and clutter of the web search pages, hoping to spot the foreign exchange classes for you. Discuss to those who have been there and finished that, already.

Those persons are readily available and greater than willing to help; on-line foreign currency trading web boards cater for all capabilities and experience of forex trader. So get yourself registered, get online, and start getting to know the fellows which can be out there and making it work for them. Take heed to what they have to say and take a look at their recommendations with searches on foreign exchange training assessment websites.

If both merchants and impartial websites are pointing to explicit suppliers of forex classes as being those to look out for, that’s when it’s greatest to verify them out in more detail.

Ensure they are backed by a correct company, ask questions, discover out concerning the stage of support and course content. If these tick all the precise packing containers, your initial quest is over; sign up, practice up, then get out there.

Sid is a well revered and moneymaking foreign exchange dealer who contributes to the Forex Classes site

About the Author

Syd is a well respected and lucrative foreign exchange trader who operates the Forex Training web page

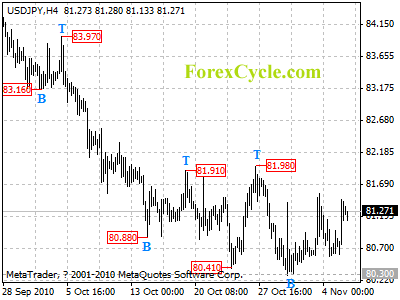
USDJPY moved sideways in a range between 80.30 and 81.98

USDJPY moved sideways in a range between 80.30 and 81.98 for several weeks. Lengthier consolidation in the rang is still possible in a couple of days. As long as 81.98 resistance holds, we’d expect downtrend to resume and another fall towards 79.75 (1995 low) is still possible, and a break below 80.55 could signal resumption of downtrend. Key resistance is at 81.98, above this level will indicate that the downtrend from 85.92 (Sep 17 high) has completed at 80.30 already, then the following upward move could bring price back to 83.00-84.00 area.

usdjpy

Daily Forex Analysis

Day Trading and Net Operating Losses

By Markus Heitkoetter

Our goal as day traders is to make money, not to lose it. However, when we do have losses, and we all will no matter how successful we usually are, there are ways to make those losses less costly. One way is simply to learn from the knowledge we gain from an error or a losing strategy. But there is another, more concrete way to soften the blow from trading losses, and it’s something every trader needs to know about come tax time: “Net Operating Losses.”

In its simplest form, the concept of net operating losses is a part of the tax code that allows you to deduct your businesses expenses, including trading losses, from your income. Specifically, net operating losses are comprised of your ordinary trading losses and trading business expenses, like coaching tuitions, software and data subscriptions, books and magazine subscriptions and many more. You can claim a net operating loss any time you can show that tax-deductible losses exceeded taxable income for a given year. The reasoning behind this part of the tax code is that, if you are taxed during a profitable period without getting any tax relief (e.g. a refund), you might have to pay an unbalanced amount of taxes. Net operating losses allow you to spread that tax burden out.

The most useful part of this concept for most traders is that net operating losses may be carried back two tax years and/or 20 years forward. Furthermore, you can use them to offset any type of income in prior or future years, whether that income is connected to trading or not, and even if you were not trading at the time. In practice, this means, that, for example, if your wife has a job earning a regular income (and you file jointly), you could deduct your net operating losses from your wife’s income and possibly save thousands of dollars in taxes. Or, again, if you have a bad year but expect to earn more income in the future because of an expected increase in regular income, you can wait and deduct your losses later, paying more taxes now but saving even more after. The most useful aspect of this concept is its flexibility, as you can see.

Now, none of this is supposed to suggest that we can gain back all that we lose by manipulating the tax code. Net operating losses are not a magic loophole. Instead, they are designed to help spread the burden of losses around, allowing small businesses and independent traders in particular not to suffer from taxes and losses at the same time. I also don’t want to suggest that we no longer have to worry about trading losses; they’re an inevitable part of what we do. But being a bit more knowledgeable about how to report losses with your taxes can soften the blow of this inevitable part of our business.

Finally, please understand that I am not a tax professional, and you should consult with an accountant or tax specialist to take full advantage of all the wonderful things you might do if you qualify for trader tax status. But the notion of net operating losses should always stay in the back of your mind when reporting your losses.

About the Author

Markus Heitkoetter is the author of the international bestseller “The Complete Guide To Day Trading” and a professional day trading coach. For more free information on day trading visit his website http://www.rockwelltrading.com

SPX’s Running Correction, Gold’s Setup, Oil Explodes!

By Chris Vermeulen, GoldandOilGuy.com

The financial markets continue to climb the wall of worry on the back of more Fed Quantitative Easing. Those trying to pick a top in this choppy bull market may prove to be correct for a couple hours but over time the shorts continue to get clobbered.

Quantitative easing was enough to turn gold back up and gave oil just enough of a nudge to breakout of its cup and handle pattern explained later.

The past few weeks the number of emails I receive on a daily basis about what individuals should do about short positions they took on their own has growing quickly. Usually when my inbox starts to fill up with traders holding heavy losses trying to pick a top I know something big is about to happen and its not going to be in the favor of the herd (everyone shorting). In the past couple week there have been some great entry points for the broad market whether its to buy the SP500, Dow, NASDAQ or Russell 2K. I focus on trading with the trend and entering on extreme sentiment readings as shown in the chart below.

Extreme Trend Trading Analysis

Below are my main market sentiment indicators for helping to time short term tops and bottoms. That being said I don’t pick short term tops in hopes to profit on the down side. Rather I wait for a extreme sentiment bottom to be put in place, then enter long with the up trend (Buy Low).

Once there is a 1-2% surge in price and sentiment indicators are showing a short term top I like to pull a little money off the table to lock in some profits while still holding a core position (Sell High). This is exactly what I/subscribers have done over the last couple weeks. This is a simple yet highly effective strategy and works just as well in a down trend except I focus on shorting extreme sentiment bounces. Subscribers know what these indicators are as I cover them each week in my daily pre-market trading videos as we prepare for the day ahead.

SPX Running Correction

Since early September the equities market has been on fire. In late September the market was extremely toppy looking and trading at key resistance levels from prior highs convincing a lot of traders to take a short position. But instead of a correction the market surged and has since continued to grind its way up week after week.

This rising choppy price action can be seen two ways:
1. As a rising wedge with a blow off top (Bearish)
2. Or as a Running Consolidation (Bullish)

The running consolidation happens when buyers are abundant picking up more shares on every little dip. Overall looking at the intraday price action you will see market shakeouts as it tries to buck traders out before it continues higher. This choppy looking market action if not read correctly looks extremely bearish to the novice trader and the fact the market is so overbought it easily convinces them to take short positions. This choppy action is just enough to wash the market of weak positions before starting another run up.

All that said, both a blow off rising wedge and a running correction are very bullish patterns for a period of time. Again I cannot state it enough, trade with the trend and the key moving averages.

Gold Shines On The Daily Chart

The gold story is straight forward really… Trend is up, quantitative easing is back in action and that is helping to list gold and silver prices. Key moving averages have turned back up and gold closed at a new high which shows strength.

Golden Rocket

With another round of quantitative easing just starting and gold making another new high last week there is a very good chance gold stocks will rocket higher in the coming 8 months. I have been following Millrock Resources Inc. because of the team involved with this company. A breakout to the upside here could post some exciting gains if you take a look at the chart and see where the majority of volume has traded over the years along with the bullish chart patterns (Cup & Handle/Rising Wedge) with strong confirming volume. From 84 cents to the $3.50 area there should not be many sellers other than traders slowing taking profits on the way up.

Crude Oil Breaks Out Of Cup

Crude oil has been dormant the past few weeks even though the US Dollar has plummeted. But last week’s news on more QE was enough to send oil higher. The surge took oil prices straight to the 2010 highs as expected and blew past my first target of $86.00 per barrel. I figure it will consolidate here for a while until we see if the dollar bottomed last week or is just testing the breakdown level.

Weekend Trading Conclusion:

In short, the market has played out exactly as we planned and all four of our positions are deep in the money. As we all know the market goes in waves in both price and for trade setups. The past couple weeks were great for getting into trades and now the market is running in our direction. It will take a few days for the market to stabilize (pullback or pause) before we could get anther round of trade setups. Keep position sizes small as the market remains overbought and a sharp correction could happen at any time. Until then, keep trading with the trend.

Disclaimer: I own shares of SPY and MRO.V

Get My Daily Pre-Market Trading Videos, Daily Updates & Trade Alerts Here: www.TheGoldAndOilGuy.com

Chris Vermeulen

Learn Forex: Forex Analysis – 7th November 2010

By forex-fxtrader.com

Analysis of Weekly Charts

After 2 weeks we have now grown the account 2% from low risk trades placed at market open (1% maximum risk per trade). Last week I pointed out that we still have to pay attention to major scheduled news. I specifically said to close all pending orders prior to FOMC news as bad $ news would probably mean that old existing support & resistance areas could be smashed.

The Aud was a perfect example of what I said. Price smashed straight through the huge area of 1.000 & kept going.

The other important thing to be aware of is this. If you do decide to leave trades running through major news, make sure that you only have one trade per currency and or correlated pair. For example do not have 2 trades that are directly related to the $USA, if one loses they both lose.

Similarly do not be in two correlated pairs at the same time. A long on the Euro/$ is almost identical to a short on the $/Chf as they go in opposite directions most of the time.

Gbp/$

Price broke and closed above 1.6000. We then look for a pullback to 1.6010 with a view to a long. Stop @ 1.5945I will do my usual method of taking 50% profit at 1.6100, stop to entry and balance to run, overall target 1.6240.Half stake short 1.6685 stop at 1.6755 Target 1.6255, stop to entry after 100 pips and profit taking along the way.
Euro/$Last year the Euro tanked around this time. The Euro woes have not gone away & Greek & Irish problems could resurface this week. Even though price has closed above 1-4000 I have a “gut feeling” that this may fall down . However I will trade what the charts, not my gut tells me JI see more opportunities on the daily charts as shown in the second video, but weekly the areas to consider for me are:Looking to short at 1.4360 half stake, stop at 1.4525 target 1.4010

Daily: Longs around 1.3830

Chf/$Worked perfectly last week for overall 300 pip move. I am only interested to short. 0.9920 is the area for me with my stop above last weeks high, so 0.9980 & 0.9610 my target again. There is a counter trend opportunity to long at 0.9470 area but not for me
$/YenOnly interested in shorting: Main area is 82.90 Stop at 83.55, stop to entry at 82.10 balance to run. Target 81.10
Aud/$Keep watching gold for clues it made new highs last week. Price smashed through 1.000 last week. A 50% fib  pullback of last weeks candle is spookily at  0.99980 to support the move. I will split the long trade in half. long at 1.10010 with a stop at 0.9945. Target 1.0145.2nd part long at 1.0010 stop at 0.9885, target open (for now). This is in case the first part loses. I could not decide which was the best stop.
Aud/jpyClosed and broke above 81.35 where I will look for a pullback entry.Long 81.40 Stop 80.80 Target 83.2084.20 short 78.6 fib and weekly 200 where I will put my stop above 85.00
Euro/GbpOnly interested to short. Maybe better trading from daily charts as this is not clear.Order to Short at 0.8730 stop 0.8785 and 1st target 0.8615. Scale out. Stop to entry, balance to run.Counter trenders will look for longs at 0.8600 (not me)
Euro/YenMore of a daily move, messy on weekly.Yes will long at 112.20 Stop 111.40 1st Target 113.90Stop to entry, 50% profit balance to run for 114.45

I will look to short around 115.50. Stop 116.15. Stop to entry 100 pips and Target 113.60

Cad

Only Looking to short. Weekly 1.0180 Stop at 1.0235 Stop to entry at 100 pips. Counter trenders will look to long (not for me) at 1.000 area.

Two Methods To Analyze Financial Markets

By Daniel Shaw

There are two main methods used by investors to predict the movements of the prices in the financial markets: financial and technical. The financial analysis method is based on the economical and political events of the countries. This method has a global and outside overview of the situation that causes the certain changes and movements of the financial markets.

Due to high competition between the traders in the financial markets, for the last few years investors are forced to turn to the technical analysis. This method is based on such techniques as a construction of candle charts, trend lines, analyzing the historical prices and movements and trying to predict the future direction by searching for the certain graphs patters in the charts.

According to the recent researches of the leading world experts of the technical analysis, the interest in technical analysis increased for the last few years due to the high number of big investors in Asian markets. These markets are too complex and as fundamental analysis is misleading and doesn’t supply investors with enough information about the financial markets, the Asian investors tend to use the technical analysis more often. The results of the traditional fundamental analysis and technical charting on Asian markets are very different.

Thus more and more investors are concentrating on the technical analysis of the financial markets rather than the fundamental one. But fundamental analysis also has found its place. Now it is mostly applied to analyze marginal revenue, industry trends, etc. Technical analysis gives the traders more detailed information about the market’s direction and involves the use of levels and patters in the graphs. Traders who use the technical analysis know how to interpret the market psychology by using its visual display on the charts.

As the world economy experiences many changes it becomes very difficult to predict the movement of the financial markets. That’s why the expert of markets analysis try to combine technical and fundamental analysis and decrease the differences between them.

There is nothing new in a wish to predict the future prices on Forex market. Even one hundred years ago traders used the technical analysis for the Asian markets trying to predict the prices for rice. Today we have a lot of different techniques and strategies for the technical analysis: Fibonacci levels, Elliot Waves, etc. Thought there is no single strategy that can guarantee you high level of probability. That’s why the opinions of the traders are very different as well. Some of them believe in technical analysis, some of them focus only on the fundamental analysis, some do both.

According to the recent researches, technical analysis is gaining its popularity. Most of the financial market’s studies are based on the candlestick charts, pins, tweezers, saucers and other terms that are specific for the technical method of markets analysis. In order to understand the laws that move the market, most traders will always refer to charts, formulas and indicators that reflect the market’s psychology and directions. Whatever method is dominant, the proponents of fundamental and technical methods will always blame each other for mistakes that they made in their own forecasts.

About the Author

Liked this article? Visit our website Singapore Forex to find the answers on most of your Forex trading questions and review the most popular Singapore Brokers.

PIP’s FOREX – What Exactly Is It?

By Cedric Welsch

Consumers often have many questions about the securities markets that can be ambiguous such as what is PIPs FOREX. With a little explanation however the mystery behind these terms can easily be uncovered. The same can be said about the FOREX market or currency exchange market and its different acronyms. For example one might have the question what is PIP’s FOREX? The following article will shed some light on what these terms are and how they are used in the currency markets.

The answer to what is PIPs FOREX literally defined refers to Percentage in Point’s Foreign Exchange. Yet this definition does nothing if not confuse you further. Let’s start with the FOREX market in general and some general concepts behind what it is and does. The foreign exchange market is a market where the currencies of the world are exchanged. The FOREX market is what is called an over the counter market meaning that there is no central exchange or entity governing transactions like the New York Stock Exchange governs stock and other securities transactions. Participants in this market include countries, central banks, speculators, commercial businesses, and smaller investors. There are different tiers or levels of the exchange market in which these investors participate. A common strategy for generating profits in this market is to borrow low yielding currencies and lend or invest in high yielding currencies.

Now let’s move on to what percentage in point actually means. When currencies are traded on the exchange, there are bid prices and offered prices. These prices may go by different terms however the process is still the same. When prices are quoted, they are done so to the fourth decimal point. For example if the American dollar’s price was quoted it may look something like 1.1479. This is true for all currencies with the exception of the Japanese Yen which is only quoted at two decimal places. Percentage in Point describes the gap, if any in the bid and offered prices. For example if the dollar was quoted at 1.1479 and the bid was 1.1475, we see that the spread is 4 pips wide.

As you can see, once the term is explained with a little background, it becomes much easier to understand. Most concepts of the market are fairly simple however weird terms and acronyms are applied that is not so simple. Knowing a little about what a particular market is and what it does can help answer burning questions. Now at long last you have your answer to what is PIPs FOREX.

About the Author

Do you want to really make profits with forex? Make sure you get fresh updates ahead of everybody else here: Forex News Trading

Also, you need to know how to read and analyze the trading market well. Learn Currency News Fx

7 Habits of Highly Effective Forex Trading

Big amounts of money can be made in the Forex markets. While profits are definitely there for the taking, I wrote this article to help you learn how to maintain the highly effective habits of forex trading. Improving these habits will lead you to overall success quicker then any winning trading system.

1. Patience

…Trading for the excitement, not the profit.

The standard life in a Forex trading is between 5 minutes and 9 months. Not all traders in Forex Trading trade because they want to make money. Many trade because they want the action. Reflect on it – you must trade everyday, or can you patiently wait for higher probability trades, even if it staying Flat for 2 to 3 days or even a week?

For those of you who wish to learn how to make money in the Forex markets, rest assured you can. However do not expect to make money in each and every trade. If you concentrate on not breaking the 7 Habits of Highly Effective Forex Trading, you have a greater opportunity of making money over a period of time.

indeed you will have losing trades. Unquestionably the markets will do the unexpected and at times you will lose more than you expected; but if you persevering avoid making these habits you must make money.

In trading Forex, it has been my rationality and helping new and seasoned traders, that the lack of self-discipline is the distinguished cause of losses. You need self-discipline to follow your trade plan; to be patient; to take losses… and profits! And, to practice sound money management.

3. No To Fear and Greed

With the incredible leverage Forex trading offers, you are commonly exposed to the basic character of fear and greed. At certain times throughout your trading career these emotions can make you completely and positively irrational, oblivious to what is really happening. It can make you rely on hope; hope that the market will do what you want it to do because it “must”! Otherwise, you will lose all of your trading capital.

4. Success

Each time I ignore the habits of a forex trading, I aspired myself that I would not recall the same mistake, but as I was once again successful, as I gained money, I potentially became overconfident, sloppy, and “dangerous”. You are most likely to make these same habit when you are making money, not losing it. After several losses, you naturally tighten your discipline and become more conservative, or lose your trading account. After several losses you are likely to lose the least amount of money on a trade. 5. Overconfidence

It is following a string of profitable trades that you are most likely to lose large amounts of money. If you invested trading with a $5,000 account and limited yourself to a maximum 3% risk, you could lose a maximum of $150 per trade. With profits increasing your account to $10,000, you can now lose $300 per trade. Worse yet, flushed with success you are more prone to break your rules and “wait a day”, when you should have been stopped out.

When I was a new Forex trader, I found that some of my largest losses have occurred from my smallest positions. After making large profits, I let these small positions run into extremely large losses because I was overconfident.

6. Balance

Trading Forex is a game of psychology. It is a game of balance. Emotional extremes create an imbalance. In your journey to make money, you will make mistakes of greed. In your reluctance to take a loss, you will make mistakes of fear. The tremendous emotional release you will feel when you ultimately close out a large losing position is astonishing. You will fight the market, yet know it will to go against you, but wanting it to go in you favor – hoping for it, worrying about it, praying for it. After a few hours or a few days of that, it will feel as though the weight of the world is taken off your shoulders when you finally take the loss.

7. Hope

One of the early signs that you have made a serious mistake is when you change your system and begin to tell your spouse and friends the”reasons” for the market to go your way. Or, registering the internet looking for those taking your same level, asking your Forex broker what he thinks you should do; hoping that some government action will grasp you out. This is not Forex trading; it is hope. Hope is the most devastating of all emotions in trading the Forex markets because it can plug you into complacency. You know when you find yourself hoping, that you are wrong, and should immediately get out of the market, but it takes an unusual amount of self-discipline to take that very large loss. Once you’re able to digest the highly effective habits of forex trading, I’ve outlined above, your odds of making money are be greatly increased.

About the Author

Steven M. Matrix has been a trader for 23+ years and manages two funds at Green Rock capital in addition to running http://fxcoaching.com/ where he provides his trade signals based on the award winning http://superadx.com/ along with the exact education needed for successful trading on your own.

Forex Currency Exchange Pivot Points

By James McKee

Pivot points are a vital tool in the trader’s arsenal and can be a real “light in the dark” when you are seeking insight into a possible trade. Before attempting to utilize pivot points however you must have a good grasp of support and resistance levels. Support levels are points at which price decline is continually rejected, and Resistance levels are points at which a price increase is continually rejected. When considering both the support and resistance levels together this is called examining a channel, typically price trends will rise and fall within the channel for hours or days at a time.

Utilizing support and resistance when trading is typically accomplished by waiting until after a resistance level has been pushed but not broken a few times. This enables the trader to determine the likely behavior of the pair in the near future and determine the best point at which to enter a trade. The absolute best place to enter a trade is at the bottom of a bearish candle. Pivot points are ultimately a series of support and resistance points identified on a chart. Understanding how to determine which pivot points are relevant to your trading strategy is key to making a profit.

Of course this is one of those tools that is useless without a proper stop loss and take profit figure to correspond with the amount of risk you are willing to take. No strategy is full-proof but identifying, marking and utilizing pivot points will allow you to make an informed decision with regard to where you enter a trade. Making a mistake such as those made without being properly informed can be very costly. Stay informed and utilize every tool at your disposal, we do not trade for excitement…we trade for profit. Keep these things in mind the next time you go to enter a trade!

About the Author

Author is a Forex trader and financial analyst residing in Denver, Colorado. To stay up to date on all the latest developments in the financial world and beyond be sure to check out the forex exchange rates regularly.