Forex Daily Market Commentary

By GCI Forex Research

Fundamental Outlook at 0800 GMT (EDT + 0400)

USD

The dollar strengthened further against the euro during the Asia session amid intensifying concern over ongoing debt problems in Ireland. Gains were also made against the NZD but this was largely due to news that kiwi fruit imports to the US have been halted, rather than indicating a broader risk-off move spreading from the Eurozone. EURUSD traded 1.3837-1.3950, USDJPY 80.74-81.25. Asian and US equities were slightly weaker. The Fed’s October Senior Loan Officer Opinion Survey showed that banks continue to ease lending standards in many categories.
Banks also reported falling demand by both large and small businesses for some loan categories. It appears, however, that there was a bit of a turnaround in mortgage standards, with 9% of banks, on net, tightening on prime mortgages, versus 5% easing in the prior quarter. St. Louis Fed President Bullard, a current FOMC voter, said that the benefits of further quantitative easing will outweigh the costs and that the full effect of the further QE will be felt in 6 months. Dallas Fed President Fisher, who is a voter in 2011, noted that QE2 may be the “wrong medicine” and that it was “risky business.” Echoing the tone in his WSJ op-ed, Fed Governor Warsh spoke and said that asset purchases may fail to benefit the economy and that expanding the Fed’s balance sheet “was not a free option”.
EUR

Rising credit spreads on Irish debt have started to weigh on the euro. The Irish government has presented a plan, which intends to introduce austerity measures totaling EUR6 bn for 2011. EU Commissioner Rehn and Irish Finance Minister Lenihan held a press conference at which Rehn endorsed the austerity measures for 2011. Rehn also said Ireland has not requested financial backstops and that it would benefit Ireland if there was broad cross-party support for the budget measures. Seeking to distance Greece from the situation in Ireland, Greece’s Finance Minister Papaconstantinou said that “Greece is not Ireland” given that Greece “doesn’t have banking stability problems”.
The ECB settled €711 mn worth of Eurozone bond purchases last week, after a three-week absence from the market.
German data was mixed, with slight falls in industrial production accompanying some strong trade data. German exports grew by +3.0% in September versus expectations of +1.5%, suggesting that economic growth and macro fundamentals remain strong in Europe’s largest economy. A larger-than-anticipated decline in imports of 1.5% helped widen the trade balance to the largest level in nearly two years, providing further evidence that Germany will remain hostile to US Treasury Secretary Geithner’s current account target proposal, heading into the G20 Summit on Wednesday. Industrial production for September surprisingly fell by 0.8% m/m (vs. consensus of +0.4%) and increased 7.9% y/y (vs. consensus of 9.5%).
GBP

The RICS house price balance was much worse than expected, providing further evidence of an acceleration in UK house price declines. The reading was -49% in October (cons. -39%, prev. -36%).
AUD

Treasurer Swan said that the strong AUD does have a “significant impact” on government revenue, which is very much in tune with yesterday’s comments by Prime Minister Gillard. However, he declined to offer a view on the future direction of the currency.

TECHNICAL OUTLOOK

USDCAD pressure on 0.9981.
EURUSD NEUTRAL While support at 1.3698 holds, expect gains to target 1.4373 ahead of 1.4579.
USDJPY BEARISH Stalled above 79.75; little support below this till 77.91. Resistance at 81.99.
GBPUSD BULLISH Momentum is positive; expect recovery towards 1.6379 with scope for 1.6458 next. Support comes in at 1.5961 ahead of 1.5651.
USDCHF BEARISH Break below 0.9463 would open up the way towards 0.9225. Upside capped at 0.9972.
AUDUSD BULLISH Upside pressure found resistance at 1.0183 ahead of 1.0222. Support at 0.9891 ahead of 0.9542 reaction low.
USDCAD BEARISH Bearish pressure on 0.9981; a break here would expose 0.9820 next. Resistance at 1.0156.
EURCHF NEUTRAL 1.3834 and 1.3265 mark the near-term directional triggers.
EURGBP BEARISH Next support below 0.8542 lies at 0.8463. Resistance at 0.8692 ahead of 0.8818.
EURJPY NEUTRAL While 115.68 continues to cap the upside, support lies at 111.53 ahead of 107.73.

Forex Daily Market Commentary provided by GCI Financial Ltd.

GCI Financial Ltd (”GCI”) is a regulated securities and commodities trading firm, specializing in online Foreign Exchange (”Forex”) brokerage. GCI executes billions of dollars per month in foreign exchange transactions alone. In addition to Forex, GCI is a primary market maker in Contracts for Difference (”CFDs”) on shares, indices and futures, and offers one of the fastest growing online CFD trading services. GCI has over 10,000 clients worldwide, including individual traders, institutions, and money managers. GCI provides an advanced, secure, and comprehensive online trading system. Client funds are insured and held in a separate customer account. In addition, GCI Financial Ltd maintains Net Capital in excess of minimum regulatory requirements.

DISCLAIMER: GCI’s Daily Market Commentary is provided for informational purposes only. The information contained in these reports is gathered from reputable news sources and is not intended to be U.S.ed as investment advice. GCI assumes no responsibility or liability from gains or losses incurred by the information herein contained.

European Debt Concerns Drag EUR, Equities Lower

Source: ForexYard

The debt concerns to arise from the euro zone over the past few trading days has put some downward pressure on the 16-nation single currency and reduced demand for other high-yielding investments. After Ireland opened its books to the European Union, worries began to grow that some governments throughout the region may struggle to pay off debts; this in turn has dampened demand for the region’s assets.

Economic News

USD – US Dollar Gaining Ground as EUR Dips from Debt Woes

The US dollar appears to still be gaining ground this week on last Friday’s optimistic Non-Farm Payroll data. With a surge in employment rearing its head at such a crucial point for the USD; it appears now like the greenback is beginning to regain some much needed support.

Against the EUR, the buck has been performing better than against most other currencies. The EUR/USD cross fell from its recent high around 1.4270 to now sit just below 1.3960. Against the British pound, the dollar also gained roughly 150 pips to trade near the 1.6140 mark. The USD/JPY also saw a minor boost Friday as the pair jumped to as high as 81.49 before coming back down somewhat and finding stability in yesterday’s market near the 81.00 price level.

The US dollar will be strangely absent from the economic calendar today with most market news centering on Britain. The UK will publish two impacting reports: manufacturing production and the British trade balance figures.

On the other hand, the US IBD/TIPP Economic Optimism gauge will be published today and may show some movement towards an optimistic reading. Above the 50.0 line on this report represents market optimism, below represents pessimism. The forecast is for a continuation of the pessimism of previous readings, but after last week’s NFP data, there is a chance that this figure could read higher than expected and drive the USD slightly higher.

EUR – Irish Debt Concerns Weigh on EUR Strength

The debt concerns to arise from the euro zone over the past few trading days has put some downward pressure on the 16-nation single currency. After Ireland opened its books to the European Union, worries began to grow that some governments throughout the region will struggle to pay off some debts, which have dampened demand for the region’s assets.

The EUR fell against the US dollar to recent low of 1.3940 as of this morning. The euro zone currency doesn’t seem to be fairing too well against other major currencies either. The EUR/JPY fell as much as 1.2% to trade near 112.00, while the EUR/GBP declined towards the 0.8600 price mark, which it reached earlier this morning.

With only a handful of minor news events expected from the euro zone today, there is little chance the currency will find support in today’s trading. However, Britain will be publishing its measure of manufacturing output today at 9:30 GMT and may end up adding support for a stable pound.

JPY – Has the Japanese Yen Peaked?

Japanese stock indices experienced rapid growth yesterday as the yen finally began to weaken against the US dollar. Following the Federal Reserve’s announcement to implement the quantitative easing program, known as QE2, the lagging market began to pick up momentum. The boost in confidence for riskier assets helped to put much-needed sell pressure on the yen.

The USD/JPY climbed towards 81.50, a price not seen for over a week, but appears to be correcting downward somewhat as of this morning. Outlook for the yen remains bearish as Japanese equities gain in value. The Nikkei 225, which had been lagging behind other equities on concerns over the strengthening yen’s impact on exports, was trading roughly 1.1% higher yesterday, outpacing most of its counterparts. If QE2 has the positive effects expected, we could be seeing the beginning of a turning point for the yen.

Crude Oil – If USD Recovers Resulting from QE2, Oil Prices Should Fall

Crude Oil prices appear to have stabilized in a range-trading pattern between $86.00 and $87.50 a barrel. Rising demand from China may have had a hand in oil’s recent rises, but a wider global recovery has created the conditions for a steadily climbing price of crude.

However, Saudi Oil Minister Ali al-Naimi stated in Singapore recently that oil prices appear to have found their comfort zone between $70 and $90 per barrel. If the US dollar becomes resurgent as the EUR falls, then chances are we could see a diminished price of oil in the coming trading days. Depending on the length and duration of the USD’s short-term recovery, oil prices could fall to as low as $80 a barrel over the course of this week.

Technical News

EUR/USD

The price of this pair appears to have recently entered the over-bought region on the weekly RSI, suggesting impending sell pressure. A recent bearish cross on the weekly Stochastic (slow) and daily MACD both support this notion. Going short may turn out to be a wise choice on this pair today.

GBP/USD

A fresh bearish cross on the daily Stochastic (slow) seems to suggest that a downward corrective move is imminent. An impending bearish cross on the daily MACD adds weight to this assessment. Going short with tight stops appears preferable.

USD/JPY

There appear to be a series of bullish crosses on the daily MACD, highlighting an increase in buy pressure on this pair. A fresh bullish cross on the weekly Stochastic (slow) supports this notion. Today’s preferred strategy may see this pair turning a corner with a recommendation for going long.

USD/CHF

This pair appears to be testing a significant support level at 0.9650. With the price in the over-sold region of the weekly RSI, and a fresh bullish cross on the daily Stochastic (slow), indicators appear to suggest that a breach of this support line will likely not occur today. Going long on the bounce may be a smart tactic today.

The Wild Card

Gold

Gold prices shot up to record highs recently, peaking over $1,410 an ounce. However, this unnaturally sharp spike has pushed most technical indicators into a corrective posture. The price is over-bought on the daily and weekly RSI, while there appear to be fresh bearish crosses on the daily and weekly Stochastic (slow) and MACD. Forex traders have a chance to capture this downward correction at its peak, granting the unique opportunity to make healthy profits with short intraday trades.

Forex Market Analysis provided by ForexYard.

© 2006 by FxYard Ltd

Disclaimer: Trading Foreign Exchange carries a high level of risk and may not be suitable for all investors. There is a possibility that you could sustain a loss of all of your investment and therefore you should not invest money that you cannot afford to lose. You should be aware of all the risks associated with Foreign Exchange trading.

Real Forex daily market analysis

USD/CAD

Daily graph: http://www.real-forex.com/charts-daily/November2010/CAD_DAILY_091110.JPG

usd/cad daily

For the last few weeks, the pair is navigating and doesn’t have any specific trend. A vain breach occurred during the session of 08-11-2010 and today’s session is likely to be closed above it in an uptrend situation. That vain breach disclosed an opportunity to go “Long”.

For most of the “Long” market orders, the identification of an increasing configuration on one-hour graph should be a prior step.

Potential trade

One-hour graph: http://www.real-forex.com/charts-daily/November2010/CAD_1H_091110.JPG

usd/cad 1h

Once the resistance of 1.0057 will be crossed upward, the required configuration should appear. There are several possible orders, and following is the one made by our analysts:

–        “Limit” order on “Long” position 10 pips above the mentioned hourly resistance, meaning: 1.0067.

–        “Stop Loss” on the last low appeared, which is: 1.0010.

–        1st degree for “Take Profit” on the following resistance: 1.0086

CAD/JPY

Daily graph: http://www.real-forex.com/charts-daily/November2010/CAD_JPY_DAILY_091110.JPG

cad/jpy daily

Actually, the pair is on its way to the upper level of the navigation started a few sessions ago. The current resistance and support of the channel are 81.78 and 78.66.

The pair reached in the last session the level of 81.4 and is very likely to reach the resistance today. Its behavior when the resistance will be reached will determine the future trend as well the future potential trade:

–         A vain breach of the resistance could result in a new downtrend, allowing the opportunity to go “Short”.

–         The resistance is crossed and broken. In such a case, an opportunity to go “Long” should be created after the occurrence of a technical correction and the identification of an increasing configuration on One-Hour graph.

Have a profitable Day!

Real-Forex team. logo

Forex – Dollar higher vs. Chinese Yuan as USD/CNY trades at 6.6440

Update: The US dollar has started the week off stronger against the Chinese yuan in foreign exchange.

The USD/CNY exchange rate touched a high point today of 6.6597 before pulling back and has settled in currently near the 6.6426 exchange level.

Today’s high marked the USD/CNY’s highest level since October 28th when the dollar exchanged as high as 6.6697 against the Chinese currency.

USD/CNY Chart

chinese yuan, us dollar, usd/cny

About the Author

FxNewsChina.com – Forex News China

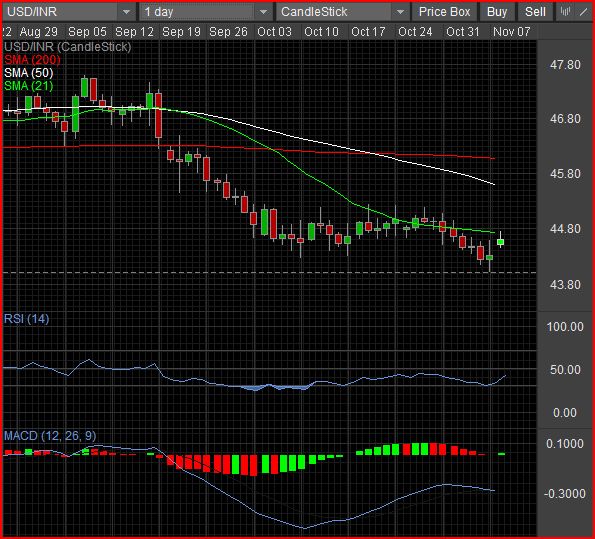
Forex: US Dollar rises against Indian Rupee as USD/INR trades above 44.50

By FxNewsIndia – The US dollar has gained ground against the Indian rupee today in the foreign exchange market and touched its highest exchange rate in approximately a week after a decline last week.  The high point for the USD/INR currency pair today reached the 44.74 level which marks the highest rate for the dollar against the rupee since November 1st, according to currency data by Oanda.

The USD/INR came back above the 44.50 exchange rate Monday after falling to its lowest point of the year in Friday’s forex trading near the 44.00 exchange rate.

The Indian rupee was boosted against the dollar last week as the US Federal Reserve implemented a new round of quantitative easing to help drive growth for the US economy and prompted investors to sell dollars. Meanwhile, the Reserve Bank of India also raised their interest rates on November 2nd to help fight the countries inflationary pressures. The rate hike was by 25 basis points and brought the lending repo rate to 6.25 percent and the reverse repo rate to 5.25 percent.

USD/INR – The US dollar rising against the Indian rupee in forex and trading near the 21-day simple moving average in green.

indian rupee, us dollar, forex

About the Author

FxNewsIndia.com – India Forex News

“Market Manipulation” Is Not Why Most Traders Lose

A look at EWI president Robert Prechter’s requirements for successful trading

By Elliott Wave International

How often have you heard analysts refer to a down day on Wall Street as “traders taking profits”? Sounds great, but the sobering fact is that most traders — in futures, commodities, or forex — lose money.

Any book on trading will list for you the many reasons why most traders lose. Yet some traders do win; some even set records. In 1984, Elliott Wave International’s founder and president Robert Prechter won the U.S. Trading Championship, setting a new all-time profit record of 444.4% in a monitored real-money options account. Later in his monthly Elliott Wave Theorist, Prechter published a Special Report “What A Trader Really Needs To Be Successful” with 5 important insights for would-be market speculators (including the explanation of why “market manipulation” is not why most traders lose.)

Here’s a quick excerpt — and to read Prechter’s Special Report in full, free, look below.

“What A Trader Really Needs To Be Successful” (excerpt)
By Robert Prechter

Ever since winning the United States Trading Championship in 1984 (see footnotes, p.4), subscribers have asked for a list of “tips” on trading, or even a play-by-play of the approximately 200 short term trades I made while following hourly market data over a four month period. Neither of these would do anyone any good. What successful trading requires is both more and less than most people think.

In watching the reports of each new Championship over the past three years, it has been a joy to see what a large percentage of the top winners have been Elliott Wave Theorist subscribers and telephone consultation customers. (In fact, in the latest “standings” report from the USTC, of the top three producers in each of four categories, half are EWT subscribers!) However, while good traders may want the input from EWT, not all EWT subscribers are good traders. Obviously the winners know something the losers don’t. What is it? What are the guidelines you really need to meet in order to trade the markets successfully?

When I first began trading, I did what many others who start out in the markets do: I developed a list of trading rules. The list was created piecemeal, with each new rule added, usually, following the conclusion of an unsuccessful trade. I continually asked myself, what would I do differently next time to make sure that this mistake would not recur? The resulting list of “do’s” and “don’ts” ultimately comprised about 16 statements. Approximately six months following the completion of my carved-in-stone list of trading rules, I balled up the paper and threw it in the trash.

What was the problem with my list, a list typical of so many novices who think they are learning something? After several months of attempting to apply the “rules,” it became clear that I made not merely a mistake here and there in the list, but a fundamental error in compiling the list in the first place. The error was in taking aim at the last trade each time, as if the next trading situation would present a similar problem. By the time 16 rules are created, all situations are covered and the trader is back to square one.

Let me give you an example of the ironies that result from the typical method of generating a list of trading rules. One of the most popular trading maxims is, “You can’t go broke taking a profit.” (The brokers invented that one, of course, which is one reason that new traders always hear of it!) This trading maxim appears to make wonderful sense, but only when viewed in the context of a recent trade with a specific outcome. When you have entered a trade at a good price, watched it go your way for a while, then watched it go against you and turn into a loss, the maxim sounds like a pronouncement of divine wisdom. What you are really saying, however, is that in the context of the last trade “I should have sold when I had a small profit.”

Now let’s see what happens on the next trade. You enter a trade, and after just a few days of watching it go your way, you sell out, only to stare in amazement as it continues to go in the direction you had expected, racking up paper gains of several hundred percent. You ask a more experienced trader what your error was, and he advises you sagely while peering over his glasses, “Remember this forever: Cut losses short; let profits run.” So you reach for your list of trading rules and write this maxim, which means only, of course “I should NOT have sold when I had a small profit.”

So trading rules #2 and #14 are in direct conflict. Is this an isolated incident? What about rule #3, which reads, “Stay cool; never let emotions rule your trading,” and #8, which reads, “If a trade is obviously going against you, get out of the way before it turns into a disaster.” Stripped of their fancy attire, #3 says, “Don’t panic during trading” and #8 says, “Go ahead and panic!” Such formulations are, in the final analysis, utterly useless.

What I finally desired to create was a description not of each of the trees, but of the forest. After several years of trading, I came up with — guess what — another list! But this is not a list of “trading rules”; it’s a list of requirements for successful trading. Most worthwhile truths are simple, and this list contains only five items. …

Read the rest of Prechter’s report now, free! Here’s what you’ll learn:

  • Why a trading method is a “must” for your success
  • What part discipline plays in your trading success
  • Why “market manipulation” is not why most traders lose
  • How to gain trading experience
  • More

This article was syndicated by Elliott Wave International and was originally published under the headline “Market Manipulation” Is Not Why Most Traders Lose. EWI is the world’s largest market forecasting firm. Its staff of full-time analysts led by Chartered Market Technician Robert Prechter provides 24-hour-a-day market analysis to institutional and private investors around the world.

The Next Major Disaster Developing for Bond Holders

A must-read FREE report for investors in fixed-income markets like Treasury bonds, municipal bonds or high-yield bonds

By Elliott Wave International

Elliott wave analysis can warn you of trend changes when the rest of the investment public least expects a market reversal. With that in mind, we have created a new report for our free Club EWI members: “The Next Major Disaster Developing for Bond Holders.”

In this free report, you get some of the latest commentary on fixed-income markets adapted from various Elliott Wave International’s publications, including 2010 issues of Robert Prechter’s monthly Elliott Wave Theorist and its sister publication, The Elliott Wave Financial Forecast.

Enjoy this excerpt — and for details on how to read this important Club EWI report free, today, look below.

The Next Major Disaster Developing for Bond Holders
(excerpt)

The Elliott Wave Theorist — October 2010
(By Robert Prechter, EWI president)

…History shows that investors have been attracted like moths to a flame to four consecutive pyres: the NASDAQ in 2000, real estate in 2006, the blue chips in 2007 and commodities in 2008. Now they are flitting across the veranda to a mesmerizing blue flame: high yield bonds. Bonds pay high yields when the issuers are in deep trouble and cannot otherwise attract investment capital. The public is chasing a large return on capital without considering return of it. …

Annual Value of U.S. High-Yield Debt Issued

The Elliott Wave Financial Forecast — October 2010
(By Steve Hochberg and Pete Kendall)

The rise in optimism since early 2009 has allowed corporations to issue the lowest grade debt at a record rate, even more than in the middle of the incredible expanding debt bubble of the mid-2000s. The annual total of $189.9 billion to date is a record, and the entire fourth quarter still lies ahead.

This is a stunning testimony to just how desperate investors are for the returns they grew so accustomed to during the old bull market. The Moody’s BAA-to-Treasury spread (see chart in the free report — Ed.) has been widening since [April] and has made a series of lower highs in August and again in September. This behavior reveals an emerging preference for perceived safer debt even as junk bond issuance races higher. It is a critical non-confirmation…

Read the rest of this important report online now, free! Here’s what else you’ll learn:

  • How Investors Are Looking Past Red Flags in Muni Market
  • What You Should Know About Today’s “High-Grade” Bonds
  • The Answer To Bond Selection
  • MORE

This article was syndicated by Elliott Wave International and was originally published under the headline The Next Major Disaster Developing for Bond Holders. EWI is the world’s largest market forecasting firm. Its staff of full-time analysts led by Chartered Market Technician Robert Prechter provides 24-hour-a-day market analysis to institutional and private investors around the world.

Forex: Currency Futures Speculators add to positions against US Dollar

By CountingPips.com

The latest Commitments of Traders (COT) report, released on Friday by the Chicago Mercantile Exchange, showed that futures speculators reversed the past three weeks trend and increased their bets in favor of the major currencies against the US dollar. Non-commercial futures positions, those taken by hedge funds and large speculators, were overall net short the US dollar by $24.53 billion against other major currencies as of November 2nd, up from a total short position of $23.1 billion on October 26th, according to data published by Reuters which calculates the dollar positions against the euro, British pound, Japanese yen, Australian dollar, Canadian dollar and the Swiss franc. Speculators previously had raised their bets for the dollar three straight weeks through October 26th.

On an individual currency basis, speculators added to their long positions for the British pound sterling, Canadian dollar, Japanese yen, Mexican peso and the New Zealand dollar while cutting long positions in the euro, Swiss franc and the Australian dollar compared to the week before.

EuroFx: Currency specs were net long the euro against the U.S. dollar by 38,610 contracts as of November 2nd. This is a decrease of nearly 2,000 contracts following net long positions of 40,505 contracts on October 26th.

The COT report is published every Friday by the Chicago Mercantile Exchange (CME) and shows futures positions as of the previous Tuesday. It can be a useful tool for traders to gauge investor sentiment and to look for potential changes in the direction of a currency or commodity. Each currency contract is a quote for that currency directly against the U.S. dollar, where as a net short amount of contracts means that more speculators are betting that currency to fall against the dollar and net long position expect that currency to rise versus the dollar. Open interest is the number of open contracts that have not been closed by a transaction or by delivery.

GBP: The British pound sterling positions rose higher to a net of 15,182 contracts after being long on October 26th by 5,089 positions. The latest data reverses three straight weeks of declines in the GBP long positions.

JPY: The Japanese yen net long contracts rose slightly to 46,455 long contracts as of November 2nd from 43,129 net long contracts reported on October 26th.

CAD: The Canadian dollar positions advanced higher after two declining weeks to a net total of 23,365 contracts after totaling 19,875 net longs on October 26th.

CHF: Swiss franc long positions were essentially unchanged at 12,465 long contracts as of November 2nd after totaling a net of 12,519 long contracts on October 26th.

AUD: The Australian dollar positions decreased lower for the fifth straight week after reaching their highest level since April on September 28th. AUD futures contracts declined to a net amount of 51,180 long contracts as of November 2nd from 55,115 long contracts on October 26th.

NZD: New Zealand dollar futures positions jumped higher to their highest level all year at a total of 19,148 long contracts after a total of 15,871 long contracts the week before.

MXN: Mexican peso long contracts edged higher as of November 2nd to 82,272 net long positions from 80,143 longs the week prior. The latest data marks reverses three straight weeks of small declines for the Mexican peso speculative positions.

COT Data Summary as of November 2nd, 2010
Large Speculators Net Positions vs. the US Dollar

Euro: +38,610 contracts from +40,505 contracts
British pound sterling: +15,182 contracts from +5,089 contracts
Australian dollar: +51,180 contracts from +55,115 contracts
Canadian dollar: +23,365 contracts from +19,875 contracts
Japanese yen: +46,455 contracts from +43,129 contracts
Mexican peso: +82,272 contracts from +80,143 contracts
New Zealand dollar: +19,148 contracts from +15,871 contracts
Swiss franc: +12,465 contracts from +12,519 contracts

Go to the Commitment of Traders CME raw futures data

Further COT Resources from around the web:

Will Crude Oil Follow Gold’s Path?

crude oil, petroleum, gold, commodities, commodities market, commodities trading, ron acoba, laidtrades, laid trades,

Hello finance peeps! Today I’m going to talk about crude oil. If you have been tuned in to the markets for the last several months, perhaps you know or at least have heard from someone that commodities like gold and silver have recently marked their new historical highs. But unlike those two metals, the people’s “black gold” managed to stay out of the radar. In fact, during the time when both gold and silver were making new highs after another, the price of crude oil has only traded sideways – between $70.000 per barrel and $87.350. As you can see from it’s weekly chart, the price of crude oil is now trading right at the trading range’s or the box’s resistance. Two scenarios can occur next. One is that crude could break above the said resistance. If it does, then it’s next upside target would be at the psychological 100.000 level. But given it’s overbought condition, it could also bounce off the resistance and weaken once again.

The question now is, will crude oil follow the gold’s path?

The US Federal Reserve’s (central bank) decision to flood the market with more dollars by buying additional $600 billion worth of long-term US Treasuries or US debt over the next eight months only further dilutes the greenback’s valuation. Of course, it is the intent of the central bank to lower the day-to-day lending rate in the US to encourage more lending, thus, more spending. So just by looking at the US’s money supply, the expected and earmarked increase in money would as we know reflect negatively on the dollar against other assets like the anti-dollar currencies, commodities like gold, and now perhaps even oil.

Investors, of course, would have no choice but to divert their funds away from the greenback to commodities like gold and now, silver as they presummingly retain their intrinsic value. And given the decline in the dollar’s purchasing power, the oil producers/sellers which have accounts receivables that are denominated in dollars would sooner or later be forced to hike their prices or at least influence such by controlling the supply end to compensate for the USD’s downfall. On the demand side, since oil is essentially the lifeblood of the global economy as practically most industries run on it, an improvement in the state of the global economy which would increase business activity, would consequently increase the need for oil as well, reflecting an to a higher price.

Therefore, a jump in the prices of crude would of course boost the oil companies’ revenues, thus, making their shares more attractive. Such would likewise reflect on currencies like the Canadian dollar or the Loonie. In case you do not know, Canada’s major export to its neighbor down south (the US) is crude. Hence, an increase in oil demand from the US given a expansion in oil prices as well would push Canada’s overall output (in terms of dollars) also. Furthermore, it has been observed that crude oil and the Loonie have a relatively high positive correlation. Meaning, an increase in the prices of oil would usually reflect on the CAD.

More on LaidTrades.com

Spot Crude Oil Support and Resistance Levels

By Russell Glaser – While the dollar may be the largest casualty from the Fed’s commitment to purchase 600 billion dollars worth of US government bonds, the biggest winner may be crude oil.

Following the Fed’s announcement that essentially loosens US monetary policy, crude oil is testing its highest price since May.

A weak dollar is one reason for the rise in the price of crude oil. As the greenback weakens, crude oil becomes less expensive for those who hold foreign currencies. Another reason for the price increase in crude oil is the expected recovery in the US economy.

Looking at the weekly chart of crude oil, we can see that a key resistance level rests between $86 and $87 dollars. This resistance level stems from instances in December of last year and May of the current year.

We will be looking for a close above the $87 level to induce further buying of crude oil.

Two resistance levels traders should keep in mind are the $90.50 mark, along with the psychologically important $100 a barrel price.

This week’s supports rest at the mid October low of $79.80 and the long term rising trend line at $76.

Forex Market Analysis provided by ForexYard.

© 2006 by FxYard Ltd

Disclaimer: Trading Foreign Exchange carries a high level of risk and may not be suitable for all investors. There is a possibility that you could sustain a loss of all of your investment and therefore you should not invest money that you cannot afford to lose. You should be aware of all the risks associated with Foreign Exchange trading.